


The Florida Climate Center serves as the primary resource for climate data, information, and services in the state of Florida.

The Florida Climate Center achieves its mission by providing climate monitoring, research, and expertise to be applied by the people, institutions, and businesses of Florida and the surrounding region.
We provide direct service by fulfilling requests for climate and weather data and information in a variety of formats.
We perform research that advances the understanding of the climate variability and changes of Florida and the surrounding region.
We provide outreach in presentations and at events aimed at a variety of groups, interests, and ages.
Prepared by Preston Leftwich, David F. Zierden, and Melissa Griffin
Florida Climate Center
The Florida State University
Tallahassee, FL

Average temperatures well below normal in March. For a third consecutive month, average temperatures for March were well below normal across the entire state (Table 1). Primary reporting stations observed average temperatures for the month more than four degrees below normal, with Orlando and Key West more than six degrees below normal. On March 5th several daily minimum temperature records were set or tied (Table 2). In particular, the minimum temperature (53° F) at Key West on the 5th tied a daily record from 1873. The average temperature at Vero Beach (61.2° F) tied the record for the coldest March, previously observed in 1969. Also, the average temperature at Naples (63.6° F) was the coldest on record for March.
Table 1: March average temperatures and departures from normal (°F) for selected cities.
| Station | Average Temperature | Departure from Normal |
| Pensacola | 55.8 | -5.2 |
| Tallahassee | 55.7 | -5.4 |
| Jacksonville | 56.7 | -4.9 |
| Orlando | 60.9 | -6.5 |
| Tampa | 61.6 | -5.8 |
| Miami | 67.7 | -4.7 |
| Key West | 67.7 | -6.1 |
Table 2: Minimum temperature (°F) records tied or broken during March (compiled from NWS).
| Date | Station | Temperature | Previous Record |
| 5 | Orlando | 37 | 38 in 2002 |
| 5 | Melbourne | 35 | 36 in 1960 |
| 5 | Vero Beach | 33 | 37 in 1999 |
| 5 | Miami | 44 t | 44 in 1930 |
| 5 | Miami Beach | 43 | 45 in 1927 |
| 5 | W. Palm Beach | 39 | 40 in 1971 |
| 5 | Key West | 53 t | 53 in 1873 |
| 6 | Gainesville | 28 t | 28 in 1962 * |
| 6 | Fort Myers | 42 t | 42 in 1978 |
| 7 | Melbourne | 38 | 39 in 1966 |
| 31 | Key West | 58 | 59 in 2003 |
| t: tied * last of multiple occurrences | |||
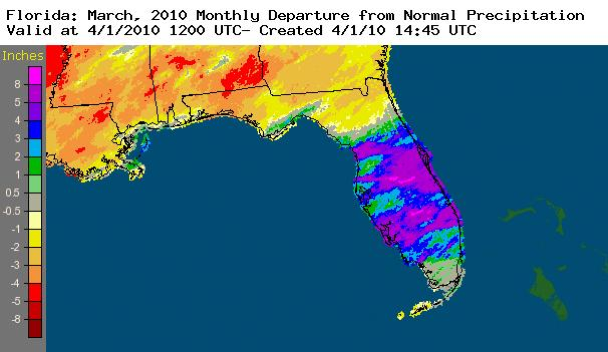
March rainfall well above normal in central areas. Rainfall totals for March were well above normal across central Florida, below normal across much of northern Florida and generally near normal in southern Florida (Table 3). Pensacola (0.82") and Key West (-1.52") were locally above and below normal, respectively. Numerous daily rainfall records were set on March 11th and 12th (Table 4). The widespread area of above normal rainfall in central Florida and a narrow band of above normal rainfall along the northern Gulf coast are evident in Figure 1.
Table 3: March precipitation totals and departures from normal (inches) for selected cities.
| Station | Total Rainfall | Departure from Normal |
| Pensacola | 7.22 | 0.82 |
| Tallahassee | 5.11 | -1.36 |
| Jacksonville | 1.87 | -2.06 |
| Orlando | 8.87 | 5.33 |
| Tampa | 5.88 | 3.04 |
| Miami | 2.81 | 0.25 |
| Key West | 0.34 | -1.52 |
Table 4: Daily rainfall records (inches) set during March (compiled from NWS).
| Date | Station | Amount | Previous Record |
| 11 | Tallahassee | 2.25 | 0.98 in 1956 |
| 11 | Orlando | 2.60 | 2.11 in 1996 |
| 11 | Vero Beach | 3.22 | 2.97 in 1996 |
| 12 | Orlando | 1.20 | 0.78 in 1959 |
| 12 | Melbourne | 1.23 | 0.65 in 1953 |
| 12 | Vero Beach | 2.69 | 1.03 in 1958 |
| 12 | Fort Myers | 3.56 | 3.44 in 1970 |
| 12 | Miami | 1.20 | 1.04 in 1995 |
| 12 | W. Palm Beach | 4.99 | 2.44 in 1958 |
| 28 | Vero Beach | 2.26 | 1.03 in 1965 |
| 29 | Melbourne | 1.89 | 1.61 in 2001 |
Figure 1. A graphical depiction of the monthly rainfall departure from normal (inches) for March is given in the figure below (courtesy of NOAA, NWS).
El Niño continues to impact Florida. Sea surface temperatures in the equatorial Pacific Ocean remained more than 1.0° C above normal, designating moderate El Niño conditions. Weather in Florida continued to follow expected El Niño-related conditions. A series of surface low pressure areas moved from west to east to the north of Florida during March, each followed by cold fronts that reinforced cold air across the state. This resulted in continued colder than average conditions across the whole state, and significantly wetter than average conditions in the central part of the state.
Hazardous weather. Thunderstorm wind damage occurred near New Port Richey on the 1st. Weak tornadoes, which touched down near Chassahowitzka, Auburndale and Haines City, and thunderstorm winds near Santos, Hernando and Zephyrhills caused minor damage on the 11th. Later in the month, weak tornadoes caused minor damage near Melbourne (28th) and Oakland Park (29th). Hail up to one inch in diameter was observed at Buckhead Ridge on the 28th.
Agricultural and other impacts. Wet weather early in the month hampered field work. Persistent cold weather slowed vegetable growth in most areas. Freezing temperatures caused some damage to sugarcane and nursery crops in the South. However, the sugarcane harvest was nearly complete by the end of the month. Heavy, soaking rains across central and some southern areas benefitted citrus crops. Although forage growth varied across the state due to locally heavy rainfall and cold temperatures, most cool season forage was near maturity by the end of the month.
Prepared by Preston Leftwich, David F. Zierden, and Melissa Griffin
Florida Climate Center
The Florida State University
Tallahassee, FL
Average temperatures well below normal for February. Monthly average temperatures in February were well below normal across the entire state (Table 1). Primary reporting stations observed average temperatures for the month at least four degrees below normal, with stations in northern and central Florida more than seven degrees below normal. Minimum temperatures at Pensacola (26°F) and Tallahassee (24°F) on the 16th both tied records for the date. The strength of the cold was evident again this month as at least 15 record low maxima were set or tied across the central and southern portions of the state. In particular, the maximum temperature in Key West of 57°F on the 14th broke the record of 58°F established in 1899.
Table 1: February average temperatures and departures from normal (°F) for selected cities.
| Station | Average Temperature | Departure from Normal |
| Pensacola | 46.7 | -8.2 |
| Tallahassee | 46.5 | -8.3 |
| Jacksonville | 48.6 | -7.2 |
| Orlando | 54.7 | -7.9 |
| Tampa | 55.0 | -7.7 |
| Miami | 64.6 | -4.5 |
| Key West | 64.7 | -6.1 |
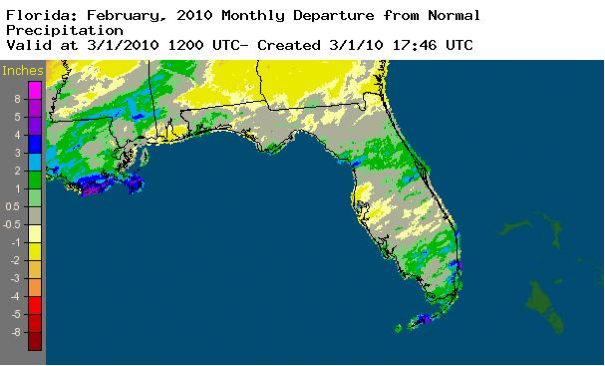
February rainfall generally above normal in southern areas and near normal in northern and central areas. Rainfall totals for February well above normal at some southern stations, while totals were near normal across most of northern and central Florida (Table 2). Heaviest rainfall occurred in extreme southern areas as surface low pressure systems moved across the peninsula. Daily record amounts were recorded at Miami (2.90"), Key West (1.60") and Orlando (0.62") on the 1st. On the 5th, Apalachicola recoded a disly record amount of 2.30 inches. One inch of snow was reported at Jay and DeFuniak Springs on the 12th. A trace of snow was observed at numerous locations in northwest Florida from Pensacola eastward to Tallahassee overnight from the 11th to the 12th.
Table 2: February precipitation totals and departures from normal (inches) for selected cities.
| Station | Total Rainfall | Departure from Normal |
| Pensacola | 6.03 | +1.35 |
| Tallahassee | 4.97 | +0.34 |
| Jacksonville | 2.71 | -0.44 |
| Orlando | 4.35 | +2.00 |
| Tampa | 1.99 | -0.68 |
| Miami | 4.69 | +2.62 |
| Key West | 4.63 | +3.12 |
A graphical depiction of the monthly rainfall departure from normal (inches) for February is given in the figure below (courtesy of NOAA, NWS).
El Niño continues to impact Florida. Sea surface temperatures in the equatorial Pacific Ocean reached 1.2° C above normal, designating moderate El Niño conditions. An active storm track in the Southeast, associated with El Niño conditions, was along the Gulf coast and across the peninsula. This brought above normal rainfall to both northwestern and southern areas.
Hazardous weather. Thunderstorm winds toppled a tent at the Florida Fairgrounds near Temple Terrace on the 5th, injuring seven people. On the 12th, thunderstorm winds up to 70 miles per hour produced damage across Miami-Dade County. Later in the month, two golfers were injured by hail near Palm City on the 24th.
Agricultural and other impacts. Potato farmers near Hastings replanted crops after recent heavy rains and flooded fields caused rotting. Snow in the extreme northwest halted field work briefly. Below normal temperatures slowed development of vegetable crops in many southern areas. Drier weather later in the month allowed vegetables and watermelons to be planted around Lake Okeechobee.
Prepared by Preston Leftwich, David F. Zierden, and Melissa Griffin
Florida Climate Center
The Florida State University
Tallahassee, FL
Average temperatures well below normal for January. Monthly average temperatures in January were well below normal across the entire state (Table 1). Primary reporting stations observed average temperatures for the month at least four degrees below normal. Average temperatures at Jacksonville (48.1° F) and Tampa (54.7° F) were both the sixth coldest recorded for January.
Table 1: January average temperatures and departures from normal (°F) for selected cities.
| Station | Average Temperature | Departure from Normal |
| Pensacola | 46.8 | -5.2 |
| Tallahassee | 46.9 | -4.9 |
| Jacksonville | 48.1 | -5.0 |
| Orlando | 54.4 | -6.5 |
| Tampa | 54.7 | -6.6 |
| Miami | 64.1 | -4.0 |
| Key West | 64.2 | -6.1 |
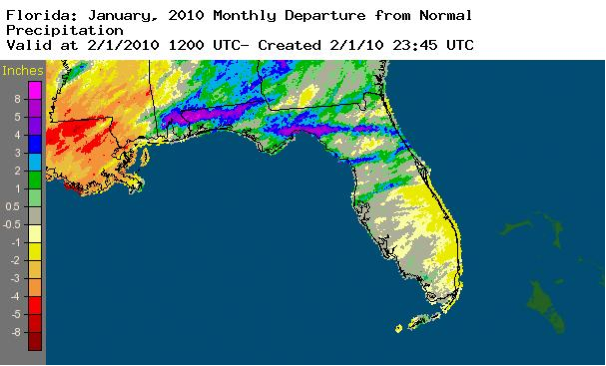
January rainfall generally above normal in northern areas and below normal in central and southern areas. Rainfall totals for January were somewhat above normal at northern stations, while totals were below normal across most of central and southern Florida (Table 2). Heaviest rainfall occurred as surface low pressure systems moved across the Southeast to the north of the state. Monthly rainfall at Tallahassee (8.09 inches) produced the tenth wettest January on record. Also, Tallahassee set daily records of 2.04 inches on the 16th and 4.66 inches on the 21st. Among other daily records were 1.71 inches at Jacksonville and 1.85 inches at Gainesville on the 21st, then 2.45 inches at Orlando on the 22nd.
Table 2: January precipitation totals and departures from normal (inches) for selected cities.
| Station | Total Rainfall | Departure from Normal |
| Pensacola | 6.07 | 0.73 |
| Tallahassee | 8.09 | 2.73 |
| Jacksonville | 3.96 | 0.27 |
| Orlando | 3.53 | 1.10 |
| Tampa | 3.42 | 1.15 |
| Miami | 0.89 | -0.99 |
| Key West | 1.15 | -1.07 |
A graphical depiction of the monthly rainfall departure from normal (inches) for January is given in the figure below (courtesy of NOAA, NWS). Amounts of more than eight inches above normal are evident in the northwest.
El Niño continues to impact Florida. Sea surface temperatures in the equatorial Pacific Ocean reached 1.2° C above normal, designating moderate El Niño conditions. An active storm track in the Southeast, associated with El Niño conditions, was just north of Florida during January. This led to the heaviest rainfall remaining in northern areas.
Hazardous weather. January 21 was an active day of severe storms across north Florida. On the 21st, hail up to golfball-size (1.75 inch diameter) was observed near Crawfordville and Green Cove Springs, a tornado occurred near Starke, and numerous reports of thunderstorm wind damage were received from the Panhandle eastward to the Atlantic coast. Wind damage was also reported near Ocala and Thonotosassa. As a cold front moved down the peninsula on the 22nd, a weak tornado toppled trees and caused minor structural damage as it traveled along a six-mile path in Brevard County.
Agricultural and other impacts. The U.S. Department of Agriculture declared nearly all Florida counties as natural disaster areas after record cold struck in early and mid-January. Growers and grower groups say the cold damaged a minimum of a third of the state's winter produce and up to 75% of south Florida vegetables. There were significant losses to sugarcane, beans, squash, tomatoes and strawberries. Citrus producers harvested as much fruit as possible while it was still marketable. Heavy rain and cold in north Florida adversely affected pastures and potato planting. Toward the end of the month, more seasonable temperatures allowed some pasture recovery. Use of irrigation to prevent freezing of crops in west central Florida greatly lowered the aquifer. Numerous sinkholes have opened, producing damage to structures and closing highways. Additionally, many private wells have gone dry.
Prepared by Preston Leftwich, David F. Zierden, and Melissa Griffin
Florida Climate Center
The Florida State University
Tallahassee, FL
Most average temperatures near normal for December. Monthly average temperatures in December were near normal across most of the state (Table 1). Exceptions were Pensacola (2.4°F below normal) and Miami (3.1°F above normal). Numerous daily maximum temperature records were observed (Table 2). Among these, all-time highest temperatures for December were recorded at Miami (89°F on the 10th), Vero Beach (87°F on the 2nd) and West Palm Beach (90°F on the 9th). The all-time warmest temperature for December at Miami broke a record established in 1896.
Table 1: December average temperatures and departures from normal (°F) for selected cities.
| Station | Average Temperature | Departure from Normal |
| Pensacola | 51.7 | -2.4 |
| Tallahassee | 53.7 | 0.0 |
| Jacksonville | 56.3 | 1.3 |
| Orlando | 63.8 | 0.8 |
| Tampa | 63.2 | -0.1 |
| Miami | 73.0 | 3.1 |
| Key West | 73.4 | 1.4 |
Table 2: Maximum temperature (°F) records tied or set during December (compiled from NWS).
| Date | Station | Temperature | Previous Record |
| 2 | Melbourne | 85 | 84 in 1981 |
| 2 | Vero Beach | 87 ** | 85 in 2006 * |
| 9 | Daytona Beach | 85 t | 85 in 1978 |
| 9 | Lakeland | 85 t | 85 in 1986 * |
| 9 | Pensacola | 79 | 78 in 1986 |
| 9 | Vero Beach | 87 | 84 in 1997 |
| 9 | W. Palm Beach | 90 ** | 87 in 1948 |
| 10 | Ft. Lauderdale | 87 | 86 in 1997 |
| 10 | Key West | 84 t | 84 in 1993 |
| 10 | Miami | 89 ** | 86 in 1896 |
| 10 | Vero Beach | 85 t | 85 in 1978 |
| 10 | W. Palm Beach | 87 | 86 in 1997 |
| 13 | Vero Beach | 86 t | 86 in 1961 * |
| 14 | Lakeland | 84 t | 84 in 2001 |
| 15 | Jacksonville | 84 | 83 in 1972 |
| 15 | Miami | 85 | 83 in 2007 |
| t=tied *last of multiple occurrences **all-time highest for December | |||
December rainfall totals well above normal at northern, central, and east-coastal areas. Rainfall totals for December were more than three inches above normal in northern and central parts of the state, as well as several east-coastal areas (Table 3). Pensacola and Tallahassee were more than nine and six inches above normal, respectively. Numerous daily precipitation records were tied or set during December (Table 4). Several of these records had existed for many years. Of particular note, 5.74" on the 2nd at Tallahassee broke a daily record established in 1896, and 0.42" at Key West on the 5th broke a daily record established in 1886.
Table 3: December precipitation totals and departures from normal (inches) for selected cities.
| Station | Total Rainfall | Departure from Normal |
| Pensacola | 13.75 | 9.78 |
| Tallahassee | 10.92 | 6.82 |
| Jacksonville | 5.88 | 3.24 |
| Orlando | 5.39 | 3.08 |
| Tampa | 2.32 | 0.02 |
| Miami | 3.01 | 0.83 |
| Key West | 4.49 | 2.35 |
Table 4: Daily precipitation (inches) records tied or set during December (compiled from NWS)
| Date | Station | Amount | Previous Record |
| 2 | Apalachicola | 3.72 | 0.35 in 1985 |
| 2 | Tallahassee | 5.34 | 1.93 in 1896 |
| 4 | Daytona Beach | 1.61 | 1.17 in 1953 |
| 4 | Fort Myers | 2.17 | 1.22 in 1994 |
| 5 | Fort Myers | 0.82 | 0.50 in 1937 |
| 5 | Key West | 0.42 | 0.41 in 1886 |
| 15 | W. Palm Beach | 3.10 | 1.33 in 1958 |
| 18 | Ft. Lauderdale | 2.45 | 1.98 in 1917 |
| 18 | Key West | 3.28 | 1.90 in 1928 |
| 18 | Melbourne | 1.68 t | 1.68 in 1999 |
| 18 | Naples | 1.70 | 0.62 in 1954 |
| 18 | Vero Beach | 1.87 | 0.70 in 1999 |
| 18 | W. Palm Beach | 1.90 | 1.07 in 1923 |
| t=tied | |||
A graphical depiction of the monthly rainfall departure from normal (inches) for December is given in the figure below (courtesy of NOAA, NWS). Amounts of more than eight inches above normal are evident in the northwest.
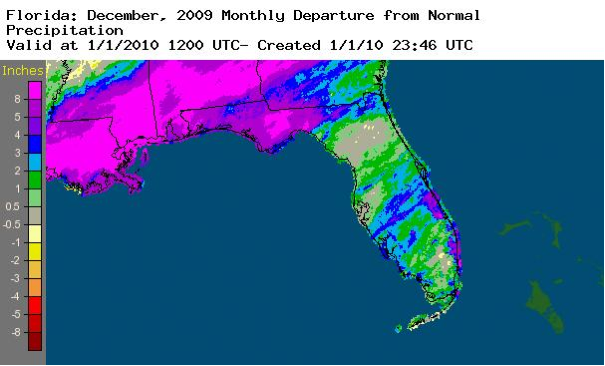
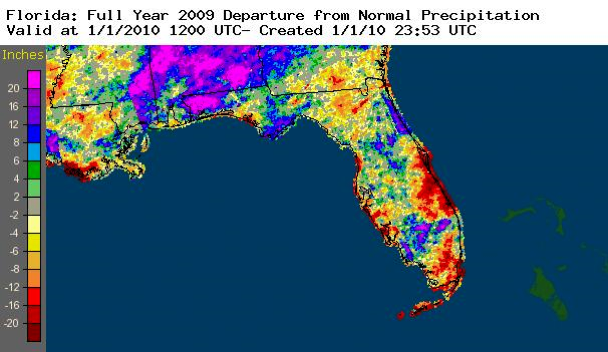
Also, a graphical depiction of annual rainfall departures from normal for 2009 is given in the Appendix.
El Niño continues to impact Florida. Sea surface temperatures in the equatorial Pacific Ocean remained above the 0.5°C threshold designating El Niño conditions during December. Florida weather fit well the conceptual model for winter El Niño climate patterns. Heaviest rainfall and several severe weather events occurred near surface low pressure systems associated with an active southern jet stream. Increased cloudiness often kept nighttime temperatures high, and eight high-minimum temperature records were set. In particular, the minimum temperature at Daytona Beach on the 9th (72°F) was the all-time high-minimum for December.
Hazardous weather. In the north, a tornado touched down near Crestview and wind damage occurred near Panama City, Jacobs and McAlpin on the 2nd. On the 9th, wind damage occurred near Chattahoochee and a tornado damaged houses near Tallahassee. Later in the month, tornadoes were observed near Homestead, Key West and Ona, as well as wind damage near Holoran, on the 18th. As a cold front pushed across north Florida, wind damage was reported near Ft. Walton Beach on the 24th and near Live Oak on the 25th.
Agricultural and other impacts. Persistent wet conditions from early in the month have hindered fieldwork in the north. Fall and winter plantings were also slowed by wet ground. Sugar cane harvest was active despite some delays due to locally heavy rain. A variety of winter vegetables were harvested, although wet conditions caused some disease and quality problems.
APPENDIX
A graphical depiction of the annual rainfall departure from normal (inches) for 2009 is given in the figure below (courtesy of NOAA, NWS).
Prepared by Preston Leftwich, David F. Zierden, and Melissa Griffin
Florida Climate Center
The Florida State University
Tallahassee, FL
Temperatures near normal for November. Monthly average temperatures in November were near normal (Table 1). Early in the month a daily maximum temperature record was tied at Melbourne ( 87 °F on the 1st) and set at Miami ( 89 °F on the 3rd). After a strong cold front moved down the peninsula on the 26th, minimum temperatures across north Florida dipped into the 30s, with Tallahassee (31 °F) falling just below freezing on the 27th. The minimum temperature at Orlando was 20 °F below the daily normal on the 27th. Along the Atlantic coast minimum temperatures were more than 25 °F below the daily normal at Melbourne and Daytona Beach on the 28th.
Table 1: November average temperatures and departures from normal (°F) for selected cities.
| Station | Average Temperature | Departure from Normal |
| Pensacola | 59.6 | -1.1 |
| Tallahassee | 59.0 | -1.4 |
| Jacksonville | 62.3 | 0.6 |
| Orlando | 67.9 | 0.9 |
| Tampa | 68.9 | -0.4 |
| Miami | 75.7 | 1.3 |
| Key West | 75.9 | -0.4 |
November rainfall totals generally near or below normal. Rainfall totals for November were slightly below normal across most of the state (Table 2). However, daily precipitation records were set at Vero Beach (2.63" on the 3rd), Gainesville (1.21" on the 25th), and Key West (5.05" on the 26th). The monthly rainfall departure from normal at Key West (3.99") resulted mainly from the one-day record total.
Table 2: November precipitation totals and departures from normal (inches) for selected cities.
| Station | Total Rainfall | Departure from Normal |
| Pensacola | 4.85 | 0.39 |
| Tallahassee | 2.27 | -1.59 |
| Jacksonville | 0.85 | -1.49 |
| Orlando | 0.60 | -2.43 |
| Tampa | 2.82 | 1.20 |
| Miami | 2.97 | -0.46 |
| Key West | 6.63 | 3.99 |
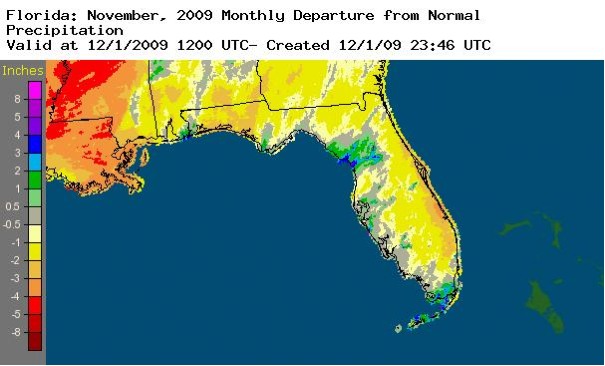
A graphical depiction of the monthly rainfall departure from normal for November is given in the figure below (courtesy of NOAA NWS). Departures range from over three inches above normal in the Keys and isolated locations in north central Florida to more than three inches below normal at some locations near the Atlantic coast.
El Niño continues in the Pacific Ocean. Sea surface temperatures in the equatorial Pacific Ocean continued to warm and remain above the 0.5 °C threshold designating El Niño conditions. Continuation of these above-normal sea surface temperatures during November and numerical model forecasts indicate El Niño will persist through the Northern Hemisphere winter.
Hazardous weather. After reaching Category 2 hurricane intensity in the Gulf of Mexico, Ida made landfall as a tropical storm just to the west of the Florida/Alabama border on November 10. Ida was the second latest hurricane to move through the Gulf of Mexico and affect North Florida. Although wind gusts greater than 40 miles per hour were observed at Pensacola on the 10th and storm total rainfall was greater than four inches at several places in northwest Florida, overall impacts of Ida were minimal.
Agricultural and other impacts. After a brief delay due to rainfall from Tropical Storm Ida, drier weather allowed the peanut harvest in the North to be near completion by the end of the month. Rainfall from Tropical Storm Ida improved pasture soil moisture in the Panhandle, but cooler temperatures slowed growth. Generally dry weather across the Peninsula allowed planting and some harvesting of vegetables in central and southern Florida.
Building A, Suite 292
Tallahassee, FL 32306-2741
Phone: (850) 644-3417 | (850) 644-0719
climate@coaps.fsu.edu