
|
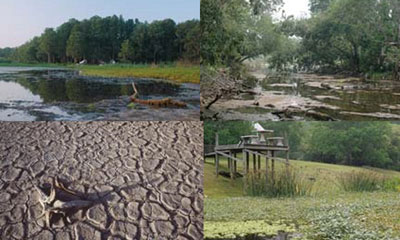
Images of drought in Florida. Courtesy of UF/IFAS. |
About Drought
For a state that receives about 58 inches of rain annually, a discussion of drought in Florida might appear to be of little relevance. But drought is a part of our climate, just like hurricanes, thunderstorms, wildfires, and tornadoes. Unlike the other hazards that affect the state, droughts can impact large areas and last for months, even years.
So, what is drought? Drought is a difficult concept to define. It's typically defined as a prolonged period when there is a precipitation deficit from normal values. But what's important in defining a drought are the duration of these below normal precipitation amounts and their impacts on the state. Drought can affect water supplies, agriculture, and fire danger levels and is measured on the basis of the severity of these impacts.
The National Drought Mitigation Center has extensive resources on the concepts of drought, how it's defined and the different types of drought.
Historic Drought
Because drought is defined on so many different levels, has differing impacts, and can happen on short or long time scales, it is hard to compare one drought to another. An examination of weather records since 1900 reveals that in every decade there has been at least one severe and widespread drought somewhere within Florida. Droughts that began in 1906, 1927, 1945, 1950, 1955, 1961, 1968, 1980, 1984, 1998, 2006, and 2011 were the most severe.
Drought Types
The term 'drought' has over 150 published definitions based on differences in regions, needs, and approaches. For the purposes of climate, we use the following definitions of drought:
- Meteorological: Based on the dryness (when compared to a normal or average amount) and the duration of the dry period. Region specific because climate can vary depending on geographic location, topography, etc.
- Hydrological: Associated with the effects of periods of below normal precipitation (snow and rainfall) on surface and ground water supples. Can be seen in low levels of in lakes and reservoirs, stream flow, and ground water wells. Takes longer periods of drought for these impacts to manifest, and extended periods of above normal precipitation to recover, depending on the severity of this type of drought.
- Agricultural: Links the characteristics of meteorological and hydrological drought to agricultural impacts. Focuses on precipitation and water supply shortages and how drought affects soil water deficits and evapotranspiration, as well as how susceptible crops are to drought during different stages of crop development, from planting to harvest.
- Socioeconomic: Associated with the supply and demand of some economic good (water, food, hydroelectric power) with elements of meteorological, hydrological, and agricultural drought. Occurs when the demand for an economic good far exceeds supply as a result of a weather-related shortfall in water supply.
Drought Indices
Just as there are many definitions and types of drought, there are many ways to interpret drought and drought conditions. A few of the common indices used are included here.
- Keetch Byran Drought Index (KBDI): The KBDI is a reference scale for estimating the dryness of soil. It's updated continuously and uses daily maximum temperature and precipitation as its inputs. It increases on non-precipitation days and typically decreases when rainfall is reported. The KBDI assumes there are 8 inches of saturated soil readily available to the vegetation. The scale ranges from 0 (no moisture deficit) to 800. Higher values are indicate favorable conditions for the spread and occurrence of wildfires.
- Lawn and Garden Index: The lawn-and-garden moisture index measures the capacity of the current soil moisture to sustain healthy lawns and gardens. The index uses a combination of recent and past (~21 days) precipitation to determine the contributions to the current level of soil moisture. This number is then used in conjunction with the difference of the total effective rainfall for the day, meaning we find out what level of moisture would be adequate for that time of year to maintain a healthy lawn/garden. The difference is what is displayed in the index.
- The Vegetation Drought Response Index: The VegDRI is a bi-weekly depiction of vegetation stress across the United States. VegDRI incorporates data taken by satellites with climate and biophysical data (soil types, land use, land cover, ecological settings) to determine the cause of vegetation stress.
- Palmer Drought Severity Index (PDSI): The PDSI attempts to measure the intensity and duration of long-term, drought-inducing circulation patterns. Long-term drought is cumulative, so the intensity of drought during the current month is dependent on the conditions and weather patterns from the previous months. The PDSI can respond quickly to rapid changes in patterns quickly.
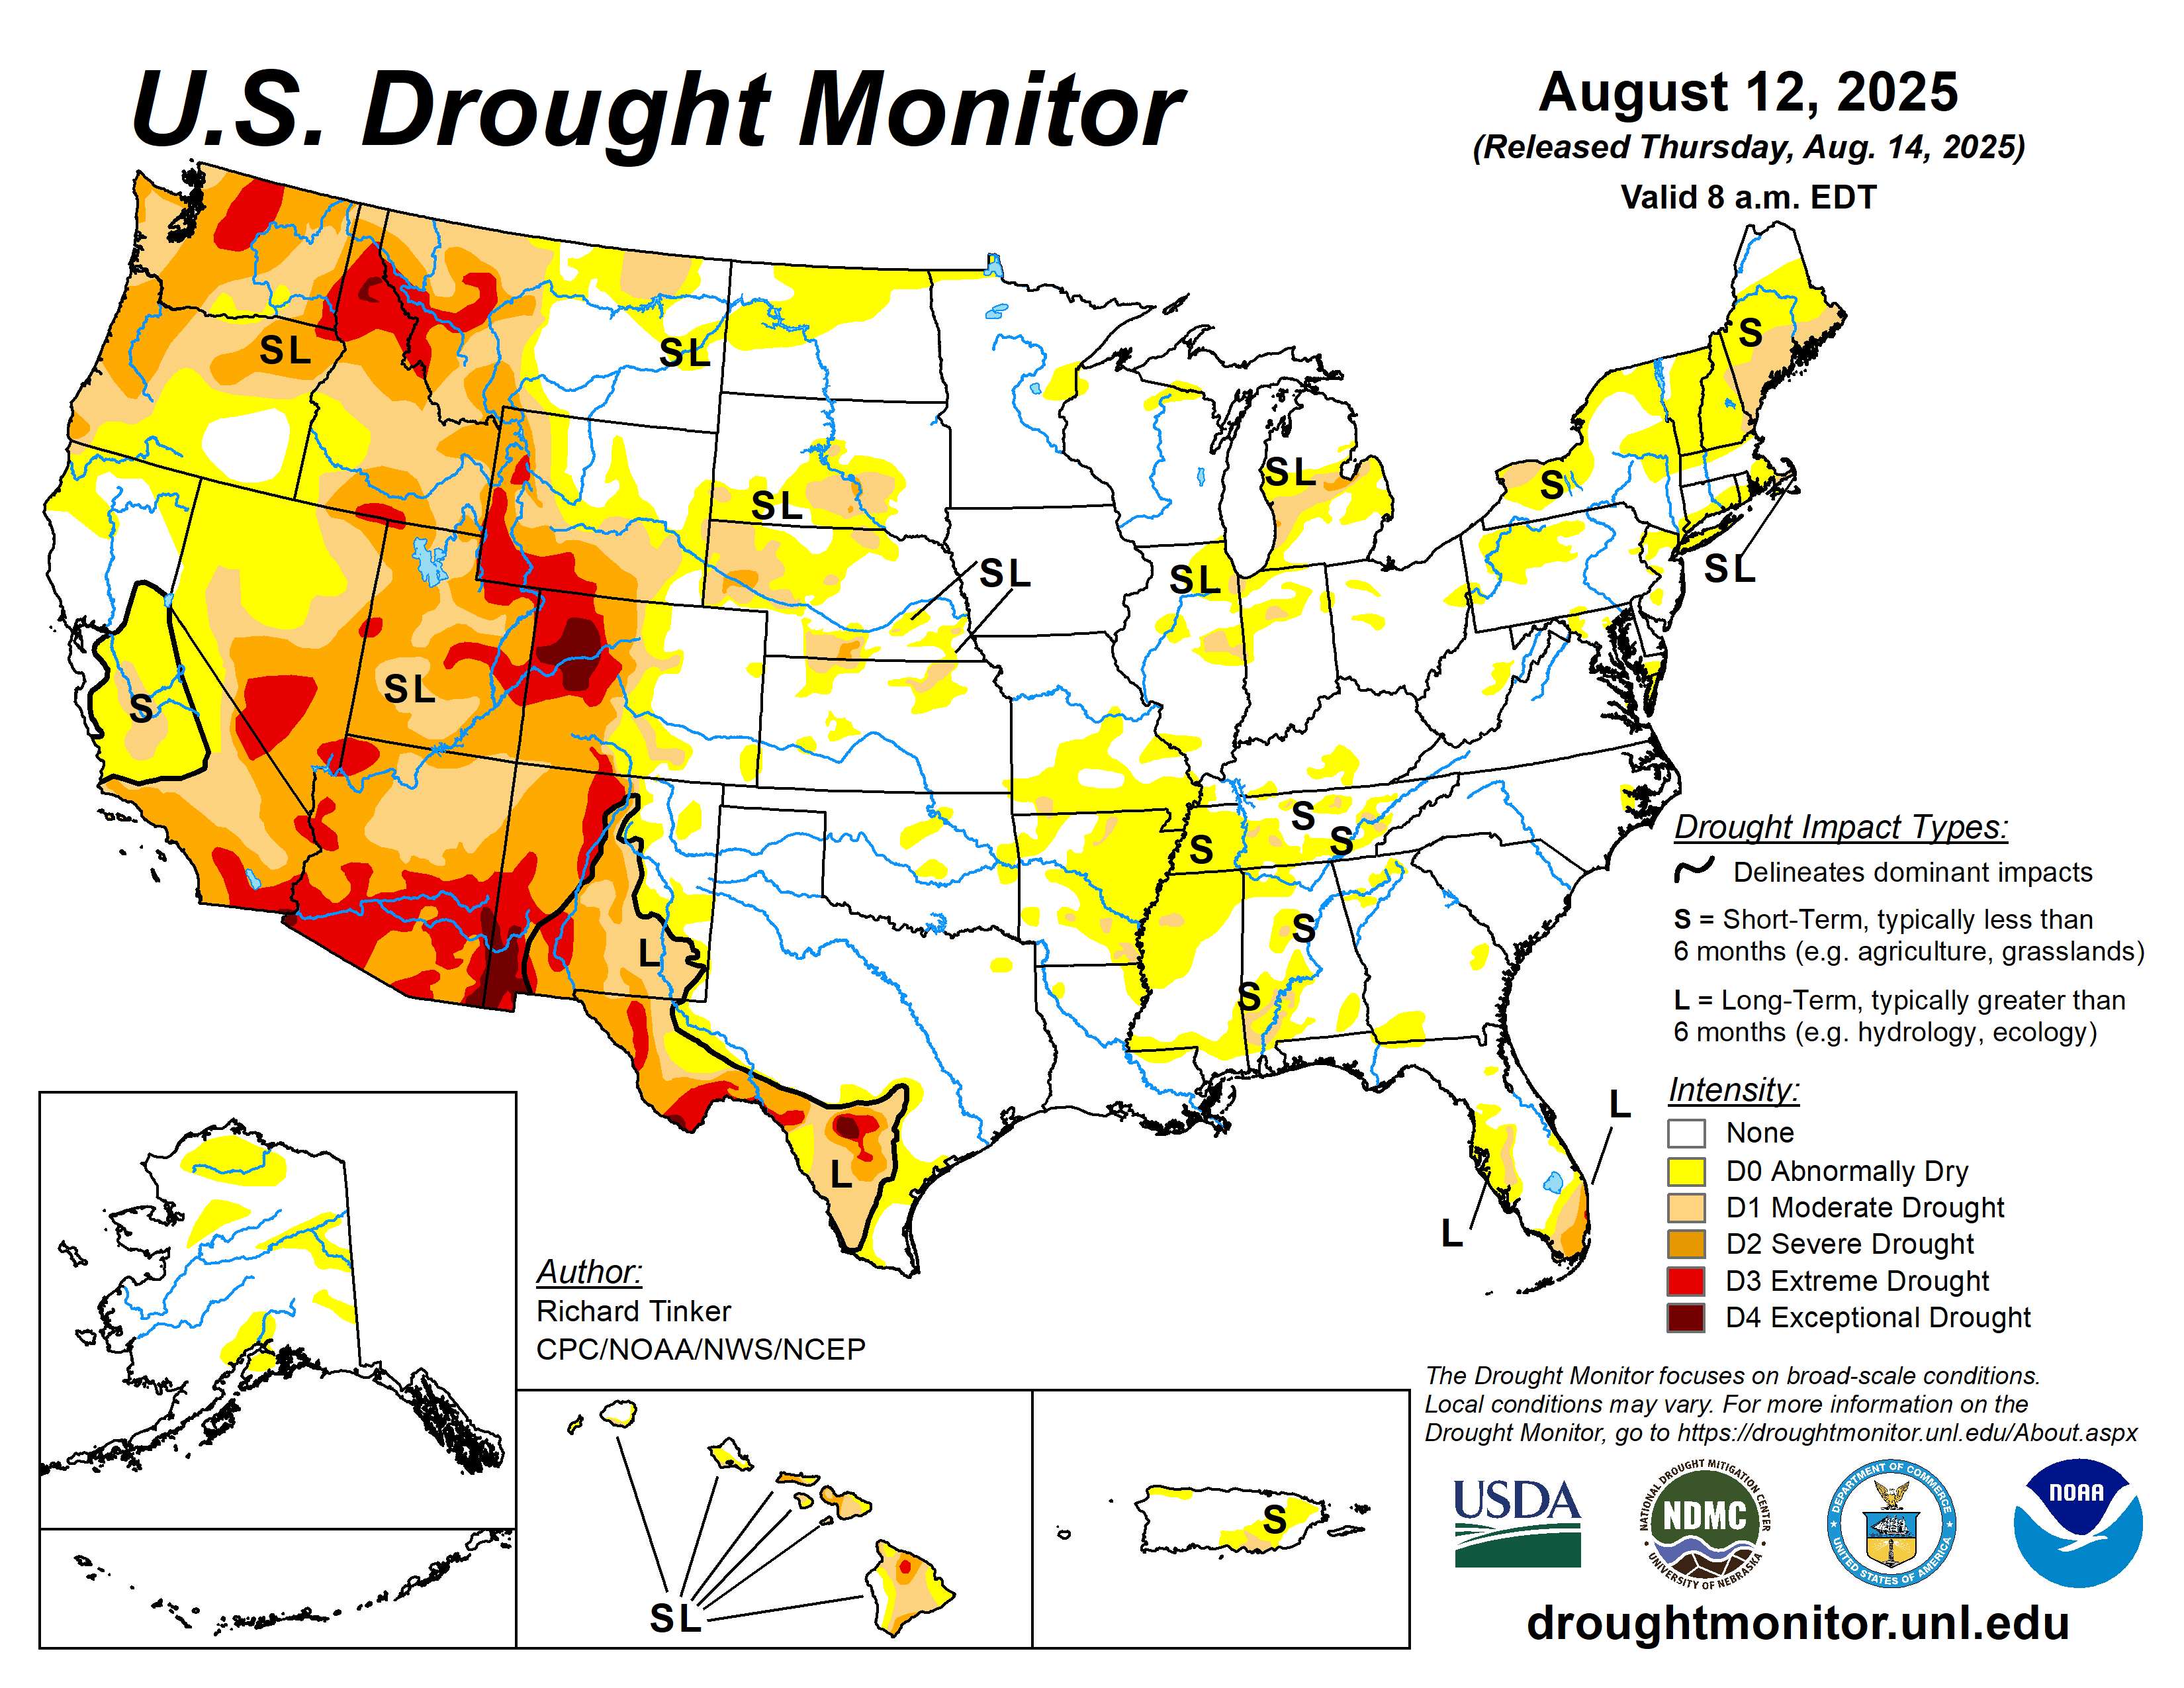
Current State of U.S. and Florida Drought
|
|
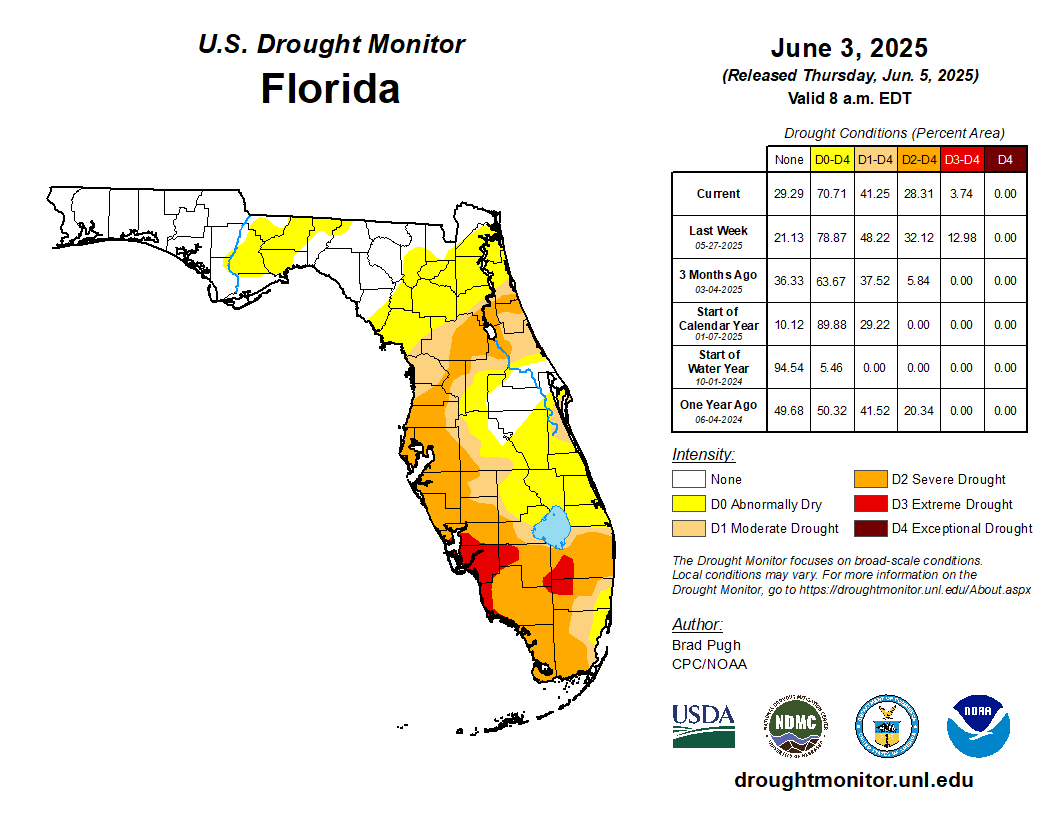
For more state drought information, view the latest Florida drought status infographic here, and visit the National Integrated Drought Information System (NIDIS) Florida drought page.