
- Global Climate Change
- Greenhouse Gases and Climate Change
- Climate Trends in Florida
- Climate Change Impacts in Florida and the Southeast U.S.
Global Climate Change
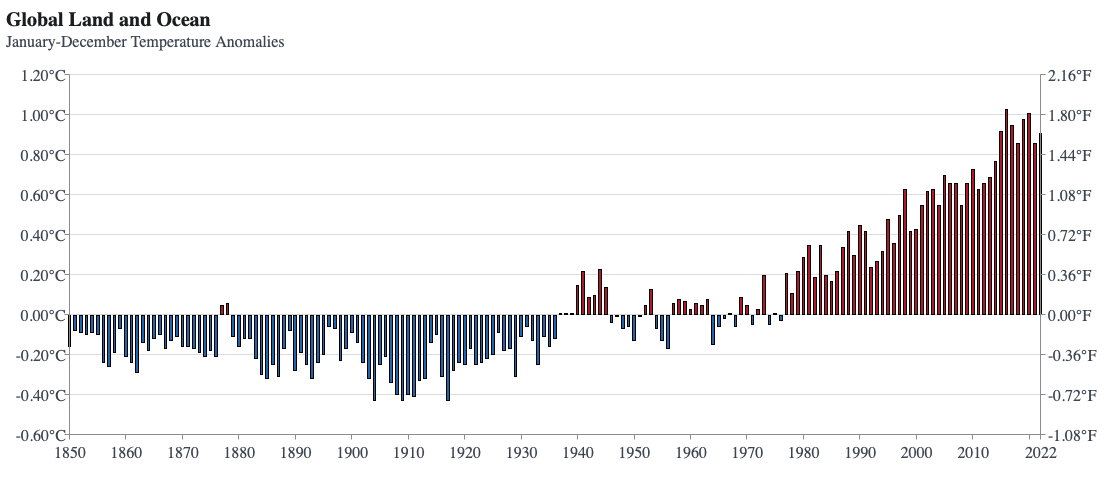
Human activities influence climate in many ways. Land use changes, such as irrigation of historically semi-arid areas for farmland, paving and development of sprawling urban areas, draining of wetlands, and emissions of greenhouse gases or aerosols into the atmosphere are all human activities that affect the Earth’s climate and hydrological systems. The increasing levels of greenhouse gases in the atmosphere, including carbon dioxide (CO2), methane (CH4), and nitrous oxides (NOx), contribute to a general warming of our planet (Figure 1).
Continued greenhouse gas emissions, as well as past emissions already added to the atmosphere, will continue to warm the land, ocean, and atmosphere and influence climate. A goal to limit warming to 2.0°C, and preferably to 1.5°C, above pre-industrial levels (1850-1900) has been established to avoid the worst impacts from a changing climate. According to a recent study led by NASA1, global mean temperatures are expected to reach the 2°C (3.6°F) threshold by the 2040s without significant action.
|
|
|
Figure 1. Global land and ocean temperature anomalies over the past 170 years. The zero line represents the long-term average temperature with respect to the long-term 20th century average. Source: National Oceanic and Atmospheric Administration (NOAA). *Click on graph to view larger image. |
Climate Change versus Global Warming
Climate change refers to the variation in the Earth's global or regional climates over time. It describes changes in the atmosphere over time scales ranging from weeks to decades to millions of years. These changes can be caused by natural processes internal to the Earth, such as continental drift which affects ocean currents, external forces, such as variations in sunlight intensity, or human activities, such as greenhouse gas emissions and land use change. Global warming refers to an increase in average global temperatures as influenced by increased greenhouse gas concentrations without regard to other factors that may cause climate to change.
Natural, long-term changes occur in response to fluctuations in the amount of solar energy reaching the Earth, changing ocean currents, formation or loss of ice sheets, and many other causes. Global climates also vary naturally in response to shorter-term events, such as volcanoes, which send sun-blocking particles into the stratosphere to cool the Earth, or the Pacific Ocean event known as the El Niño Southern Oscillation (ENSO), which affects global wind patterns, rainfall, temperatures, and other climate features thousands of miles away.
Greenhouse Gases and Climate Change
Much of the CO2 that we release to the atmosphere is a by-product of energy use, whether through burning fossil fuels for transportation, generation of electricity, or other purposes. Burning fossil fuels releases carbon dioxide into the atmosphere, increasing atmospheric carbon and altering the pre-existing balance of greenhouse gases.
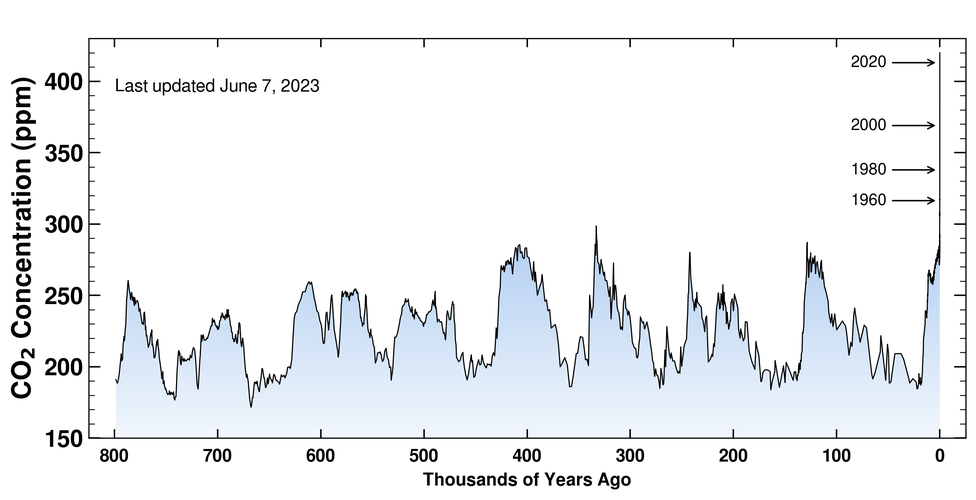
Greenhouse gases, including CO2 and CH4, have the property of allowing the atmosphere to retain more heat energy as their concentration in the atmosphere increases. Water vapor is the Earth’s most important greenhouse gas. Water vapor and clouds cause most of the Earth’s greenhouse effect, accounting for about 90% of the total heat-retaining capacity of the atmosphere. Two bases for the conclusion that human activity has contributed to recent trends in climate change are: 1) observations that atmospheric CO2 concentrations have increased from about 280 parts per million (ppm) to approximately 420 ppm over the past 172 years while global average temperatures have warmed about 1.40° C (or 2.5°F) above the 1850-1900 average, though the temperature vs. CO2 correlation is not perfect, and 2) scientific theories of atmospheric physics and heat transfer. This rise in global average temperature has tracked increases in CO2 emissions from burning fossil fuels, deforestation, and other sources, which supports the hypothesis formulated by physical scientist Guy Stewart Callendar in 1930 that CO2 emissions could enhance the greenhouse effect, as well as the work of other scientists dating back to the mid-1800s on the warming effect of greenhouse gases. Atmospheric greenhouse gases are at record high levels and are the highest they have been in at least 800,000 years (Figure 2).
 |
|
Figure 2. Global atmospheric carbon dioxide concentrations (in parts per million) over the past 800k years, from the Scripps Institution of Oceanography at UC San Diego. Data since 1958 are from the Mauna Loa record from the Scripps CO2 program; data prior to 1958 are from ice core records.2 |
Climate Trends in Florida
Temperature Trends:
- The long-term trend since 1895 in Florida’s average annual temperature is an increase of approximately 1.6°F, which is roughly equal to the average long-term global trend since 1895. However, the trend in the statewide annual average temperature has accelerated in more recent decades. Since 1950, Florida's average annual temperature trend is an increase of 3.5°F, which exceeds the global trend of +2.7°F since 1950.
- The rate of temperature rise has increased further over the past few decades and especially since 2000.
- There is considerable year-to-year and decade-to-decade variability in the instrumental record. However, long-term warming has been observed in every season, with the largest increases observed in winter (DJF).
- Daytime and nighttime temperatures are rising in Florida, and while nighttime temperatures have been rising faster than daytime temperatures, daytime temperatures are catching up.
- Extreme heat days, defined as days at or above 95°F, are projected to rise in Florida. Under a 2°C (3.6°F) level of global warming, eastern coastal Florida is expected to see up to 30 more extreme heat days per year, on average, compared to normal (1991-2020). Locations right along the coast could see 10-20 more extreme heat days per year. The Panhandle is expected to experience roughly 30-40 more extreme heat days per year. The areas of Florida expected to see the greatest increase in extreme heat are inland portions of the Peninsula, with 40+ more extreme heat days per year by 2050 under a high emissions scenario.3 Figure 3 shows the expected change in the number of days over 95°F at the county level under a 2°C (3.6°F) level of global warming (a) and 3°C (5.4°F) level of global warming (b).
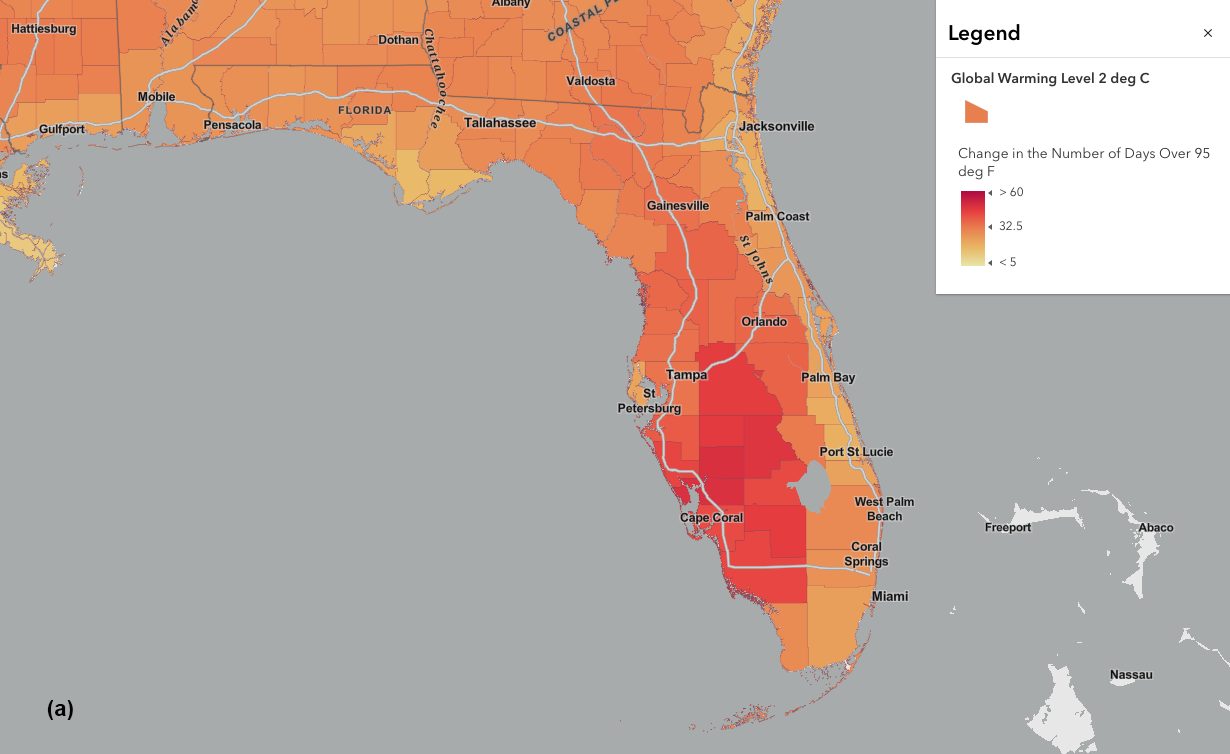
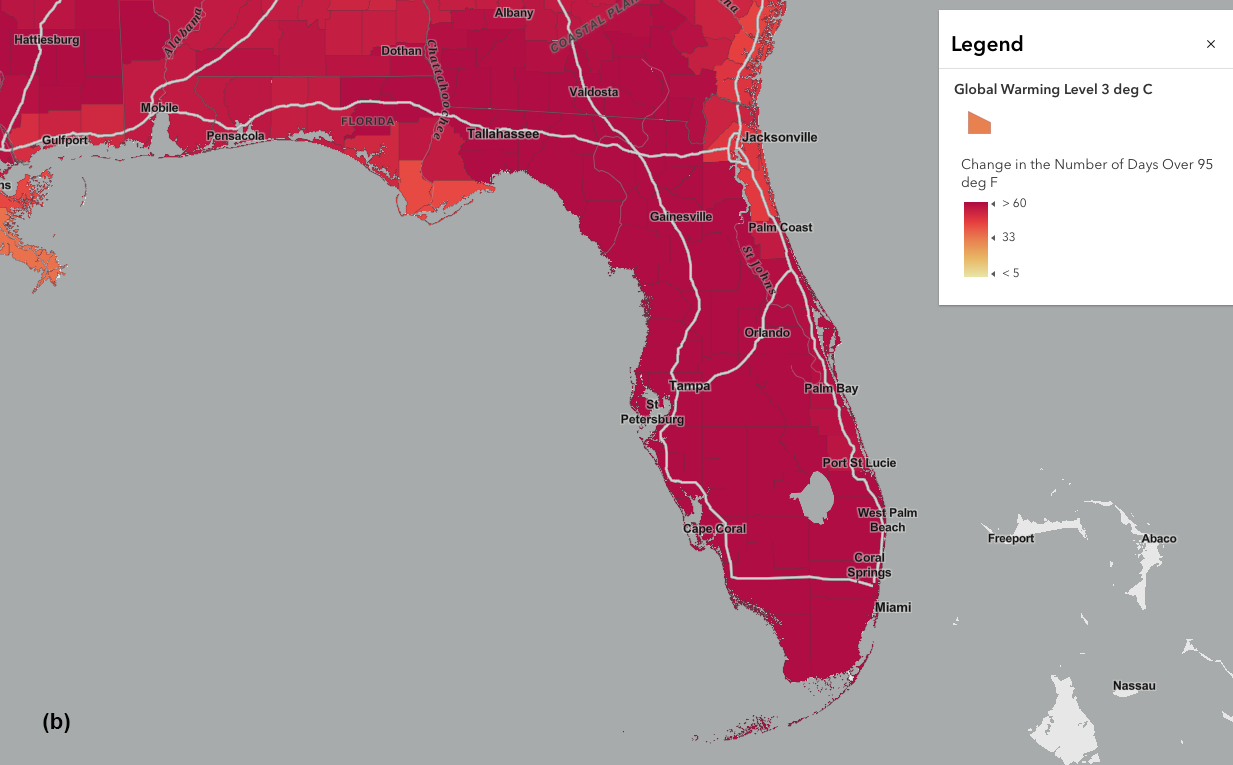
Figure 3. The change in the number of days over 95°F under a 2°C (3.6°F) level of global warming (a) and a 3°C (5.4°F) level of global warming (b) above pre-industrial levels measured from 1851 to 1900, based on the high SSP5-8.5 scenario. As of 2020, the global average temperature has increased by about 2°F above pre-industrial levels. (Source: Fifth National Climate Assessment/US Global Change Research Program) *Click on graphs to view larger images.
Precipitation Trends:
- Florida’s precipitation varies considerably from year to year and on a decadal basis.
- Compared to the first half of the last century, average annual precipitation has not changed by much across the state. Winter precipitation has increased in the Panhandle, North Florida, and South Florida. Summer precipitation has increased across the Peninsula but decreased in the central Panhandle.4
- Extreme precipitation events are expected to become more frequent and intense in a warmer world. Recent heavy rainfall events, such as the extreme rainfall event in Fort Lauderdale on April 12, 2023 and recent hurricanes (Idalia, Ian, Nicole), are consistent with expected increases in precipitation, tropical cyclone intensity, and coastal storm surge flooding in a warmer world with higher evaporation rates and atmospheric moisture (Figure 4).
- Average annual precipitation is projected to increase in North Florida and decrease in South Florida, with higher confidence in changes for North Florida (Figure 5).
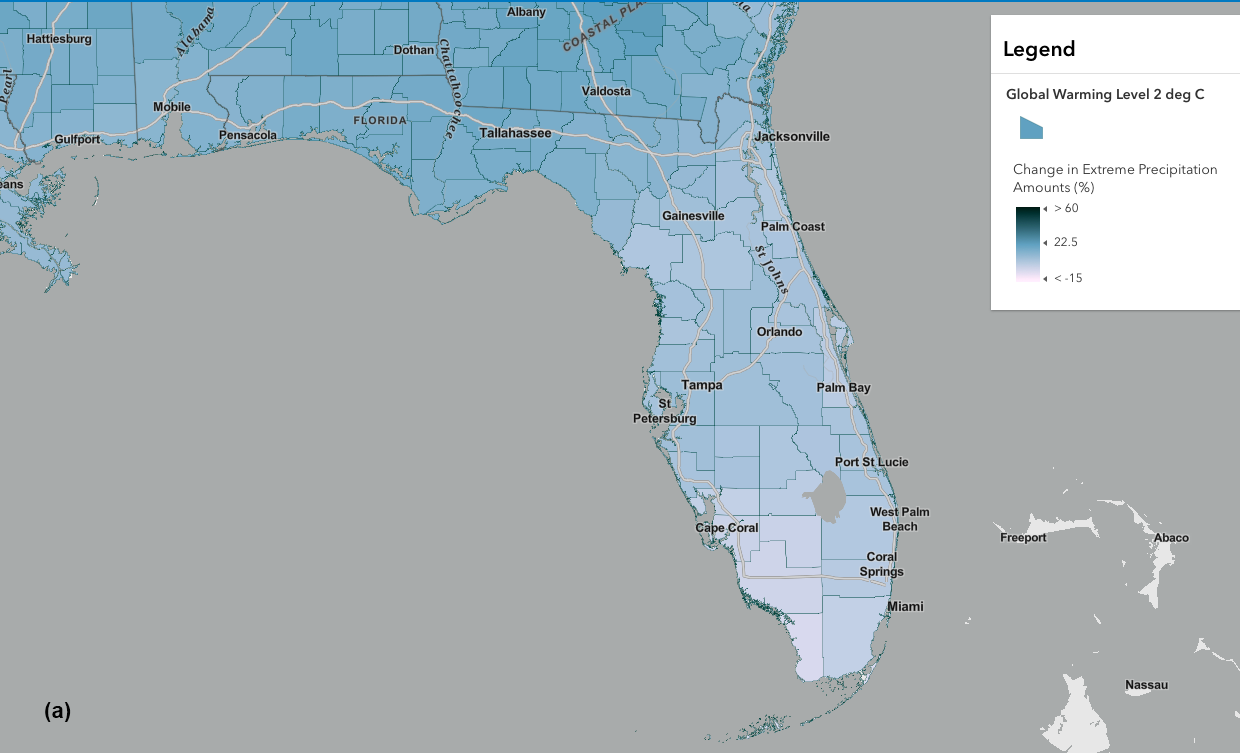
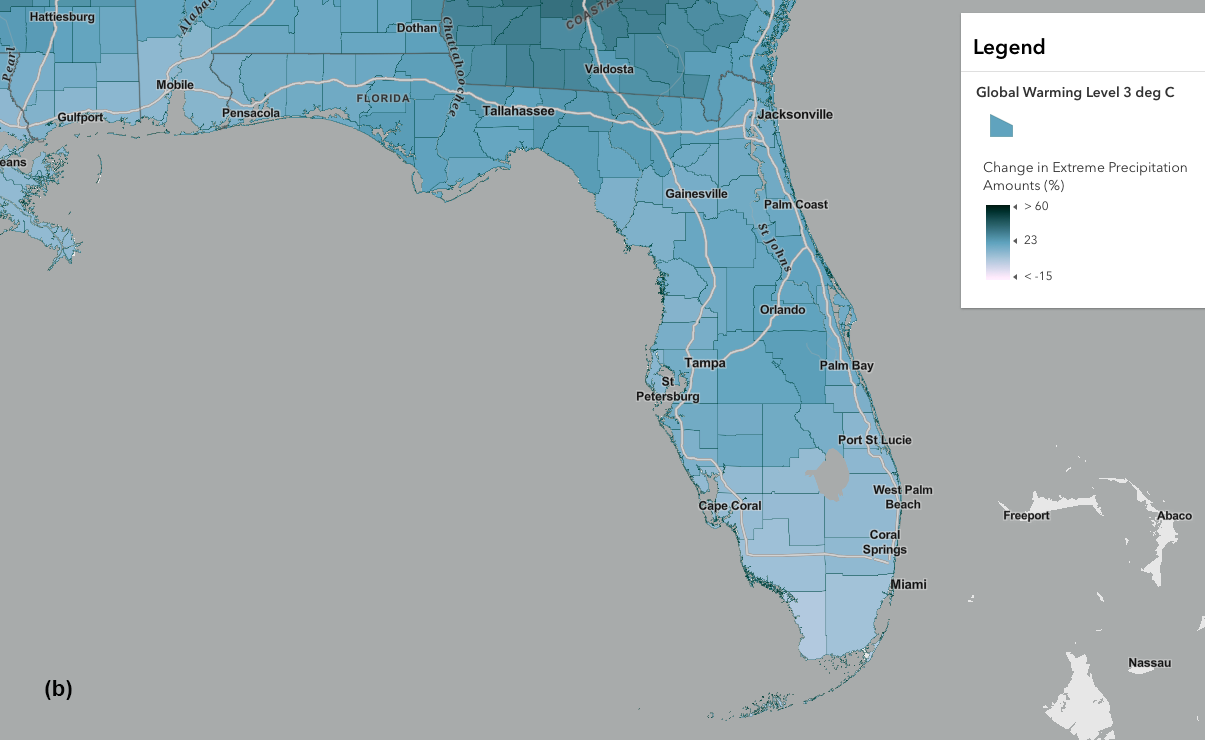
Figure 4. Change in extreme precipitation under a 2°C (3.6°F) level of global warming (a) and a 3°C (5.4°F) level of global warming (b) above pre-industrial levels measured from 1851 to 1900, based on the high SSP5-8.5 scenario. Extreme precipitation is defined as the total precipitation over a year that arrives on days when the daily total is in the top 1% of historical amounts. (Source: Fifth National Climate Assessment/US Global Change Research Program)
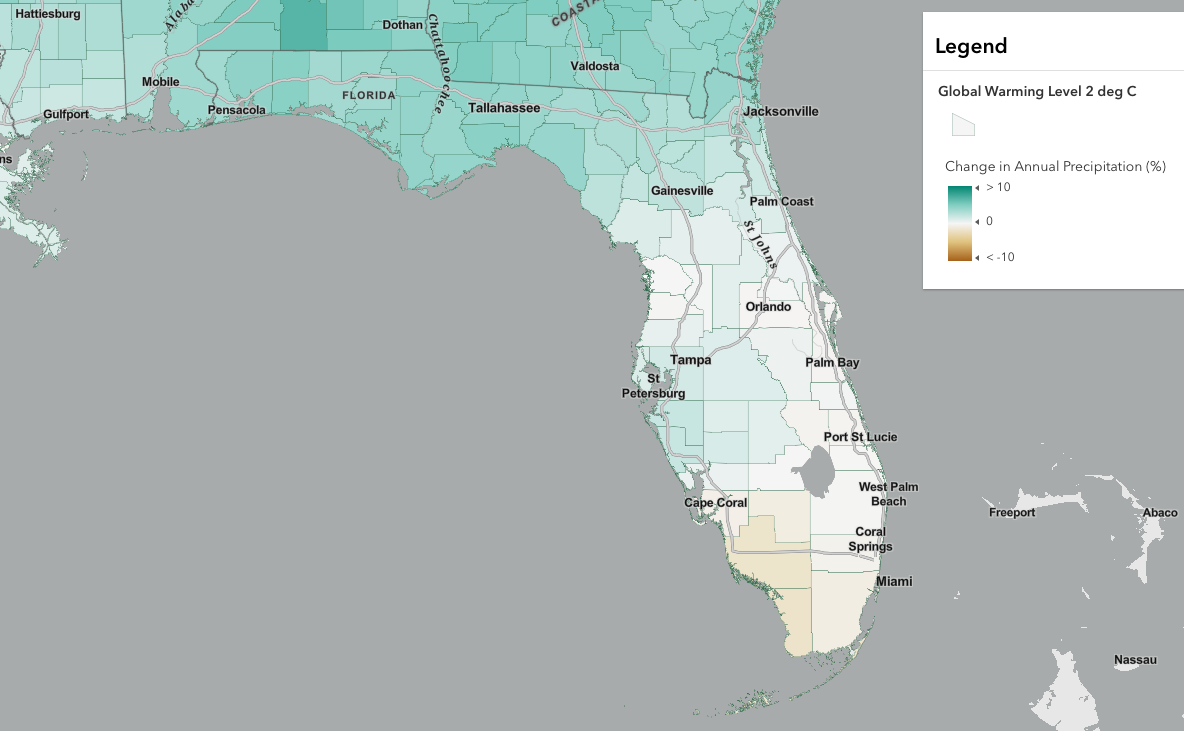
Figure 5. Change in total annual precipitation projected under a 2°C (3.6°F) level of global warming above pre-industrial levels measured from 1851 to 1900, based on the high SSP5-8.5 scenario. (Source: Fifth National Climate Assessment/US Global Change Research Program)
Climate Change and Hurricanes
Of particular importance to Florida and the Southeast is how climate change will influence tropical cyclone activity and associated hazards. With continued warming of the land and ocean, hurricanes are expected to increase in intensity and reach major category strength (Category 3 or higher) when they occur. In addition, more storms are undergoing rapid intensification, and hazards associated with tropical cyclones are expected to worsen, including from coastal storm surge inundation, rainfall flooding, and high winds.
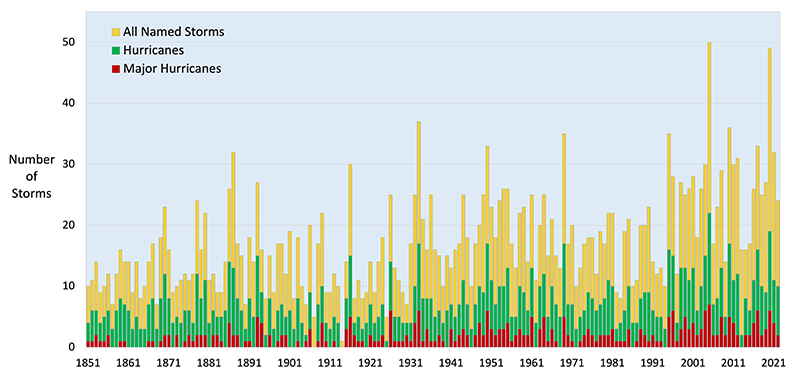
Changes in tropical storm/hurricane frequency over the historical record is at least partially explained by better detection of storms in the post-satellite era. Figure 6 shows the annual numbers of Atlantic basin tropical storms and hurricanes since 1855. Several periods of increased activity can be seen in the late 1800’s, the 1930’s, the 1950’s, and since about 1995. Relatively inactive periods occurred around 1920, 1970, and 1985. There is a general trend of increasing activity over the whole period, but whether or how much of that is real or just an artifact of poor detection of storms before aircraft reconnaissance or satellites is a subject of intense research as scientists actively work to improve the historical record during the pre-satellite era. Read our Hurricanes page for more information about the current state of science on climate change and tropical cyclones.
|
|
|
Figure 6. Numbers of hurricanes and tropical storms for the Atlantic Basin from 1850 to 2022. Source: National Hurricane Center, NOAA. |
Climate Change Impacts in Florida and the Southeast U.S.
As the average temperature rises, the likelihood of experiencing more frequent and intense extreme heat will also increase. Florida has seen a remarkable warming trend over the past decade, and July and August of 2023 each set a new all-time monthly temperature record for Florida (at 84.1°F and 84.9°F, respectively). Warming ocean temperatures are expected to lead to more marine heatwaves, which in Florida can further contribute to extreme heatwaves felt on land. Marine heatwaves can have devastating impacts to marine life like coral reefs.
Another impact of increasing global temperatures is sea level rise. Relative sea levels rose by about 6 inches during the 1970-2020 period, though sea level rise has varied across the Southeast U.S. Regional projections of sea level rise for the Southeast U.S. average 16-23 inches by 2050, relative to 2000 based on low to high scenarios. By 2100, these estimates increase to 2.2-7.3 feet relative to 2000. These projections are higher than the projected global average rise in sea levels. Sea level rise will increase high tide flooding events and saltwater intrusion, which already impacts coastal forests and estuaries, contaminates drinking water supplies, exacerbates flooding impacts, and has led to more frequent harmful algal blooms in Florida. See our Sea Level Rise page for more information.
The impacts of a changing climate will also be driven by demographic and land use changes happening in the state and elsewhere. Florida has one of the fastest growing populations in the country and its population is expected to continue to rise. Population growth, along with continued development, will expose more people, communities, and assets to extreme weather and climate, increasing the state’s overall risk to climate variability and extreme weather events. Increased exposure to extreme events like heat and flooding will result in short- and long-term impacts and lead to adverse public health outcomes, such as heat-related illness and mortality, especially among more vulnerable populations.
While the climate of Florida and the Southeast U.S. is already changing and will continue to change over the coming decades, the extent of change and severity of impacts will depend in part on actions taken today. Communities are preparing by investing in sustainability solutions, identifying vulnerable sectors of society, scaling up adaptation strategies to mitigate risks, and planning with an eye toward the future.
More Resources
-
Fifth National Climate Assessment (full report)
-
Climate Change Basics for the Southeast USA (from AgroClimate)
References
1. Park, T., Hashimoto, H., Wang, W., Thrasher, B., Michaelis, A. R., Lee, T., et al. (2023). What does global land climate look like at 2°C warming? Earth's Future, 11, e2022EF003330. https://doi.org/10.1029/2022EF003330.
2. Lüthi, D., M. Le Floch, B. Bereiter, T. Blunier, J.-M. Barnola, U. Siegenthaler, D. Raynaud, J. Jouzel, H. Fischer, K. Kawamura, and T.F. Stocker. (2008.) High-resolution carbon dioxide concentration record 650,000-800,000 years before present. Nature, Vol. 453, pp. 379-382, 15 May 2008.
3. Hoffman, J.S., S.G. McNulty, C. Brown, K.D. Dello, P.N. Knox, A. Lascurain, C. Mickalonis, G.T. Mitchum, L. Rivers III, M. Schaefer, G.P. Smith, J.S. Camp, and K.M. Wood. (2023.) Ch. 22. Southeast. In: Fifth National Climate Assessment. Crimmins, A.R., C.W. Avery, D.R. Easterling, K.E. Kunkel, B.C. Stewart, and T.K. Maycock, Eds. U.S. Global Change Research Program, Washington, DC, USA. https://doi.org/10.7930/NCA5.2023.CH22.
4. Marvel, K., W. Su, R. Delgado, S. Aarons, A. Chatterjee, M.E. Garcia, Z. Hausfather, K. Hayhoe, D.A. Hence, E.B. Jewett, A. Robel, D. Singh, A. Tripati, and R.S. Vose, 2023: Ch. 2. Climate trends. In: Fifth National Climate Assessment. Crimmins, A.R., C.W. Avery, D.R. Easterling, K.E. Kunkel, B.C. Stewart, and T.K. Maycock, Eds. U.S. Global Change Research Program, Washington, DC, USA. https://doi.org/10.7930/NCA5.2023.CH2.