
|
|
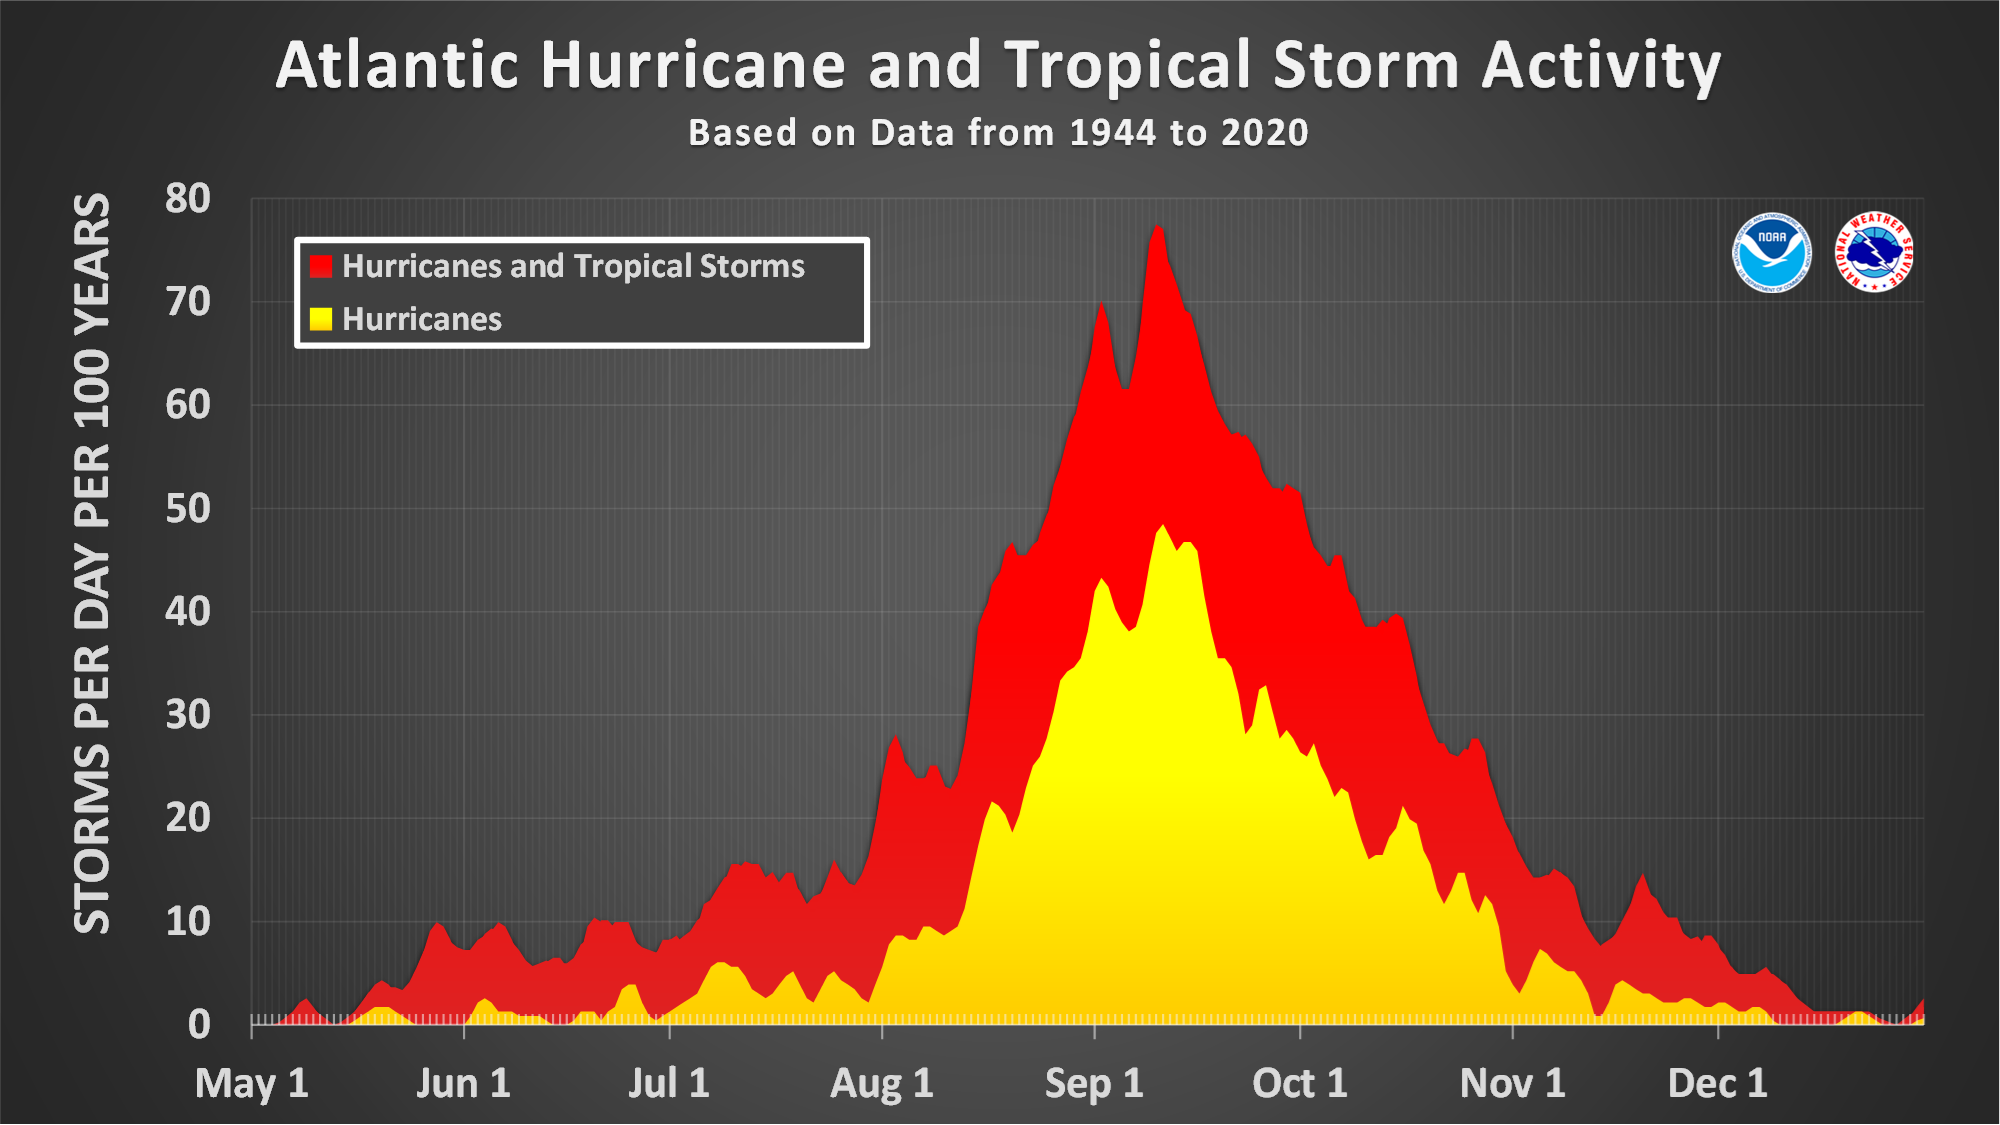
The threat of hurricanes is very real for Florida during the six-month long Atlantic hurricane season, which runs from June 1 until November 30. The peak of hurricane season occurs between mid-August and late October, when the waters in the equatorial Atlantic and Gulf of Mexico have warmed enough to help support the development of tropical waves.
A common misconception in Florida is that there are parts of the state that do not get hurricanes. Since 1850, all of Florida’s coastline has been impacted by at least one hurricane. With its long coastline and location, Florida frequently finds itself in the path of these intense storms. The southeast coastline is extremely susceptible to a land-falling hurricane, followed by the panhandle. Areas around Tampa, Jacksonville and the Big Bend do not have as high of a risk of a direct strike from a hurricane but are still susceptible to a landfall each year. Even if the hurricane makes landfall elsewhere in the state, the impacts can be felt hundreds of miles away.
Tropical Depression - A tropical cyclone in which the maximum 1-minute sustained surface wind is 33 knots (38 mph) or less.
Tropical Storm - A tropical cyclone in which the maximum 1-minute sustained surface wind ranges from 34 to 63 knots (39 to 73 mph).
Hurricane - A tropical cyclone in the Atlantic, Caribbean Sea, Gulf of Mexico, or eastern Pacific in which the maximum 1-minute sustained surface wind is 64 knots (74 mph) or greater.
Major Hurricane - A hurricane which reaches Category 3 (sustained winds greater than 110 mph) on the Saffir/Simpson Hurricane Scale.
Saffir-Simpson Scale
The Saffir-Simpson Hurricane Scale, originally developed by Herb Saffir (wind engineer) and Bob Simpson (meteorologist), was used to categorize a hurricane based on its intensity at an indicated time. The scale classified the storm on a scale of one to five based on wind velocity, central pressure and height of storm surge.
Recent hurricanes brought to light some of the issues with trying to categorize hurricanes by so many different factors. Central pressure was not routinely measured from hurricanes prior to 1990. Hurricane size (the diameter of the entire storms), along with the extent of tropical storm force and hurricane force winds, local bathymetry, and forward motion were also not taken into account with the original Saffir-Simpson scale. To help reduce the confusion of the scale, the National Hurricane Center adapted a newer version of Saffir-Simpson Hurricane Scale in 2010, known as the Saffir-Simpson Hurricane Wind Scale, in which only the peak winds are now used to categorize a hurricane.
| SAFFIR-SIMPSON HURRICANE WIND SCALE | ||
| Very dangerous winds will produce some damage. | ||
| Extremely dangerous winds will cause extensive damage. | ||
| Devastating damage will occur. | ||
| Catastrophic damage will occur. | ||
| Catastrophic damage will occur. | ||
*Adapted from data from the National Hurricane Center’s Saffir-Simpson Hurricane Wind Scale: http://www.nhc.noaa.gov/pdf/sshws_table.pdf.
Impacts
Winds are the most well-known impact from tropical storms and hurricanes. The highest winds occur just outside of the eye (or center) in a region known as the eye-wall. Hurricane force winds can easily damage or destroy mobile homes and other non-permanent structures, often moving them well away from their foundations. Roofs, trees and power lines are also frequently damaged by hurricane force winds. Because of Florida’s flat terrain, strong winds do not rapidly weaken after the storm makes landfall. Hurricane Charley in 2004 moved through the state at 25 mph (nearly twice the typical speed of a landfalling hurricane) and brought hurricane-force winds to Orlando, which was nearly 100 miles away from the point of landfall. The strongest hurricanes can have winds in excess of 155 mph.
Storm surge is the term used to describe the wall of water that is pushed toward the shoreline as a hurricane moves onshore. Storm surge combines with the local tide and the battering wind-driven waves to push a large volume of water onto the shore, often resulting in significant damage. In the strongest hurricanes, this storm surge can be as high as 25 feet above normal water levels. The combination of the rising water and pounding waves is often deadly. Approximately 90% of all deaths in hurricanes worldwide are caused by drowning in either the storm surges or flooding caused by intense rainfall. Those living in coastal and near-coastal communities should know if or in which evacuation zone they reside, as well as the elevation of their property.
Florida Evacuation Zone Information: https://www.floridadisaster.org/knowyourzone/
If local officials declare an evacuation for your area, move to the nearest evacuation destination outside of the declared zone. You may choose to stay with friends/relatives, at a hotel/motel or at an evacuation shelter.
Florida Evacuation Shelter Information: http://floridadisaster.org/shelters/
Flooding from tropical cyclones is not correlated with the intensity of the system but instead with the relative speed of the storm. Slow-moving tropical storms and hurricanes often produce large amounts of rain, which can lead to significant flooding at inland locations. Flooding impacts can occur hundreds of miles away from the center of a storm or from the remnants of a former tropical system.
Flooding from torrential rains can produce a lot of damage. Hurricane Easy in September 1950 dumped an estimated 38.70” of rain on Yankeetown, FL, in a 24-hour period. This amount cannot be counted as an official observation since it was estimated, so the official 24-hour state record rainfall amount (23.38”) came from the outer bands of Hurricane Jeanne in 1980.
Tornadoes associated with tropical systems typically form in the right front quadrant of the storm, relative to the direction of forward motion. If you were looking at the storm like it was a clock, this would be the area from about noon to three o’clock in the direction the storm is moving. While not normally as intense as tornadoes produced by non-tropical severe thunderstorms, these tornadoes often move very fast, at speeds over 50 mph. Another common area of tornadoes in a hurricane is in the far outer rain bands, which can be hundreds of miles away from the center of the storm.
Preparing for a Hurricane
There are a variety of lists to help you prepare for the upcoming hurricane season. The Florida Department of Emergency Management has come up with an interactive website to help you tailor these lists to your own household or business needs. Please take the time to go through the tool and make sure you’re prepared.
Create a Hurricane Plan for:
Your Family: https://www.floridadisaster.org/family-plan/
Your Business: https://www.floridadisaster.org/business/
| SOME NOTABLE HURRICANES IN FLORIDA'S HISTORY | |||
| Storm | Date | Category (at time of impact) | Landfall |
| Great Miami Hurricane | 1926 | 4 | South Miami |
| Lake Okeechobee Hurricane | 1928 | 4 | Jupiter |
| Labor Day Hurricane | 1935 | 5 | Craig Key |
| Unnamed | September 1947 | 4 | Pompano Beach |
| Unnamed | August 1949 | 4 | Palm Beach Shores |
| Hurricane Easy | September 1950 | 3 | Cedar Key |
| Donna | 1960 | 4 | Naples |
| Betsy | 1965 | 3 | Florida Keys |
| Eloise | 1975 | 3 | Bay County |
| Andrew | 1992 | 5 | Homestead |
| Opal | 1995 | 3 | Pensacola Beach |
| Charley | 2004 | 4 | Punta Gorda |
| Ivan | 2004 | 3 | Gulf Shores, AL |
| Jeanne | 2004 | 3 | Hutchinson Island |
| Dennis | 2005 | 3 | Santa Rosa Island |
| Wilma | 2005 | 3 | Cape Romano |
| Hermine | September 2016 | 1 | Alligator Point |
| Irma | September 2017 | 4 | Cudjoe Key |
| Michael | October 2018 | 5 | Mexico Beach, Tyndall Air Force Base |
| Sally | September 2020 | 2 | Gulf Shores, AL |
| Ian | September 2022 | 4 | Cayo Costa, FL |
| Nicole | November 2022 | 1 | near Vero Beach, FL |
| Idalia | August 2023 | 3 | Keaton Beach, FL |
| Helene | September 2024 | 4 | near Perry, FL |
| Milton | October 2024 | 3 | Siesta Key, FL |