


The Florida Climate Center serves as the primary resource for climate data, information, and services in the state of Florida.

The Florida Climate Center achieves its mission by providing climate monitoring, research, and expertise to be applied by the people, institutions, and businesses of Florida and the surrounding region.
We provide direct service by fulfilling requests for climate and weather data and information in a variety of formats.
We perform research that advances the understanding of the climate variability and changes of Florida and the surrounding region.
We provide outreach in presentations and at events aimed at a variety of groups, interests, and ages.
Prepared by Lydia Stefanova, Daniel J. Brouillette, and David F. Zierden.
Florida Climate Center
The Florida State University
Tallahassee, FL

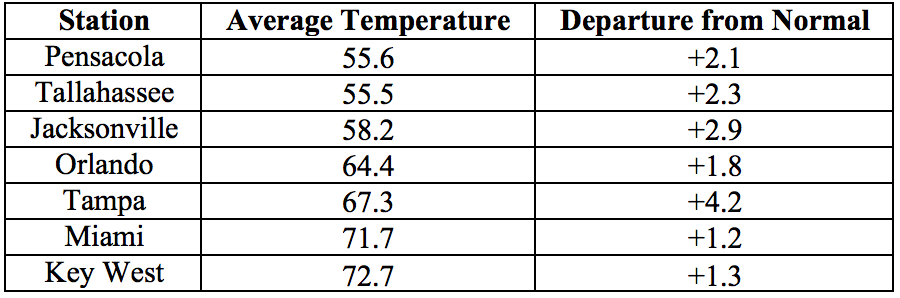
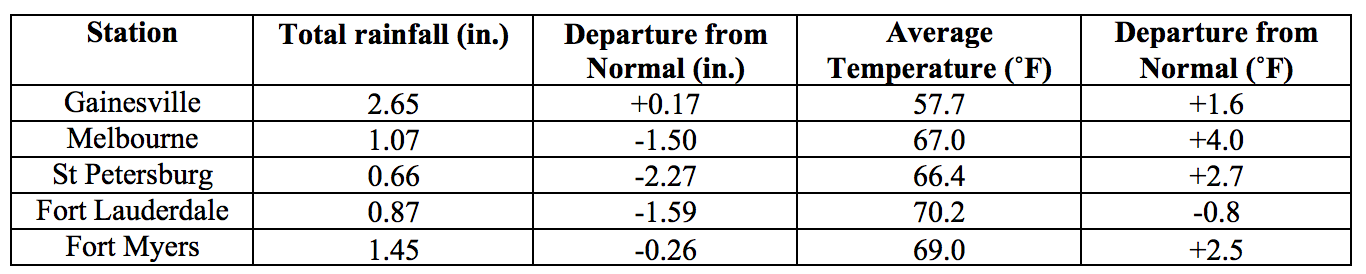
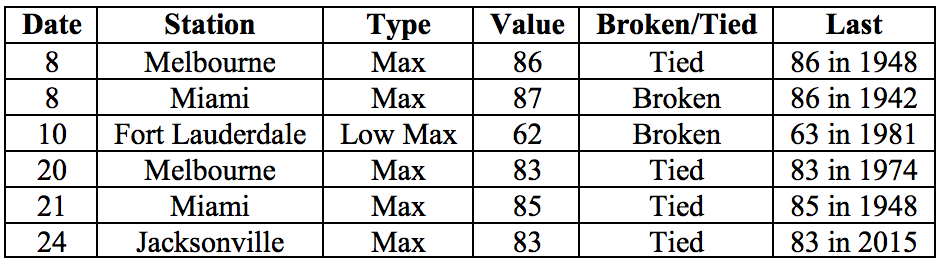
Average temperatures in December were generally above normal across the state. The departures from average temperatures in December 2017 were above normal across the entire state, ranging from -0.8˚F in Fort Lauderdale to +4.2˚F in Tampa (Table 1 and Appendix 1). Below-freezing temperatures were reported on one or more nights at most stations in the panhandle as well as some interior locations in the northern part of the peninsula. A handful of daily temperature records were tied or broken across the state (Appendix 2). Amongst stations with records going back over 100 years, 2017 was the warmest year on record in Pensacola (138 years in record), Tampa (127 years in record), and Ocala (111 years in record). It was the 2nd warmest for Miami (117 years in record), 3rd warmest year on record for Key West (143 years in record), Fort Myers (114 years in record), 5th for West Palm Beach (117 years in record), 6th warmest for Jacksonville (146 years in record), and 7th for Tallahassee (115 years in record).
Table 1: December average temperatures and departures from normal (˚F) for selected cities.
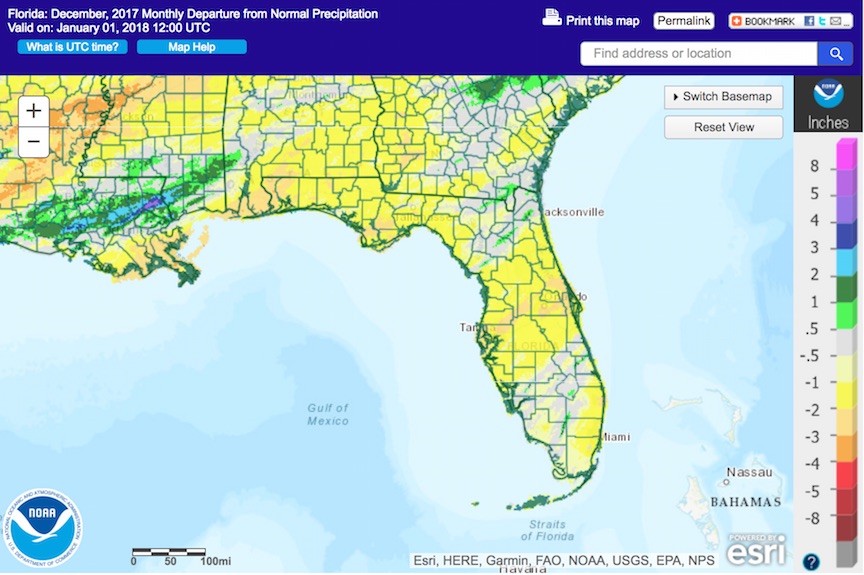
Rainfall totals in December were generally below normal across the state. Rainfall totals in December 2017 were below everywhere in most of the state (Figure 1). Departures from normal roughly ranged from -2.27” in St. Petersburg to +0.17” in Gainesville (Table 2 and Appendix 1), though localized parts of the state saw rainfall totals that were as much as 3.00” below normal to 2.00” above normal (Figure 1). One 24-hour precipitation record was broken for the month (Table 3). Amongst stations with records going back over 100 years, 2017 was the 2nd wettest year on record for Pensacola, and 5th wettest for Jacksonville and Miami.
Table 2: December precipitation totals and departures from normal (inches) for select cities.
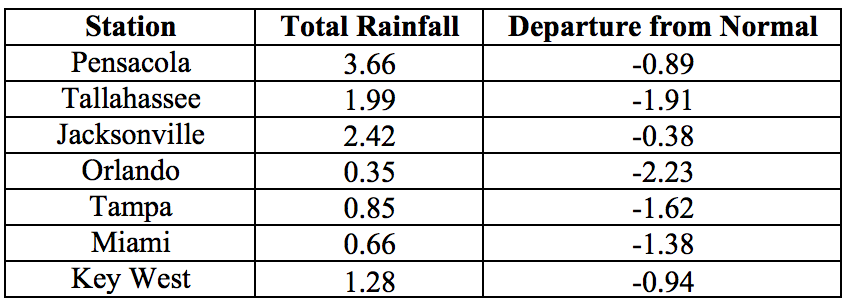
Table 3: Select daily rainfall records (inches) broken during December. (Compiled from NOAA, NWS).
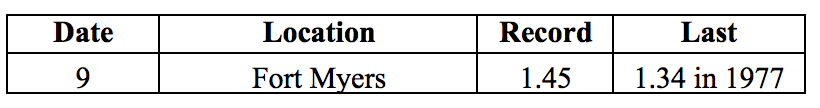
Figure 1: A graphical depiction of the monthly rainfall departure from normal (inches) for December is given in the figure below (courtesy of NOAA, NWS)
La Niña Conditions are Present in the Pacific.
Based on current data and forecast models, the Climate Prediction Center (CPC) the ENSO alert system status is set to La Niña Advisory. La Niña conditions are currently present, with below normal sea surface temperatures across the central and eastern equatorial Pacific Ocean. Forecast models predict that La Niña conditions will continue through the winter, with a transition to ENSO-neutral likely during mid- to late spring 2018. Taking into account the ENSO forecast and long-term trends, the CPC seasonal outlook favors above-normal temperatures and below-normal precipitation for Florida through March 2018.
Hazardous Weather Events in December.
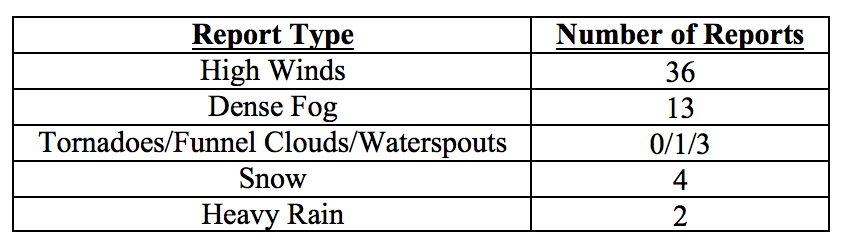
December 2017 was a relatively quiet month for Florida, with 59 hazardous weather events recorded throughout the state. Over two-thirds of the hazardous weather reports for December were made on the 9th of the month and associated with a cold front passage. On that date, strong winds were reported across the central and south portions of the state, with gusts up to 58mph seen in Collier County; a few instances of light snow were reported in the panhandle, and ice over a bridge in Escambia County led to a fatal crash. Multiple instances of hazardous driving conditions due to dense fog were reported on the 22nd and 29th of the month in the southern portion of the state, with reduced visibility ranging from less than one quarter mile to just a few feet.
Table 4: Breakdown of storm reports submitted in Florida during the month of December (Compiled from Iowa State University/Iowa Environmental Mesonet.)
Drought-Related Impacts.
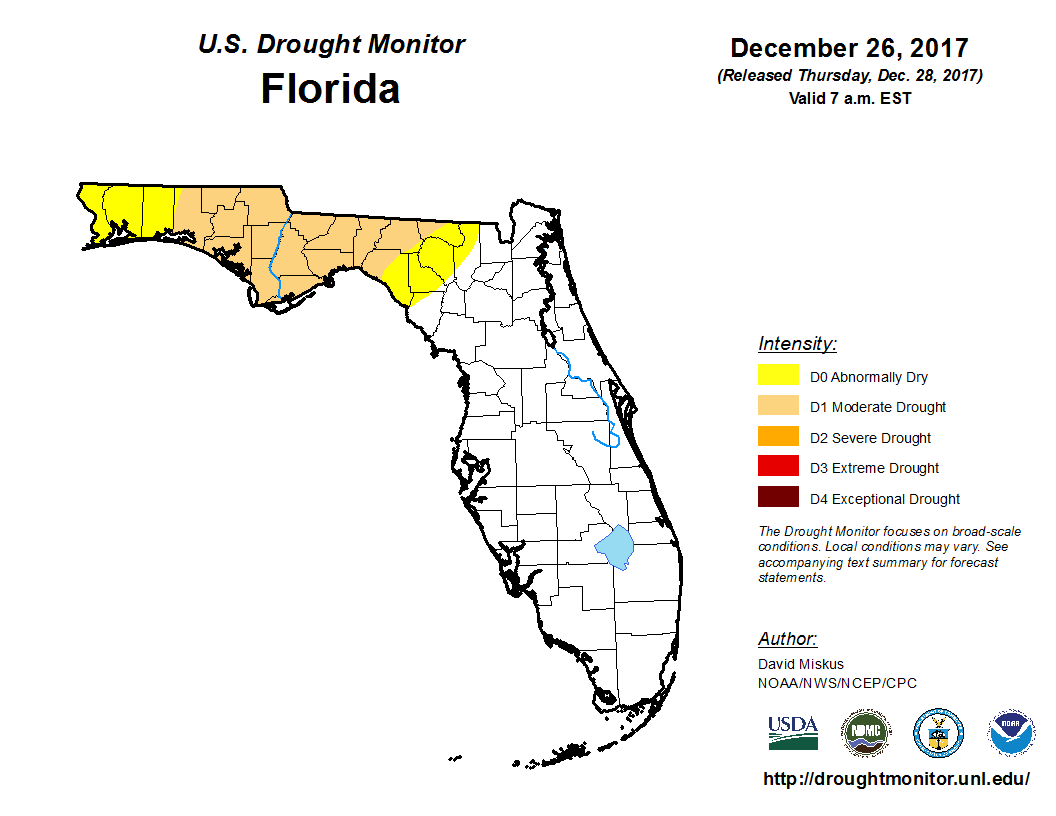
At the end of November, about 22% of the state was experiencing abnormally dry (D0) conditions, and about 12% of the state (including Bay, Calhoun, Gadsden, Gulf, Holmes, Jackson, Franklin, Liberty, Washington, and parts of Leon, Walton, Wakulla Counties) was under moderate drought (D1). As the month progressed, D0 conditions were lifted from Alachua, Baker, Bradford, Citrus, Gilchrist, Levy, Marion, Union, and most of Dixie County. At the same time, the area covered by D1 conditions expanded further westward, into Jefferson, Madison, northwest Taylor and northwest Hamilton counties. Overall, about 9.5% of the state is under D0, and about 18% - under D1 conditions. As of the latest U.S. Drought monitor report, released on December 26th, approximately 765, 000 Florida citizens are currently in drought-impacted areas.
The water levels in Lake Okeechobee have been gradually returning down closer to normal values for this time of the year, and measured at 15.49 feet at the end of December.
Figure 2: Latest U. S. Drought Monitor Map for Florida (from http://droughtmonitor.unl.edu/)
Agriculture-Related Impacts.
At the beginning of December, topsoil moisture levels across the state were mainly adequate (50%) to short (29%), with some surplus and few very short values. This distribution remained in effect for the duration of the month, with only minor changes. The citrus region remained drought-free throughout the month, but most groves were running irrigation to compensate for only sporadic rainfall. Some growers reported early blooming, possibly affected by warmer temperatures. Some vegetables in Palm Beach County also required irrigation due to insufficient rainfall, and some vegetable crops in southern counties saw increase in disease resulting from foggy conditions. Pasture quality is seasonally declining, and was affected by generally low amounts of rainfall. Some pastures were reported damaged by frost in Dixie, Jackson, Osceola and Walton Counties. Cattle are provided supplemental feeding as necessary and remain in mostly good conditions.
Appendix 1: Additional December departures from normal data for Florida locations.
Appendix 2: Select daily maximum and minimum temperature records (° F) broken or tied during December (compiled from NOAA, NWS).
Prepared by Lydia Stefanova, Daniel J. Brouillette, and David F. Zierden.
Florida Climate Center
The Florida State University
Tallahassee, FL
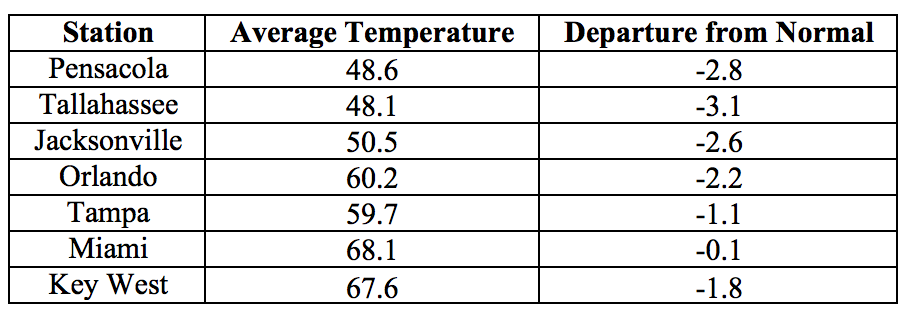
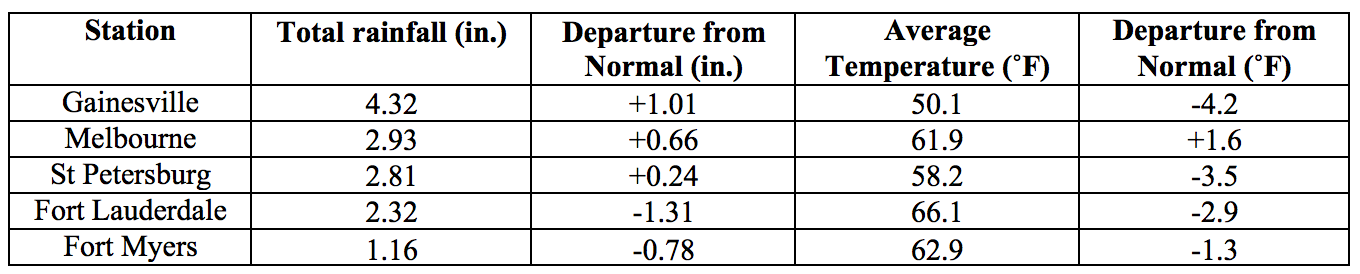
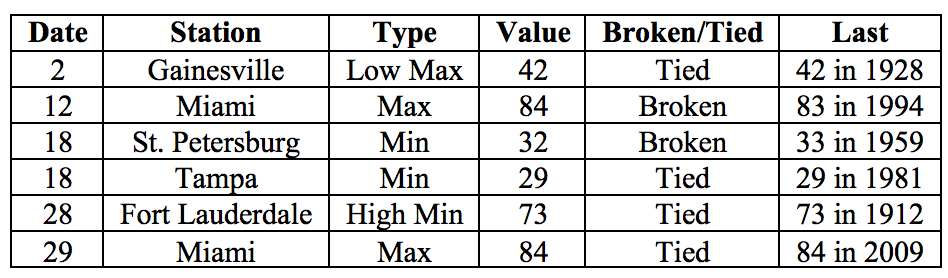
Average temperatures in January were below normal across the state. The departures from average temperatures in January 2018 were below normal across the entire state, with the exception of a single long-term measuring station (Melbourne). Measured departures from normal ranged from -4.2˚F in Gainesville to +1.6˚F in Melbourne (Table 1 and Appendix 1). Minimum temperatures at or below freezing were recorded in multiple days in the Panhandle and all the way to south-central Florida, ranging from 16 days in Tallahassee, 15 days in Gainesville, 12 days in Jacksonville, 11 days in Pensacola, 3 days in Orlando, and 1 day in Melbourne and Tampa. Despite this, for none of the long-term measuring stations with 100 or more years on record did the monthly mean temperatures rank amongst the bottom (or top) ten for January. A handful of daily temperature records were tied or broken across the state (Appendix 2).
Table 1: January average temperatures and departures from normal (˚F) for selected cities.
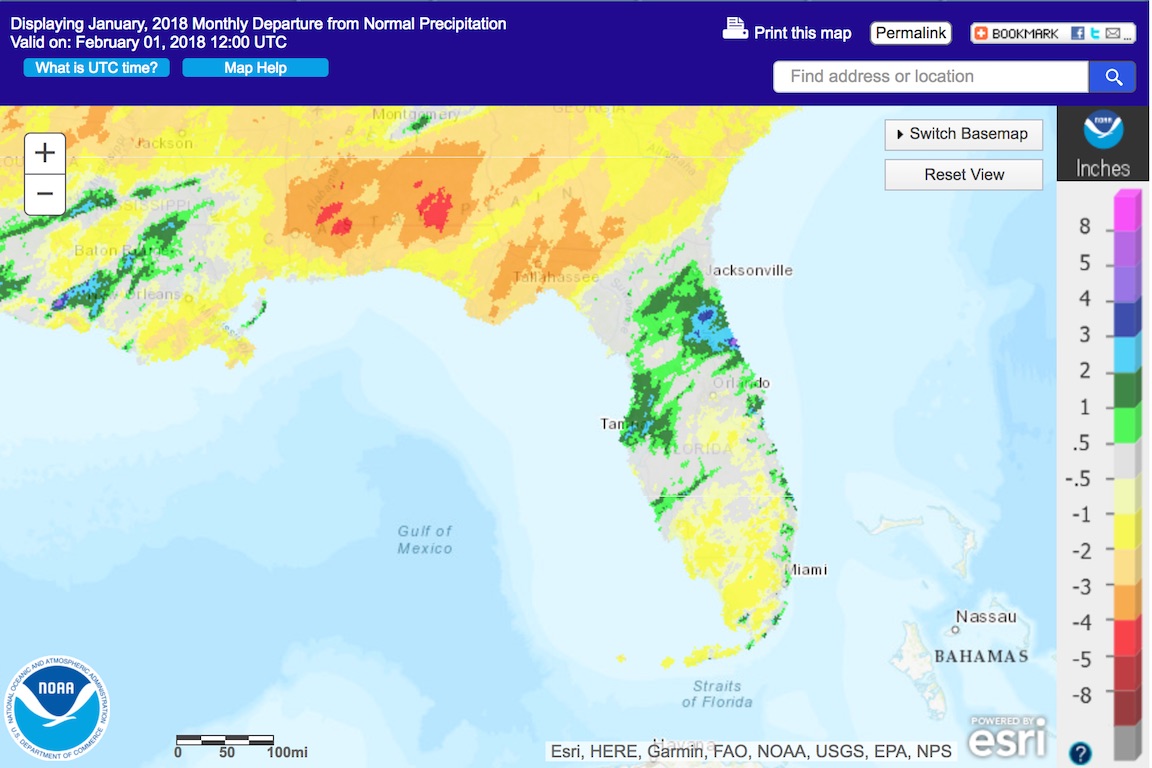
Rainfall totals in January were mixed across the state. Rainfall totals in January 2018 were below normal in the Panhandle and in most of South Florida, and above normal for most of the northern and central portions of the Peninsula (Figure 1). Departures from normal roughly ranged from -2.61” in Tallahassee to +2.77” in Tampa (Table 2 and Appendix 1), although localized parts of the state saw rainfall totals that were as much as 5.00” below normal to 5.00” above normal (Figure 1). One 24-hour rainfall record was broken for the month (Table 3). A record snowfall of 0.1’’ was measured in Tallahassee on January 3rd, breaking the old record of trace set in 2002. This was the first measurable snowfall for Tallahassee since December 23, 1989, and the first measurable snow on record (dating back to 1885) for Tallahassee during the month of January.
Table 2: January precipitation totals and departures from normal (inches) for select cities.
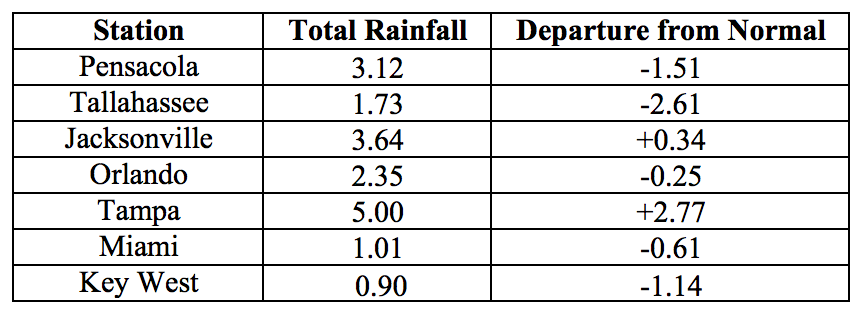
Table 3: Select daily rainfall records (inches) broken during January. (Compiled from NOAA, NWS).
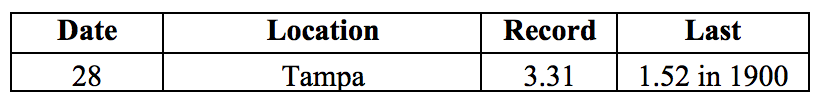
Figure 1: A graphical depiction of the monthly rainfall departure from normal (inches) for January is given in the figure below (courtesy of NOAA, NWS)
La Niña Conditions are Present in the Pacific.
Based on current data and forecast models, the Climate Prediction Center (CPC) ENSO Alert System Status is set to a La Niña advisory. ENSO-neutral conditions are currently present, with sea surface temperatures (SST) below average across the central and eastern equatorial Pacific Ocean. La Niña conditions are likely to persist through the end of winter, with a transition to ENSO-neutral expected during the spring. The CPC seasonal outlook favors above-normal temperatures and below-normal precipitation for Florida through April 2018.
Hazardous Weather Events in January.
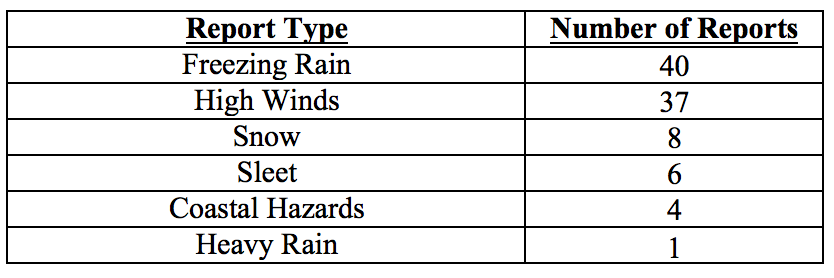
A total of 96 hazardous weather events were recorded in the National Weather Service Local Storm Reports database for January 2018. Over half (54 reports) were related to wintry precipitation (freezing rain, snow, or sleet), followed by high winds (37 reports). Most (41) of the wintry precipitation events were on the 3rd, and the remainder – on the 17th.
Most of the high wind events took place between the 1st and 3rd along the Atlantic Coast from Nassau to Volusia Counties, as a cold airmass pushed into the state, with reports of wind gusts of 40-50 mph. A strong winter storm prompted winter weather warnings for a large portion of the state on January 3rd, and schools were closed in a number of districts in anticipation of snow, sleet, and ice. On that day, freezing rain was seen in Nassau, Madison, Leon, Gadsden, Duval, Wakulla, Columbia, Taylor, Lafayette, Union, Alachua, Gilchrist, Dixie, and Levy Counties. Light snow was recorded in Leon and Union Counties, with an accumulation of 0.1’’ measured in Tallahassee. Icy conditions required closures of several highways and bridges in the Big Bend, including parts of Interstate 10. Ice accumulation of 0.25’’ was reported in Hilliard (Nassau County) and Lake City (Columbia County). Icing of power lines following the freezing rain resulted in several power outages in Columbia, Lafayette, and Nassau Counties.
A second winter storm affected the state on January 17th, bringing snow, sleet and freezing rain to much of the Panhandle. Light snow was observed in Bay and Walton Counties, and sleet or freezing rain was seen in Escambia, Okaloosa, Walton, Jackson, and Gadsden Counties.
Table 4: Breakdown of storm reports submitted in Florida during the month of January (Compiled from Iowa State University/Iowa Environmental Mesonet.)
Drought-Related Impacts.
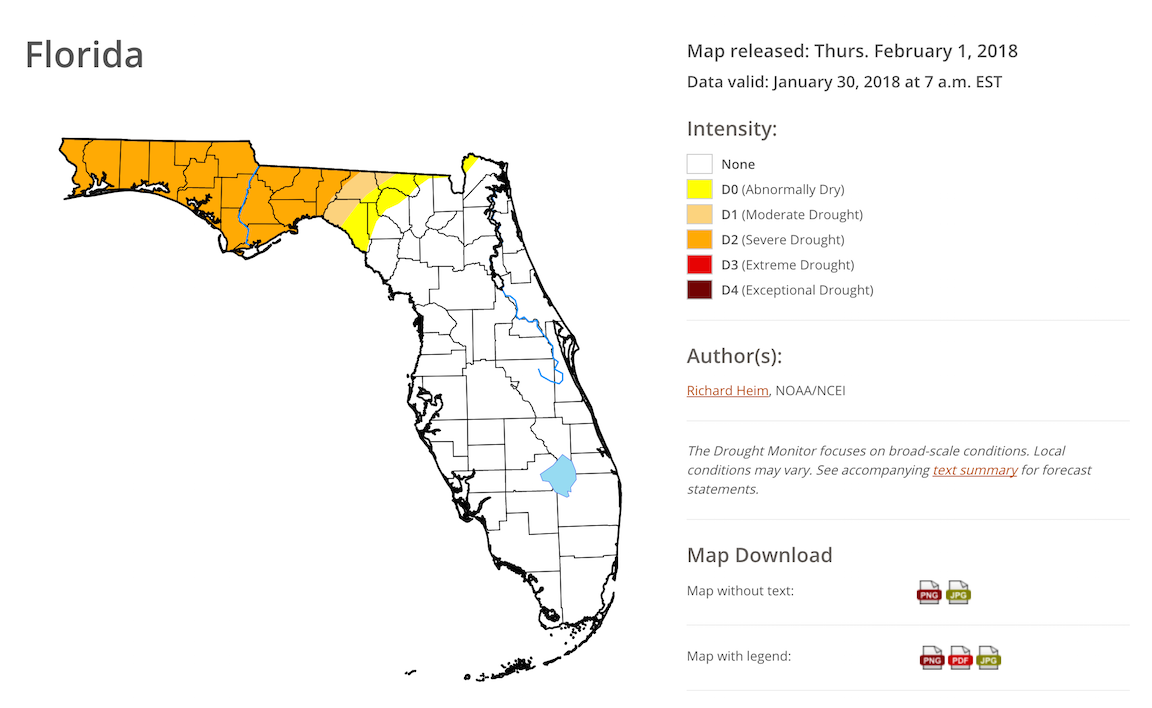
At the beginning of January, approximately 73% of the state was drought-free. The remainder of the state, encompassing the entire Panhandle, was either experiencing moderate drought (22%) or was abnormally dry (5%). The Panhandle drought gradually deepened as the month progressed, but the affected area expanded only slightly. As of the latest U.S. Drought Monitor Report, issued on the 30th, about 21% of the state – from Escambia to Jefferson County – is experiencing severe drought. Moderate drought conditions are affecting parts Taylor, Madison, and Hamilton Counties, and abnormally dry conditions are seen in parts of Taylor, Lafayette, Madison, Suwannee, Hamilton, Columbia and Nassau Counties. Based on census data, roughly 1.4 million Florida citizens, or about 8% of the state’s population, are currently residing in drought-impacted areas.
Water levels in Lake Okeechobee are still above normal but are continuing on a downward trend since peaking in October. The water elevation by the end of the month was 15.23’, which is about 0.6’ above normal for this time of the year.
Figure 2: Latest U. S. Drought Monitor Map for Florida (from http://droughtmonitor.unl.edu/)
Agriculture-Related Impacts.
At the beginning of January, topsoil moisture levels were at mainly (57%) adequate, although some (23%) short or very short (5%), and some surplus (15%) values were reported across the state. At the end of the month, the proportion of adequate topsoil moisture level was similar (58%) but the proportion of short values increased to 33% and that of surplus values decreased to 7%.
The citrus area experienced below freezing temperatures on several occasions – in some cases dropping down to the mid-20s – but those temperatures were not cold enough for long enough to cause any major problems. Most groves were irrigated, because even though the entire citrus-growing region was drought-free throughout the month, it generally received only light rain.
Hard freezes damaged strawberry and blueberry crops in Bradford and Osceola Counties. Many vegetable producers either covered or heavily harvested their crops ahead of the freezes, or used freeze protection irrigation systems. As a result, most vegetables were largely unscathed by the cold, except for minor damage to some sensitive crops.
Many pastures across the Panhandle and Central Peninsula were damaged by freezing temperatures, and most winter grazing in Holmes County failed. Pasture quality across has been declining with the cold temperatures across the state and drought in much of the Peninsula. Cattle are receiving supplemental feeding and have remained in mostly good condition.
In Lafayette County poultry farmers have reported increased spending on heating fuel needed to keep birds warm, and rye and oat crops have been affected by ice.
Sugarcane harvesting and planting has been largely unaffected by the cold weather, and is proceeding as usual.
Appendix 1: Additional January departures from normal data for Florida locations.
Appendix 2: Select daily maximum and minimum temperature records (° F) broken or tied during January (compiled from NOAA, NWS).
Prepared by Lydia Stefanova, Daniel J. Brouillette, and David F. Zierden.
Florida Climate Center
The Florida State University
Tallahassee, FL
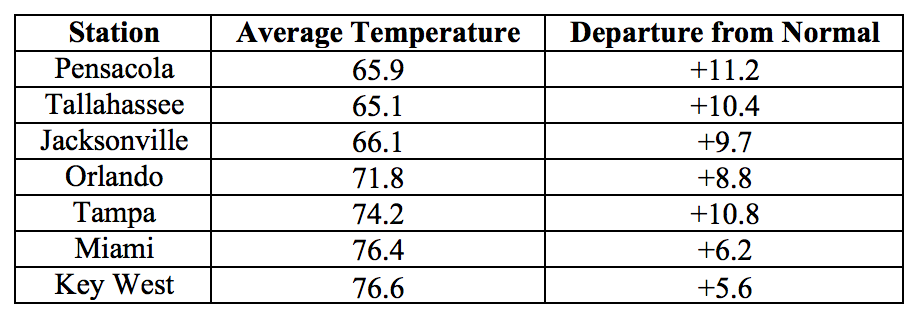
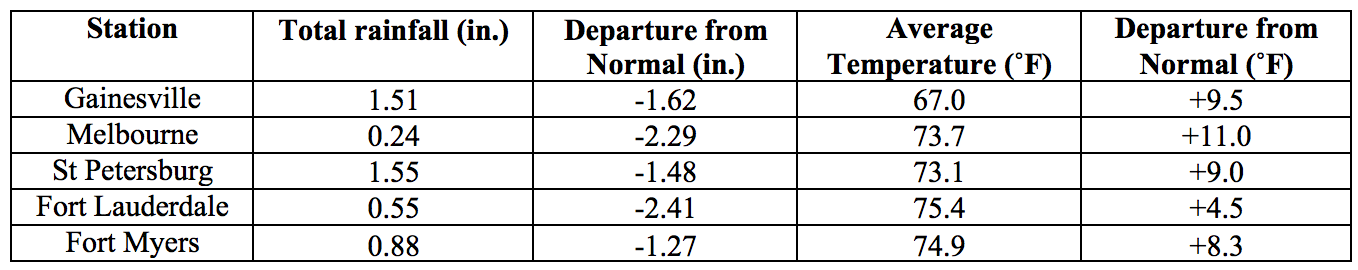
Average temperatures in February were significantly above normal across the state. The departures from average temperatures in February 2018 were significantly above normal across the entire state, ranging from +4.5˚F in Fort Lauderdale to +11.2˚F in Pensacola (Table 1 and Appendix 1). February 2018 was the warmest February on record for a large number of long-term reporting stations, including Pensacola, Tampa, St. Petersburg, Orlando, Melbourne, Fort Myers, West Palm Beach, and Miami. At many of these stations the monthly mean temperature for February 2018 was 2 or even 3˚F warmer than the previously standing record. It was the second warmest February on record for Tallahassee, Jacksonville, Gainesville, and Key West. According to preliminary analysis, this was the warmest February for the state as a whole. A number of daily warm temperature records were tied or broken across the state (Appendix 2).
Table 1: February average temperatures and departures from normal (˚F) for selected cities.
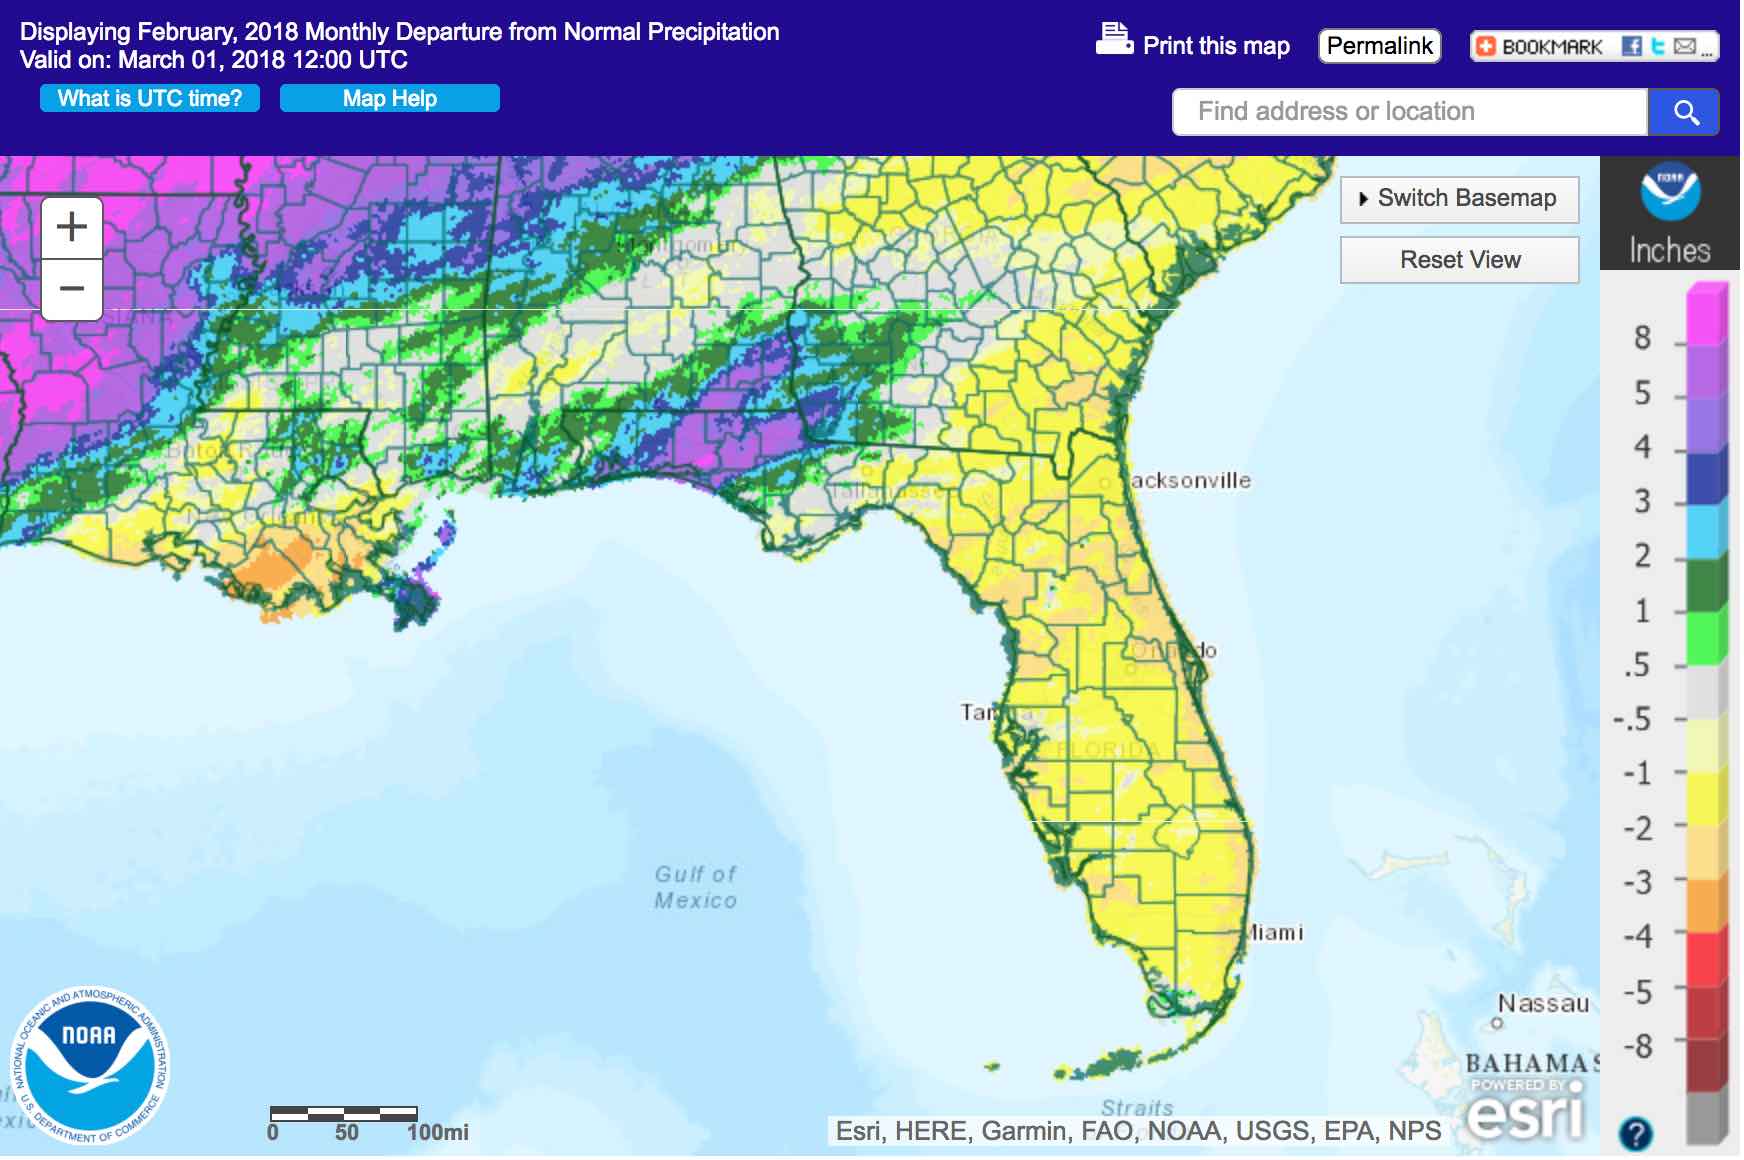
Rainfall totals in February were mixed. Rainfall totals in February 2018 were below normal for the Peninsula and the eastern Panhandle, and above normal in the western Panhandle (Figure 1). Departures from normal roughly ranged from +5.12” in Pensacola to -2.41” in Fort Lauderdale (Table 2 and Appendix 1), although localized parts of the state saw rainfall totals that were as much as 3.00” below normal to 8.00” above normal (Figure 1). One 24-hour precipitation record was broken for the month (Table 3).
Table 2: February precipitation totals and departures from normal (inches) for select cities.
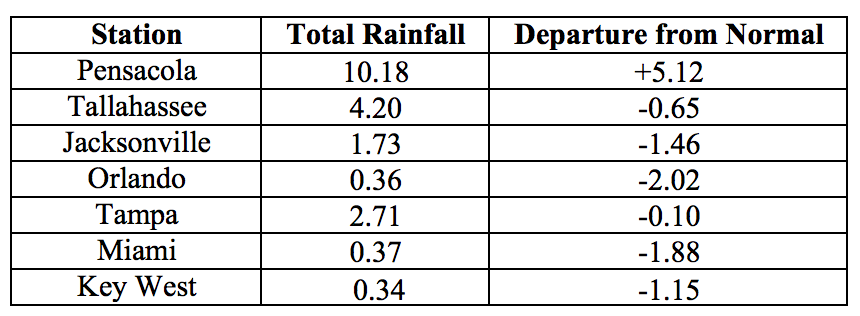
Table 3: Select daily rainfall records (inches) broken during February. (Compiled from NOAA, NWS).
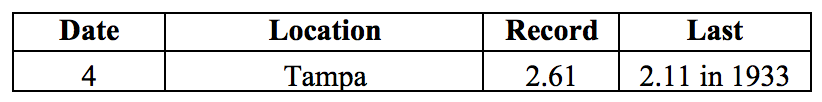
Figure 1: A graphical depiction of the monthly rainfall departure from normal (inches) for February is given in the figure below (courtesy of NOAA, NWS)
La Niña Conditions are Present in the Pacific.
Based on current data and forecast models, the Climate Prediction Center (CPC) ENSO Alert System is still set to a La Niña Advisory. La Niña conditions are currently present, with sea surface temperatures (SST) below average across the central and eastern equatorial Pacific Ocean. Based on forecast model predictions, a transition to ENSO-neutral conditions is favored during the spring of 2018. The CPC seasonal outlook favors above-normal temperatures and below-normal precipitation through May 2018.
Hazardous Weather Events in February.
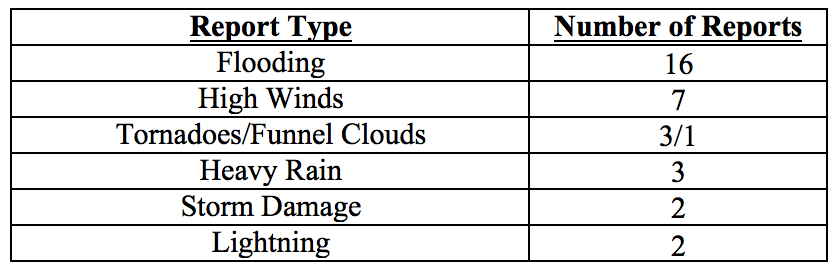
In terms of hazardous weather, February 2018 was a relatively quiet month, with only 34 entries in the Local Storm Reports Database maintained by the National Weather Service (see Table 4). The majority of these involved flooding in the western Panhandle following heavy rains from a passing cold front on the 11th. Several roads in Walton, Holmes, and Washington Counties were closed due to flooding. Two tornadoes were associated with this weather system – an EF1 tornado in Holmes County that destroyed two barns, a carport, and a roof of a house, and caused one minor injury, and an F0 tornado in Jackson County that downed some trees and caused minor building damage.
Table 4: Breakdown of storm reports submitted in Florida during the month of February (Compiled from Iowa State University/Iowa Environmental Mesonet.)
Drought-Related Impacts.
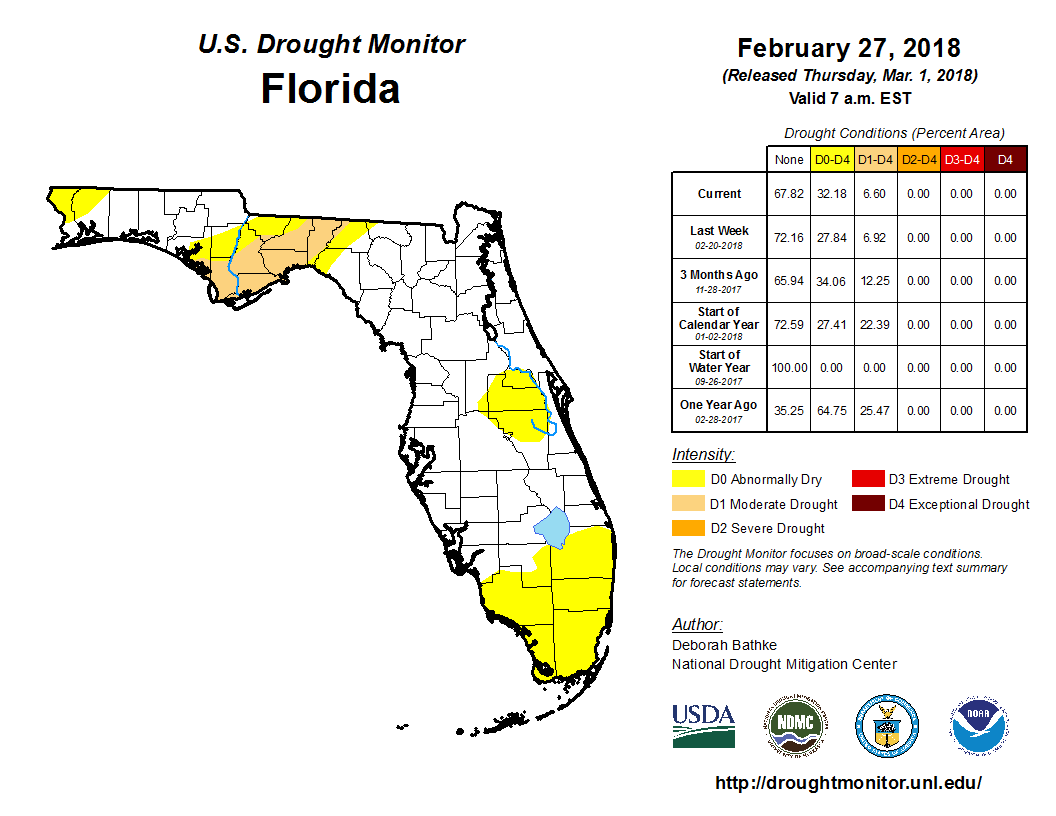
At the end of January, approximately 74% of the state, including the entire Peninsula, was drought free. Most of the remaining 26%, from the western edge of the state to the Big Bend, were experiencing severe drought (D2) conditions. By the first week of the month conditions over the Panhandle started to improve, and by the second week of the areas of severe drought had converted to either a moderate drought (D1) or abnormally dry (D0) state. As the month progressed, D0 conditions took residence in parts of Central and most of South Florida, while large portions of the western Panhandle became drought-free. As of the latest U. S. Drought Monitor report, approximately a quarter of the state is abnormally dry, and less than one-tenth of the state (including Gulf, Franklin, Liberty, Wakulla, Leon, and Jefferson Counties) is experiencing moderate drought. The remainder of the state is drought-free. Lake Okeechobee water levels at the end of the month were at 14.86 ft., which is less than half a foot above normal for this time of the year.
Figure 2: Latest U. S. Drought Monitor Map for Florida (from http://droughtmonitor.unl.edu/)
Agriculture-Related Impacts.
At the end of January, topsoil moisture levels across the state were at mainly adequate (58% of soils) or short (33%), although some (7%) very short values were also reported. During February these values shifted somewhat towards the drier end, with 48% adequate, 29% short, and 11% very short. For the first time since summer 2017 parts of the citrus growing region have begun experiencing abnormally dry conditions. Because of the unseasonably warm temperatures and relatively low rainfall, most citrus groves, even those in drought free areas, have required regular irrigation. Early blossoms have been reported on some citrus varieties. Pastures in most of the Panhandle have not adequately recovered after the earlier severe and moderate drought and insufficient rainfall, although some improvement was seen in Levy and Washington Counties. There were reports of fertilizer washed away from pastures in Jackson County by heavy rain. Cattle across the state remain in mostly good to fair condition, and most producers are using supplemental feed. A wide variety of fruit and vegetable crops were being harvested across the state, and watermelon planting is underway. Some increase in vegetable disease pressure has been seen following unseasonably warm temperatures and foggy mornings in the southern part of the state. Sugarcane harvesting and fertilizing is ongoing in Broward, Glades, Hendry, and Palm Beach Counties. Corn planting is beginning in Lafayette County
Appendix 1: Additional February departures from normal data for Florida locations.
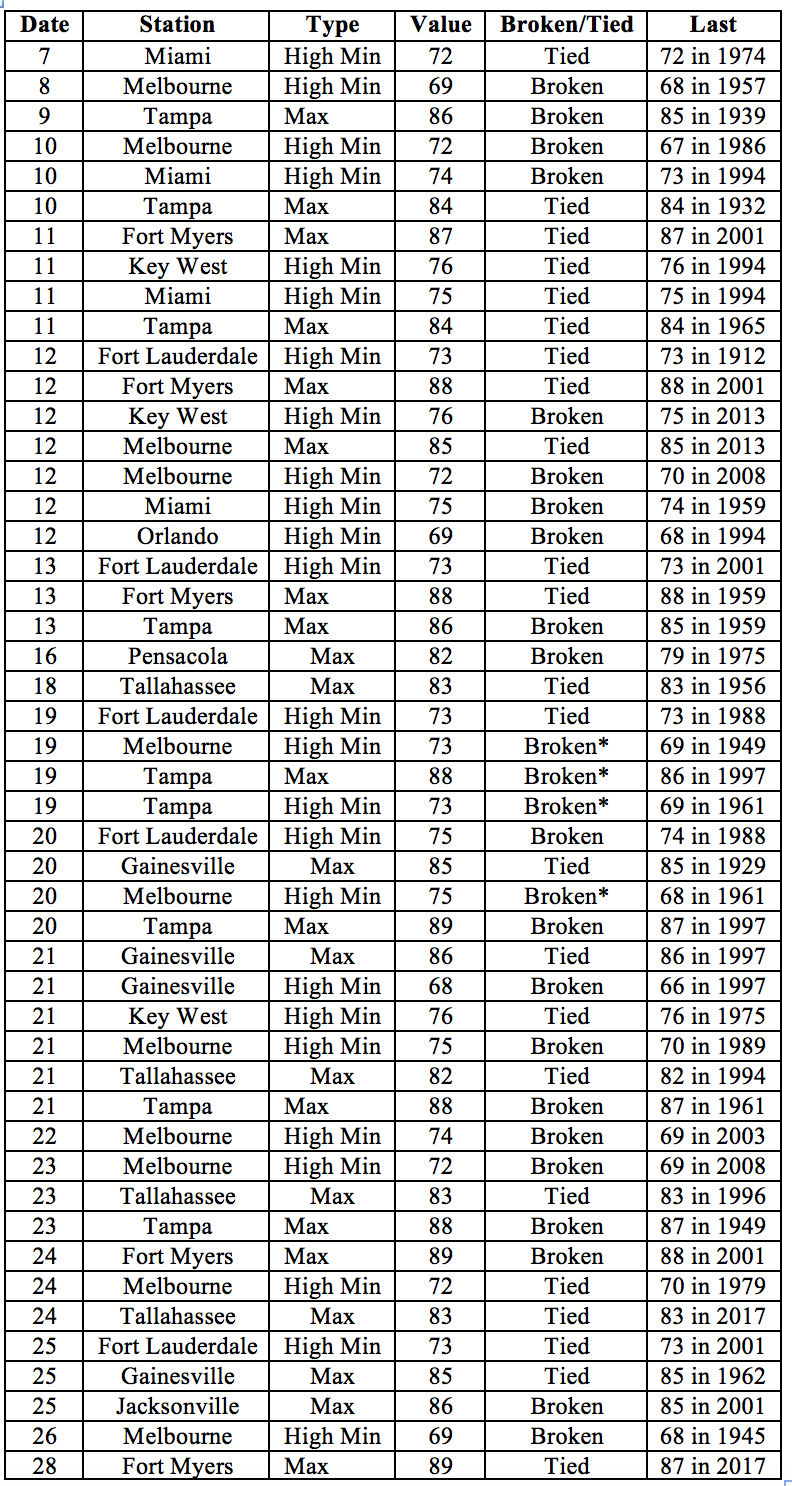
Appendix 2: Select daily maximum and minimum temperature records (° F) broken or tied during February (compiled from NOAA, NWS). Asterisk indicates an all-time record for any day in February.
Prepared by Lydia Stefanova, Daniel J. Brouillette, and David F. Zierden.
Florida Climate Center
The Florida State University
Tallahassee, FL
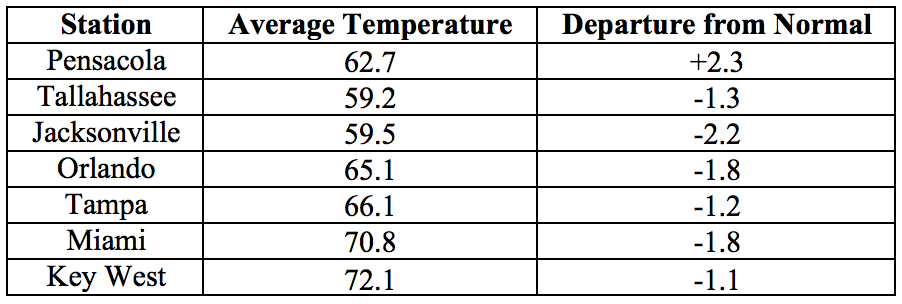
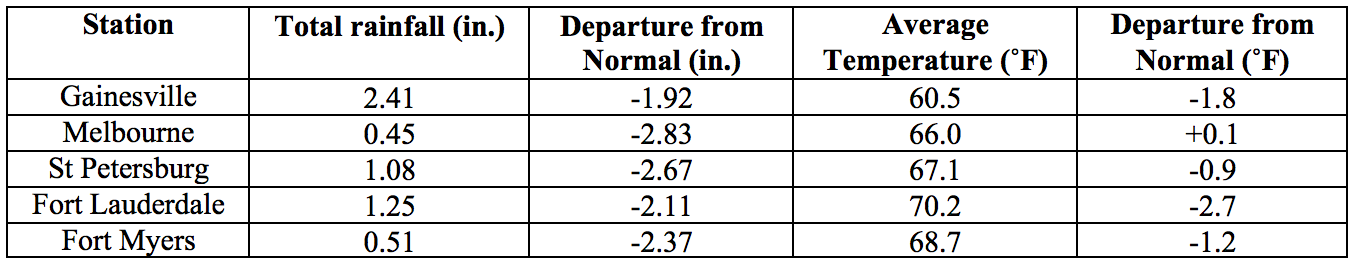
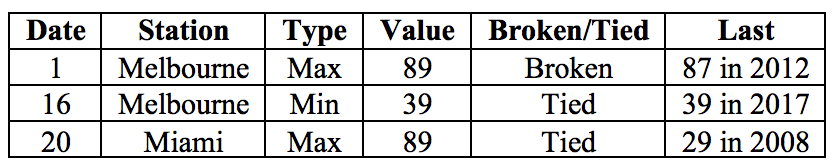
Average temperatures in March were below normal across most of the state. The departures from average temperatures in March 2018 were below normal across the entire state, with the exception of the extreme western Panhandle, ranging from -2.7˚F in Fort Lauderdale to +2.3˚F in Pensacola (Table 1 and Appendix 1). Minimum temperatures at or below freezing were recorded on three nights in Tallahassee, two in Jacksonville, and one in Gainesville. A few temperature records were tied or broken across the state (Appendix 2).
Table 1: March average temperatures and departures from normal (˚F) for selected cities.
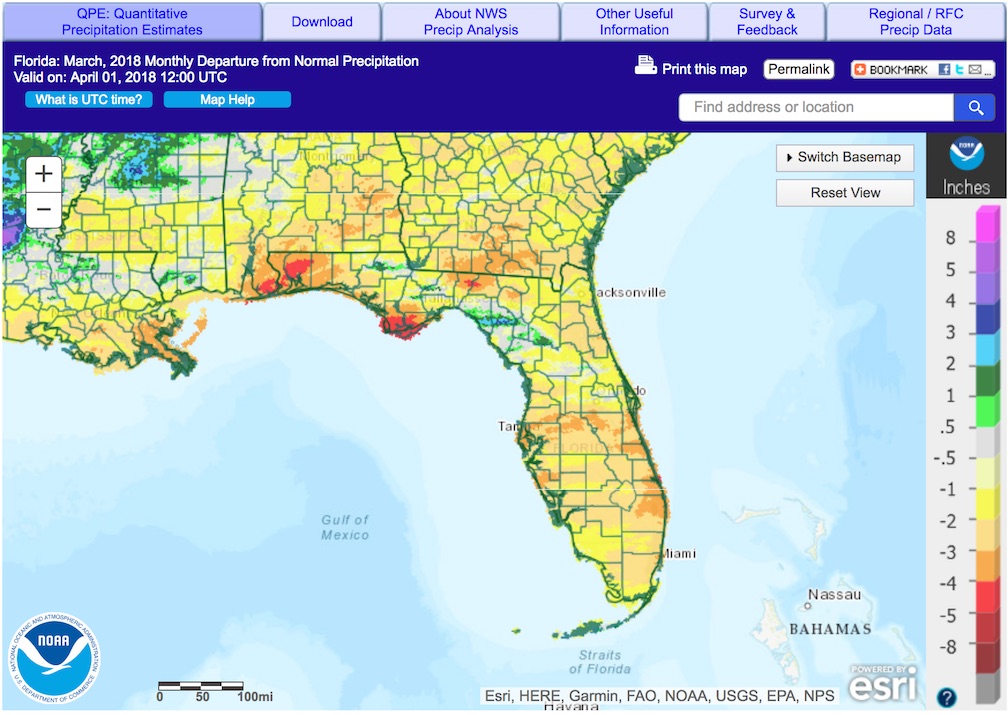
Rainfall totals in March were below normal for most of the state. Rainfall totals in March 2018 were below everywhere in the state except for the Florida Keys (Figure 1). Departures from normal roughly ranged from -3.97” in Pensacola to +0.91” in Tallahassee (Table 2 and Appendix 1), although localized parts of the state saw rainfall totals that were as much as 5.00” below normal to 3.00” above normal (Figure 1). A few 24-hour precipitation records broken for the month (Table 3).
Table 2: March precipitation totals and departures from normal (inches) for select cities.
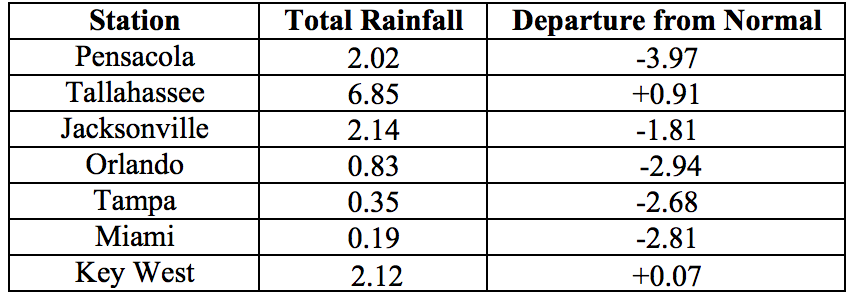
Table 3: Select daily rainfall records (inches) broken during March. (Compiled from NOAA, NWS).
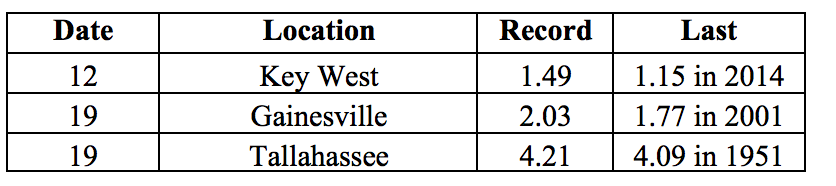
Figure 1: A graphical depiction of the monthly rainfall departure from normal (inches) for March is given in the figure below (courtesy of NOAA, NWS)
La Niña Conditions are Present in the Pacific.
Based on current data and forecast models, the Climate Prediction Center (CPC) ENSO Alert System is still set to a La Niña Advisory. La Niña conditions are currently present, with sea surface temperatures (SST) below average across the central and eastern equatorial Pacific Ocean. Based on forecast model predictions, a transition to ENSO-neutral conditions is favored sometime during the spring of 2018. The CPC seasonal outlook favors above-normal temperatures for Florida through June 2018.
Hazardous Weather Events in March.
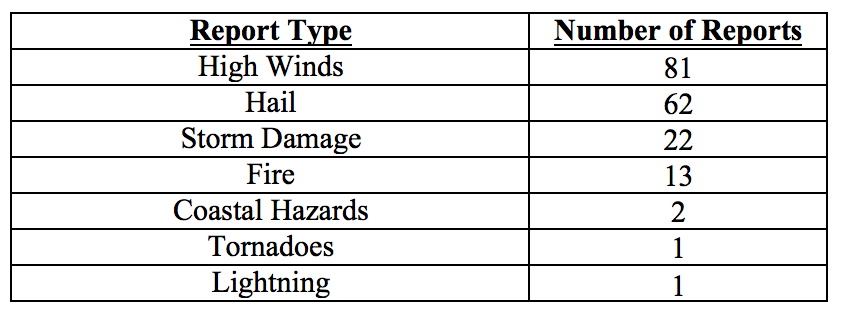
There were a total of 182 hazardous weather events logged to the National Weather Service Local Storm Reports Database for the state during March 2018. The majority of the hazardous weather events involved high winds, hail or storm damage (see Table 4 for a breakdown).
Over 2/3 of all events occurred on a single day, the 20th of the month when a strong cold front swept through the state. Wind gusts over 60 and up to 77 mph were recorded across Brevard County. Gusts between 40 and 60 mph were felt in Brevard, Duval, Franklin, Gadsden, Highlands, Hillsborough, Lake, Leon, and Marion Counties. Wind damage (fallen trees, branches, and power outages) was reported in Franklin, Gadsden, Hardee, Highlands, Jefferson, Lafayette, Pinellas, Taylor and Wakulla Counties. Hail with diameter up to 2” was reported in Daytona Beach (Volusia County), and golf-ball size (1.75”) was seen in Duval, Orange, Seminole, and Volusia Counties. Hail of various sizes affected parts of Baker, Brevard, Citrus, Dixie, Duval, Flagler, Levy, Marion, Nassau, Okeechobee, Orange, Pinellas, Seminole, Sumter and Volusia Counties.
There were several wildfires during the month in various parts of Collier, Gulf, Hendry, Miami-Dade, and Nassau Counties. Temporary burn bans are currently in effect in Charlotte, Hendry, and Osceola Counties. No significant damage of structures has been reported.
A brief F-0 tornado touchdown was recorded on camera on the 21st near Belle Glade, but caused no damage as it was in an empty field.
Rip currents claimed the life of a man attempting to rescue two children stranded in rough surf on Navarre Beach (Santa Rosa County), and high surf was responsible for two injuries on Riviera Beach (Palm Beach County).
Table 4: Breakdown of storm reports submitted in Florida during the month of March (Compiled from Iowa State University/Iowa Environmental Mesonet.)
Drought-Related Impacts.
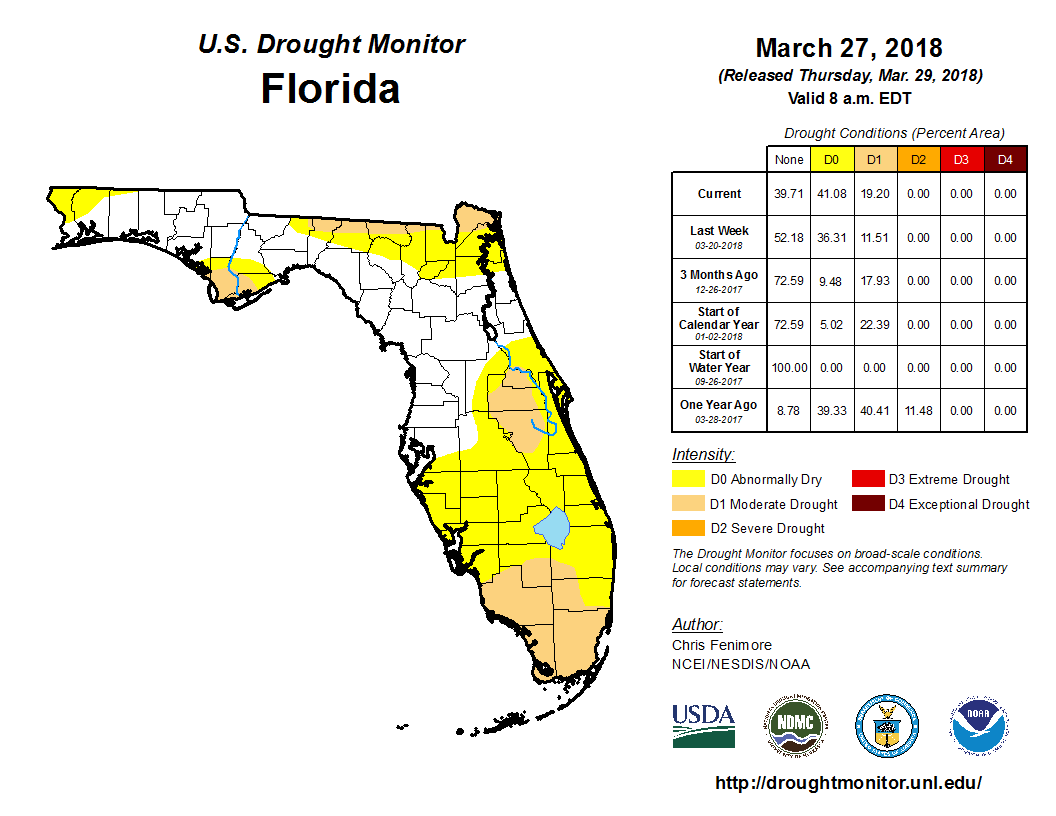
At the end of February, approximately 68% of the state was unaffected by drought. About a quarter of the state (most of South Florida, and parts of Central Florida and the Panhandle) was experiencing abnormally dry (D0) conditions, and the Western Panhandle was under moderate drought (D1). As the month progressed, the D1 conditions in the Western Panhandle initially spread out, but were largely cleared by the end of the month. The D0 conditions in South and Central Florida expanded, and some deepened into D1. As of the last US Drought Monitor report dated March 27, approximately 40% of the state was drought-free, 41% is experiencing D0 conditions, and 19% is under D1 conditions. The D1 conditions are affecting Gulf, Franklin, Jefferson, Madison, Hamilton, Columbia, Baker, Nassau, Seminole, Orange, Osceola, Hendry, Palm Beach, Broward, Collier, Monroe, and Miami-Dade Counties. Water levels in Lake Okeechobee at the end of the month were at 13.84 ft., which is slightly below normal for this time of the year.
Figure 2: Latest U. S. Drought Monitor Map for Florida (from http://droughtmonitor.unl.edu/)
Agriculture-Related Impacts.
At the beginning of March, topsoil moisture levels were at mainly adequate (47%) to short (37%), although some 14% of values were in the very short category. As the month progressed, there was a gradual shift towards drier conditions, ending at 38% adequate, 36% short, and 26% very short levels. Citrus growers in most groves have been irrigating daily, and canals and ditches were low because of insufficient rainfall. Many vegetable producers have also been using irrigation. Watermelon fields in Dixie County had to be replanted several times following damage on several occasions from frost, flooding, hail or wind. Pasture conditions have been declining following frost in the northern counties and general lack of rain. Cattle condition across the state has been trending downwards from mostly good to mostly fair. Most cattle have been receiving supplemental feed and water. Some potato plantings in Suwannee County were severely damaged by frost, and frost concerns delayed corn planting in northern and central counties.
Appendix 1: Additional March departures from normal data for Florida locations.
Appendix 2: Select daily maximum and minimum temperature records (° F) broken or tied during March (compiled from NOAA, NWS). Asterisk indicates an all-time record for any day in February.
Prepared by Lydia Stefanova, Daniel J. Brouillette, and David F. Zierden.
Florida Climate Center
The Florida State University
Tallahassee, FL
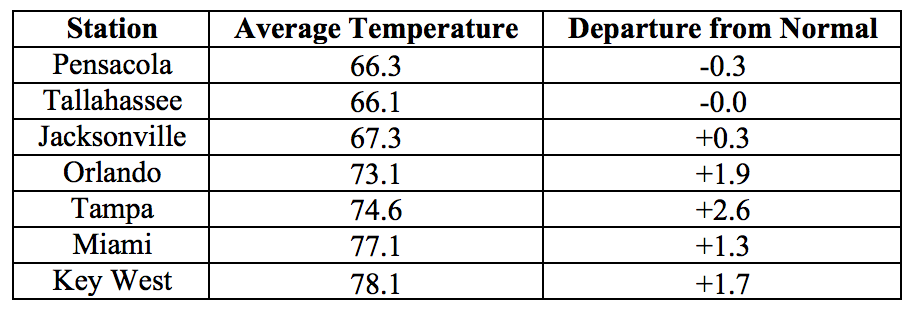
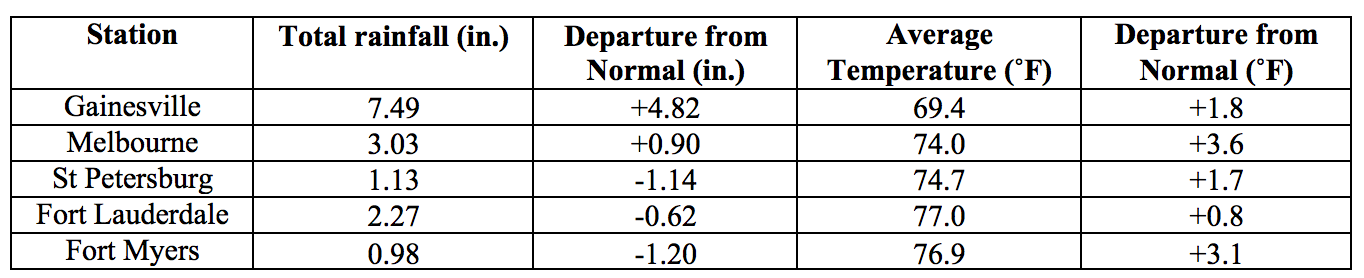
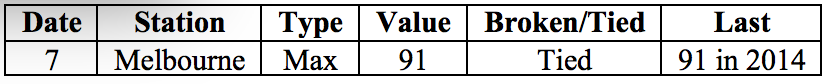
Average temperatures in April were above normal across most of the state. The departures from average temperatures in April 2018 were near- to above-normal across the state, ranging from -0.3˚F in Pensacola to +3.6˚F in Melbourne (Table 1 and Appendix 1). Daily maximum temperatures at or above 90˚F were seen on at least one day at most stations from Orlando southward. April 2018 was the 7th warmest in Fort Myers. Across the state, only one high temperature record was tied and none were broken (Appendix 2).
Table 1: April average temperatures and departures from normal (˚F) for selected cities.
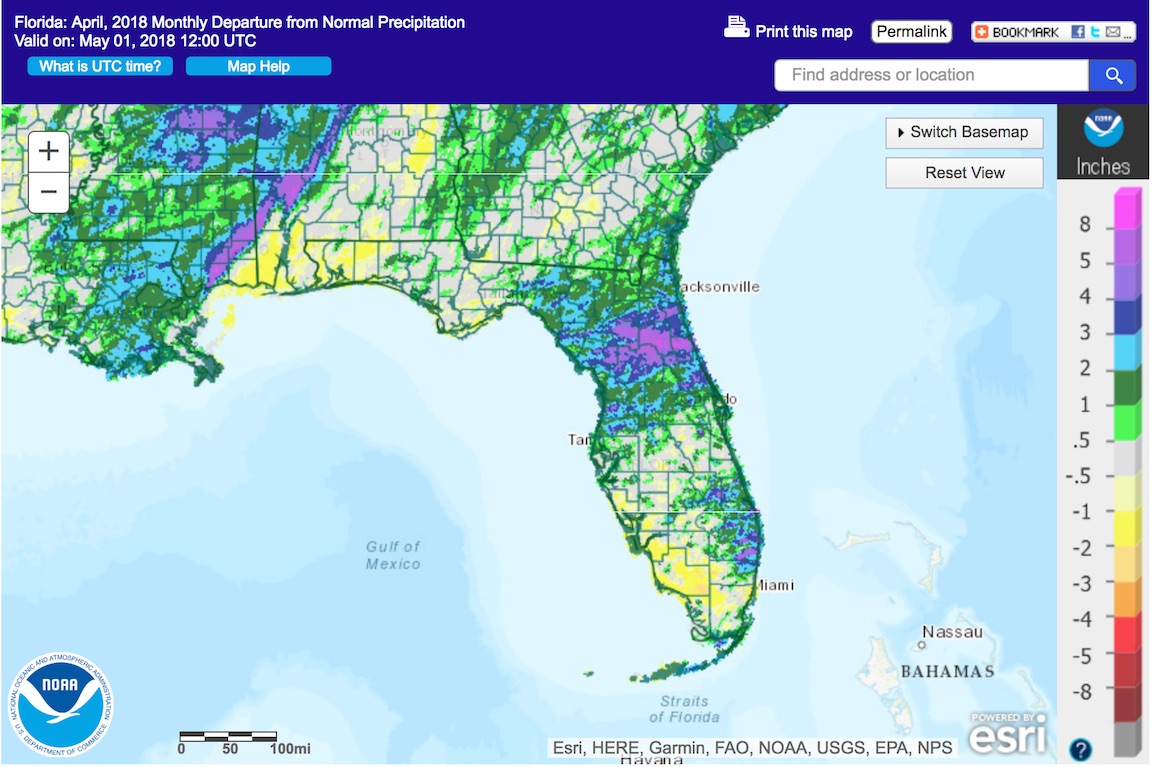
Rainfall totals in April were mixed across the state. Rainfall totals in April 2018 were mixed across the state, with below-normal values in the western Panhandle and southwestern Florida, and above-normal values in most other locations (Figure 1). Departures from normal at major reporting stations ranged from -1.84” in Key West to +4.82” in Gainesville (Table 2 and Appendix 1), although localized parts of the state saw rainfall totals that were as much as 3.00” below normal to 8.00” above normal (Figure 1). One daily precipitation record was broken (Table 3).
Table 2: April precipitation totals and departures from normal (inches) for select cities.
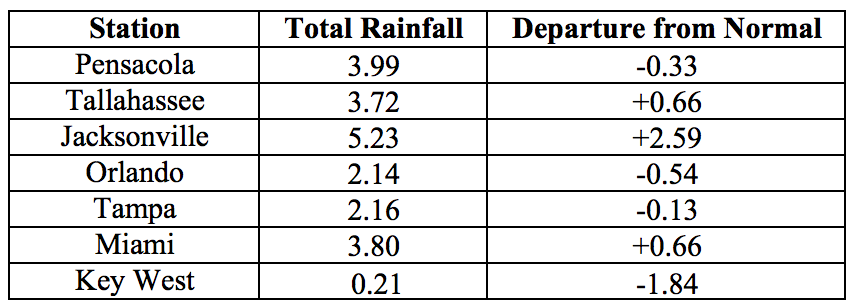
Table 3: Select daily rainfall records (inches) broken during April. (Compiled from NOAA, NWS).
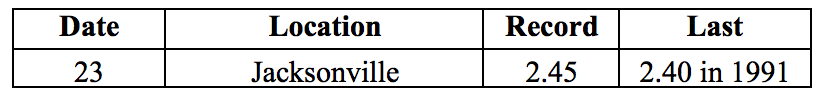
Figure 1: A graphical depiction of the monthly rainfall departure from normal (inches) for March is given in the figure below (courtesy of NOAA, NWS)
La Niña Conditions are Present in the Pacific.
Based on current data and forecast models, the Climate Prediction Center (CPC) ENSO Alert System is still set to a La Niña Advisory. La Niña conditions are currently present, with sea surface temperatures (SST) near- to below- normal across the east-central and eastern equatorial Pacific Ocean. Based on forecast model predictions, a transition to ENSO-neutral conditions is favored sometime during April-May of 2018. The CPC seasonal outlook favors above-normal temperatures for Florida through July 2018.
Hazardous Weather Events in April.
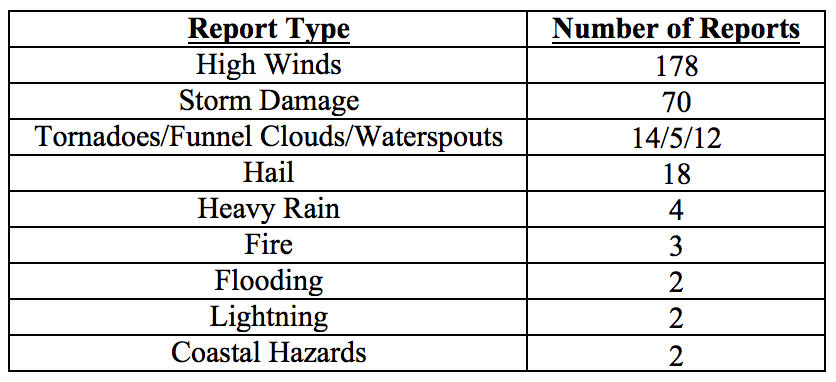
There were a total of 310 hazardous weather events logged to the National Weather Service Local Storm Reports Database for the state during April 2018. The majority of the hazardous weather events involved high winds and storm damage (see Table 4 for a breakdown).
Over half of the hazardous weather reports came in on April 15th and into the early hours of the 16th, as an intense cold front swept through the region. This front produced strong winds across the state, with gusts exceeding 60 mph reported in Brevard, Flagler, Indian River, and Sarasota Counties, and over the waters near Miami and the Florida Keys, and wind gust of 74 mph recorded by a USAF weather station in Brevard County. A trained spotter in Marion County recorded 1.50” of rain over a period of just 45 minutes. Fallen limbs, trees and damaged powerlines were seen in Bay, Brevard, Calhoun, Clay, Duval, Flagler, Hamilton, Jefferson, Lafayette, Lake, Leon, Madison, Marion, Orange, St. Johns, Suwannee, Taylor, Wakulla, and Walton Counties. This weather system produced two waterspouts near Tampa, a funnel cloud in Flagler County, and tornadoes in Bay, Monroe, and Pinellas Counties.
During April there were several hazardous weather-related injuries and two fatalities in Florida. Several swimmers were caught in rip currents near Jupiter in Palm Beach County on the 2nd of the month, and one person was drowned and another injured by rip currents near Daytona Beach, Volusia County on the 27th. A lightning on the 7th struck several people sheltering from the storm near a trailer in Hamilton County, killing one victim and injuring four. One person was injured by a lightning strike on a beach in Hillsborough County. Two people were injured when a waterspout moved ashore in Fort Walton Beach, Okaloosa county as an EF-1 tornado. One person was injured when a large tree fell on a trailer home in Jacksonville on the 15th.
There were several tornado reports during the month, in Bay, Broward, Escambia, Hillsborough, Monroe, Okaloosa, Palm Beach, and Pinellas Counties. Waterspouts were spotted on various dates in the vicinities of Palm Beach, Miami Beach, and the Florida Keys. Hail with diameter of up to 3” was seen in St. Johns County on the 10th. Smaller hail was also seen on that day in Brevard, Broward, Hardee, and Orange Counties. On the 24th, there was hail reported in Martin, Palm Beach, and St. Lucie Counties. Wildfires were reported in Brevard, Collier and Palm Beach Counties. Temporary burn bans are in effect in Charlotte, Glades, Hendry, Osceola, and Sarasota Counties.
Table 4: Breakdown of storm reports submitted in Florida during the month of March (Compiled from Iowa State University/Iowa Environmental Mesonet.)
Drought-Related Impacts.
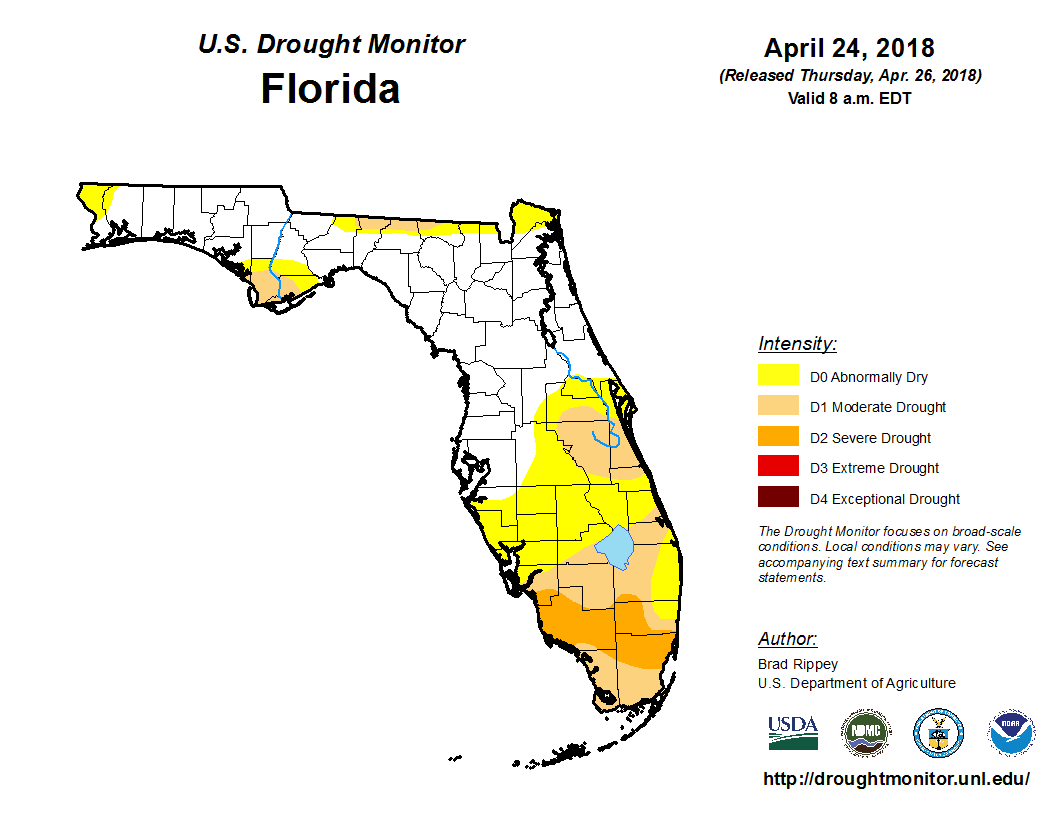
At the end of March, approximately 40% of the state was drought-free, 41% is experiencing D0 conditions, and 19% is under D1 conditions. The D1 conditions are affecting Gulf, Franklin, Jefferson, Madison, Hamilton, Columbia, Baker, Nassau, Seminole, Orange, Osceola, Hendry, Palm Beach, Broward, Collier, Monroe, and Miami-Dade Counties. As the month progressed, some of the D0 conditions were alleviated, particularly in the northern and central portions of the state, but severe drought (D2) conditions appeared in southern Florida. As of the latest US drought monitor report, dated April 24, about 51% of the state is drought-free, 24% is experiencing D0 conditions, 18% - D1 conditions. D2 conditions affect about 7% of the state’s area, including small portions of Lee, Monroe, and Palm Beach Counties, large portions of Broward and Dade Counties, and most of Collier County. In all, about 6.7 million Florida citizens are residing in drought-affected areas.
Lake Okeechobee water levels at the end of April were at 13.16 ft., which is slightly below the normal value for this time of the year.
Figure 2: Latest U. S. Drought Monitor Map for Florida (from http://droughtmonitor.unl.edu/)
Agriculture-Related Impacts.
At the beginning of April, topsoil moisture levels were at mainly (42%) adequate, but there was a significant proportion of short (34%) or very short (24%) values. Soil moisture levels improved over the course of the month, ending at predominantly (60%) adequate, 35% short, and only 3% very short values.
Most of the citrus growing area was affected by either abnormally dry conditions or moderate to severe drought. Irrigation was regularly used to maintain sufficient moisture in the groves, and canals and ditches in many areas were dry. Harvesting of this season’s citrus crop is virtually complete for most citrus. Numerous fruit and vegetable crops are being planted and harvested. Some crops, including watermelons, tomatoes, peppers, and eggplant were harmed by strong winds and low temperatures early in the month. Some potato crops were negatively affected by disease as a result of heavy rains. Producers in the Panhandle have been in varying stages of field preparation and planting of corn, tobacco and peanuts. Suwannee County peanut planting has been delayed due to low soil temperatures. Sugarcane producers have been actively harvesting and planting. Cattle have been holding at mostly good to fair condition, while pastures have remained mostly fair. Most livestock producers have continued to provide supplemental feed, although areas that received sufficient rainfall have seen improvement in pasture conditions.
Appendix 1: Additional April departures from normal data for Florida locations.
Appendix 2: Select daily maximum and minimum temperature records (° F) broken or tied during April (compiled from NOAA, NWS). Asterisk indicates an all-time record for any day in February.
Building A, Suite 292
Tallahassee, FL 32306-2741
Phone: (850) 644-3417 | (850) 644-0719
climate@coaps.fsu.edu