Prepared by Melissa Griffin and David F. Zierden.
Florida Climate Center
The Florida State University
Tallahassee, FL

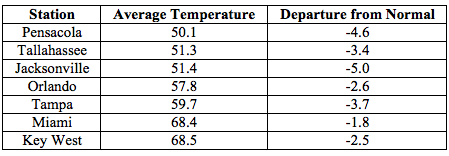
Average temperatures were below normal across the state in February. The departures for average temperatures in February 2015 were below normal across the entire state, with departures ranging from -1.8˚F in Miami to -5.0˚F at Jacksonville. (Table 1 and Appendix 1). Most stations in the Panhandle, Big Bend and North Florida recorded at least one day with a minimum temperature below freezing (32˚F) during February, and a few locations as far south as La Belle, FL reported a day below freezing on the 20th. February 2015 was the 9th coldest on record in Gainesville. Multiple temperature records were tied or broken across the state in January (Appendix 2).
Table 1: February average temperatures and departures from normal (˚F) for selected cities.
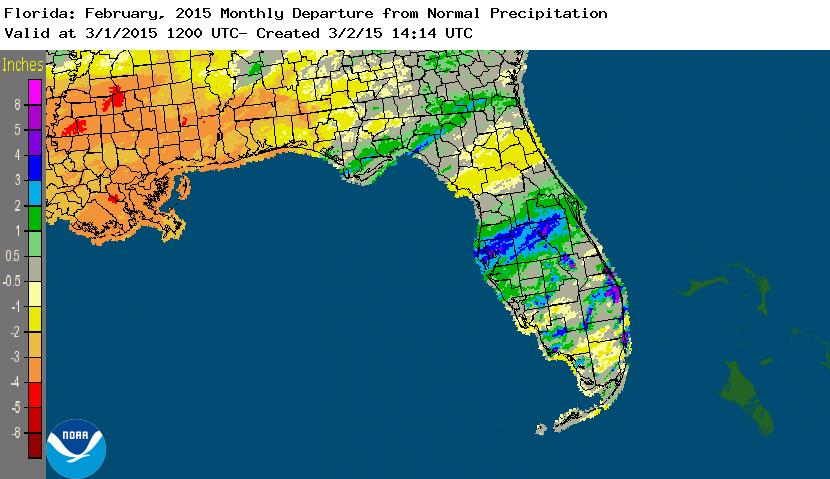
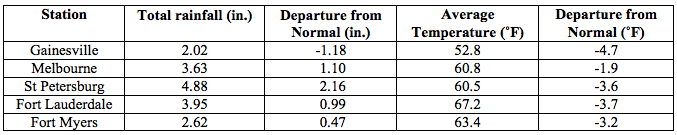
Rainfall totals were varied across the state in February. Most of the western Panhandle and the northern Peninsula saw below normal rainfall during February, while portions of the Big Bend, Central Florida and the East Coast had rainfall totals above normal (Figure 1). Departures from normal roughly ranged from -1.18” to 3.74” (Table 2 and Appendix 1), though localized parts of state saw rainfall totals that were as much as 4.00” below normal to over 5.00” above normal (Figure 1). February 2015 was the 7th wettest on record in Tampa and Orlando, the 9th wettest for Plant City and the 10th wettest in Hialeah. A significant rain event took place in the Broward and Dade counties on the 28th, where some locations along the coast picked up over 5.00” of rain. There were multiple 24-hour precipitation records broken for the month (Table 3).
Table 2: February precipitation totals and departures from normal (inches) for selected cities.
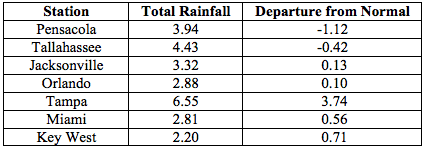
Table 3: Select daily rainfall records (inches) broken during February. (Compiled from NOAA, NWS)
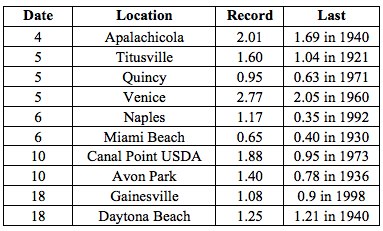
Figure 1: A graphical depiction of the monthly rainfall departure from normal (inches) for February is given in the figure below (courtesy of NOAA, NWS)
ENSO-Neutral Conditions Continue in the Pacific.
Based on current data and forecast models, the Climate Prediction Center (CPC) continues to have an El Niño Watch in place. Positive sea surface temperatures (SST) anomalies have been recorded across the western and central Pacific Ocean, while near average SSTs are evident in the eastern Pacific. There is still a 50% chance of an El Niño event developing within the late winter/early spring. After the Northern Hemisphere winter, a return to ENSO-Neutral conditions is favored. CPC predicts normal temperatures and above normal precipitation across the state through May 2015.
Hazardous Weather Events in February.
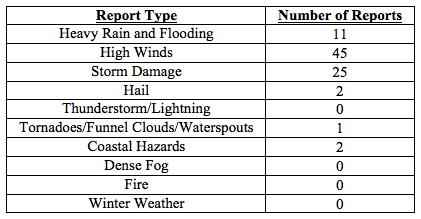
There were a total of 86 severe weather reports made in Florida during February. On the 5th, a tornado made two touchdowns in the Boca Raton area. The first touchdown was rated as an EF-1, and the second was rated as an EF-0. Several trees were uprooted or snapped in half, and a home sustained damage from a projectile tree limb that punctured its roof. High winds, up to 60 mph, and additional storm damage were reported on the same day in Boynton Beach, Delray Beach, and along the Florida Keys. The tidal gauges near Fernandina Beach and Mayport recorded astronomical low tides (-6.13 and -4.92 ft.) on the 19th, due to a ‘blow-out’ after the passage of a strong cold front on the morning of the 19th. The same cold front caused high winds, up to 50 mph, along many locations in the Keys. A developing low-pressure system and associated warm front caused severe weather in the Big Bend during the 25th and 26th. Multiple reports of strong winds, downed trees and power lines, and damage to structures were reported from locations in and around Panama City Beach, Tallahassee, Lake City, Jacksonville, Gainesville, and Tampa. At the end of the month, a stationary front over South Florida brought heavy rains and flooding from Port St. Lucie to Miami, with a few places reporting nearly 10” of rain. There were reports of dime and pea-sized hail in Kissimmee and at the FAU Campus on the 28th.
Table 4: Breakdown of storm reports submitted in Florida during the month of February. (Compiled from Southeast Regional Climate Center.)
Agricultural and other climate related impacts.
At the beginning of February, soil moisture continued to be mostly adequate in the Panhandle and northern Florida from rains in January. Blueberry bushes showed signs of early blooming in Marion County, and harvesting of fruits and winter vegetables continued across the state. Pasture and cattle conditions in South Florida were in decline and producers were providing supplemental feed as necessary. Fieldwork and soil preparation for the spring plantings continued in the Panhandle. Excess water from early February rains was being pumped out of fields in locations across central Florida, especially in Brevard County. Some pastures were in poor conditions due to standing water, and farmers in Orange and Seminole counties were having problems locating hay for their cattle. Toward the middle of the month, citrus growers were noticing some bloom, mostly on early variety fruit, and new growth was seen on well-maintained trees. Growth of cool-season forage crops slowed due to cold weather and frost across northern Florida and parts of the Peninsula. Sub-freezing temperatures caused damage to the tops of some vegetables plants with most extensive damage was to corn and bean and blueberries were damaged by the frost. The windy weather that preceded the freeze battered sensitive vegetable crops, causing minimal damage. Most of the citrus processing plants were up and running, though most of the plants plan on finishing early and midseason oranges by the end of February.
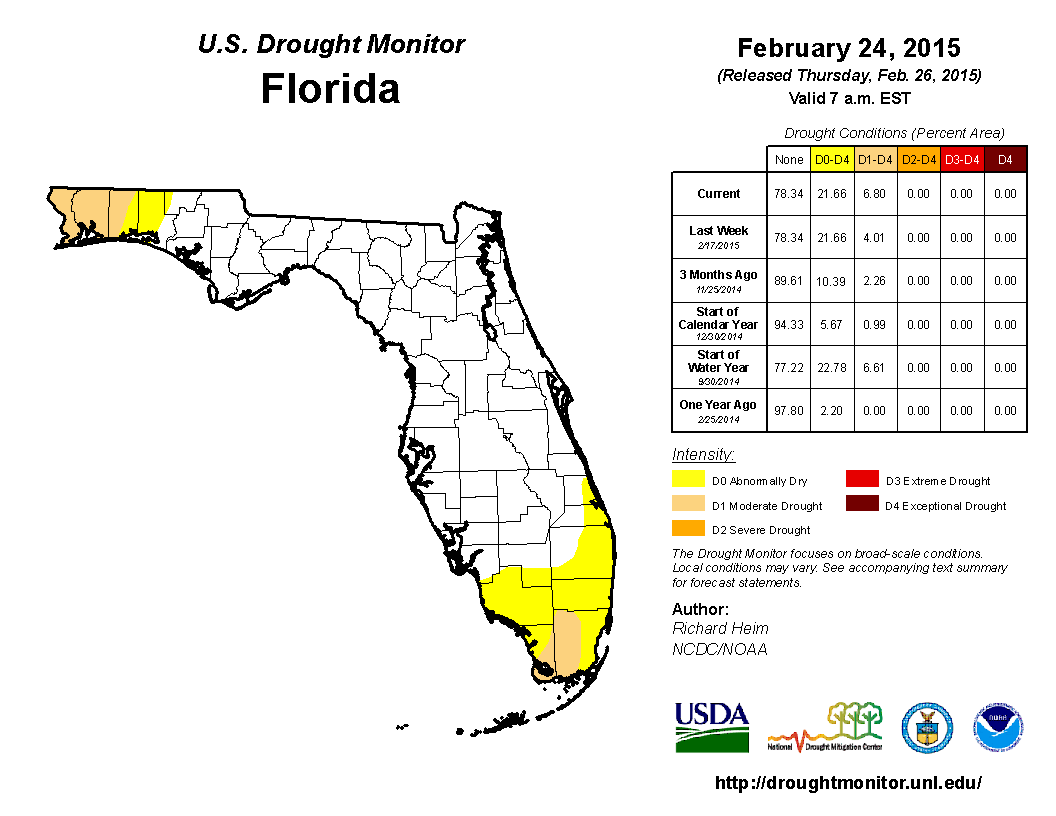
February started off with nearly 14% of the state reporting abnormally dry (D0) conditions, with the main concentration of the dryness located in the western Panhandle and southern Florida. Widespread rainfall impacted the state on the 5th and 6th of February, but the dry start to the month exacerbated conditions in the southern part of the state, and D0 was added to all of Broward and Collier counties and extended along coastal Indian River and St. Lucie counties. Another storm system brought rain to the Panhandle on the 17th and 18th, however near the end of the month, moderate drought (D1) conditions were introduced in portions of Miami-Dade and Monroe counties, especially in the Everglades National Park. The lack of rainfall throughout the month caused the expansion of existing D1 in Escambia County into all of Santa Rosa and western portions Okaloosa counties in the Panhandle. At the end of the month, the water level in Lake Okeechobee had dropped to under 15 ft., mainly due to regulatory releases. Heavy rains in portions of Alabama and Georgia caused rivers in northern Florida to rise, with some minor flooding along the Choctawhatchee, Apalachicola, Ochlockonee, and Withlacoochee.
Appendix 1: Additional February Departures from Normal Data for Florida Locations
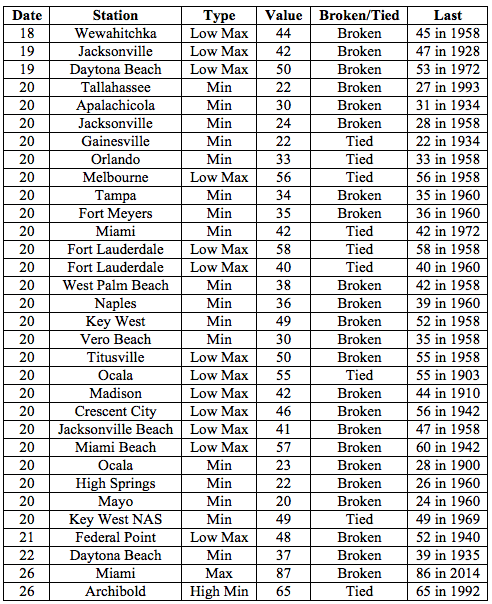
Appendix 2: Select daily maximum and minimum temperature records (o F) tied or broken during February (Compiled from NOAA, NWS)