Prepared by Melissa Griffin and David F. Zierden.
Florida Climate Center
The Florida State University
Tallahassee, FL

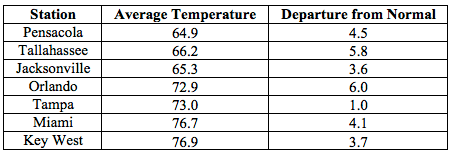
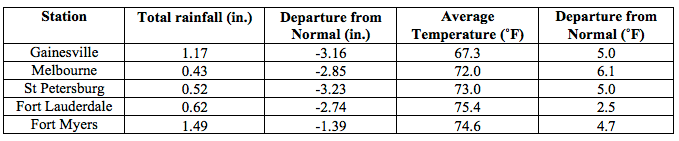
Average temperatures were well above normal across the state in March. The departures for average temperatures in March 2015 were well above normal across the entire state, with departures ranging from 1.0˚F in Tampa to 6.1˚F in Melbourne. (Table 1 and Appendix 1). Pensacola, FL reported only one day with a minimum temperature below freezing (32˚F) during March and many locations in southern Florida (such as Fort Myers, Miami, and West Palm Beach) reported at least one day with a maximum temperature at or above 90˚F. March 2015 was the 2nd warmest in Fort Myers, Miami and West Palm Beach; 3rd warmest in Orlando; 4th warmest in Ocala, Tampa and Vero Beach; and 10th warmest in Key West and Tallahassee. Multiple temperature records were tied or broken across the state in March (Appendix 2).
Table 1: March average temperatures and departures from normal (˚F) for selected cities.
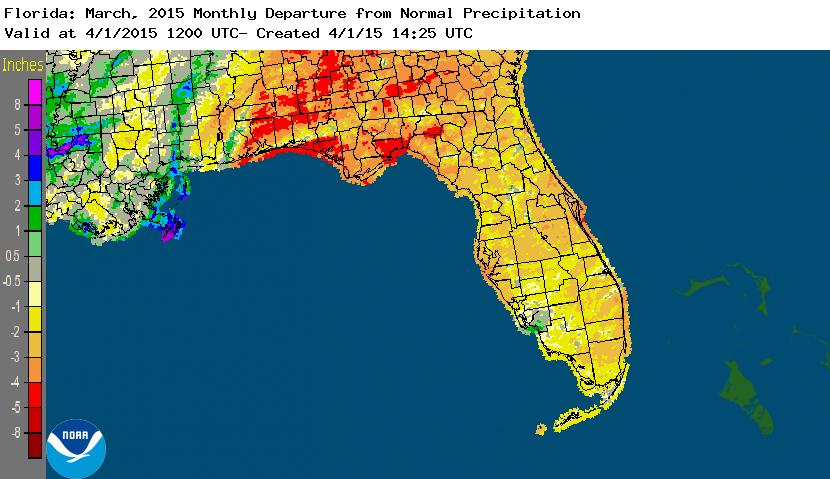
Rainfall totals were well below normal across the state in March. With the exception of Lee County, FL, the entire state had rainfall totals below normal (Figure 1). Departures from normal roughly ranged from -0.57” to -3.43” (Table 2 and Appendix 1), though localized parts of state saw rainfall totals that were as much as 5.00” below normal (Figure 1). March 2015 was the 9th driest March on record for Daytona Beach. A significant rain event took place in Walton, Okaloosa, and Washington counties on the 22nd, where some locations along the coast picked up over 5.00” of rain. Despite the fact that rainfall totals across the state were below normal, there were multiple 24-hour precipitation records broken for the month (Table 3).
Table 2: March precipitation totals and departures from normal (inches) for selected cities.
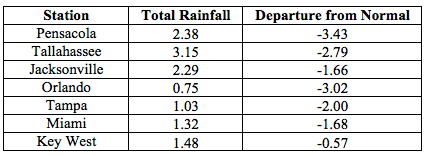
Table 3: Select daily rainfall records (inches) broken during March. (Compiled from NOAA, NWS)
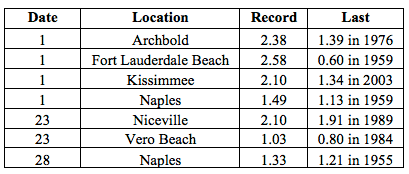
Figure 1: A graphical depiction of the monthly rainfall departure from normal (inches) for March is given in the figure below (courtesy of NOAA, NWS)
ENSO-Neutral Conditions Continue in the Pacific.
Based on current data and forecast models, the Climate Prediction Center (CPC) has downgraded the previous El Niño Watch to an El Niño Advisory. Positive sea surface temperatures (SST) anomalies have been recorded across most of the Pacific Ocean. There is still a 50% chance that El Niño conditions will continue through the summer. CPC predicts normal temperatures and above normal precipitation across the state through June 2015.
Hazardous Weather Events in March.
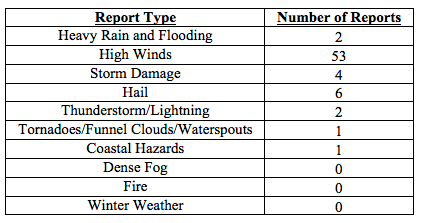
There were a total of 76 severe weather reports made in Florida during March. On the 11th, a thunderstorm produced 45 mph wind gusts that were reported in Orange Park, FL. The same line of thunderstorms also caused damage in Crescent City, FL, as reports of power outages and downed trees came from numerous points across town. A 17-year-old male lost his life on the 14th when he became trapped in a rip current in the waters at Jaycee Beach, FL. A pilot reported several waterspouts, roughly 30 miles off the coast of Palm Beach Shores, FL on the 19th. Nearly 5.00” of heavy rain fell in Portland, FL (Walton County) as part of a localized rain event that impacted portions of Walton, Okaloosa, and Washington counties on the 22nd. The following day (23rd), multiple reports of dime-sized hail were made from the Flagler Beach area. March 26th and 27th were very active severe weather days across the state as a strong cold front moved through the state. Lightning struck a tree, which smoldered and eventually caught a house on fire in Mulberry, FL on the 26th. The same day, wind gusts of 50 mph were recorded in Lake City and Fort Pierce; and storm damage (in the form of downed trees) accompanied these reports. Hail, quarter to half dollar sized, fell in the same locations, and multiple reports of a waterspout came in from Jensen Beach, FL. Thunderstorms raced through the state on the 27th, producing wind gusts of up to 60 mph in the following locations: Titusville, Orlando, Kissimmee, Naples, West Palm Beach, Fort Lauderdale, Miami, Beach, Miami, and the Keys. Quarter-sized hail was reported in Altha, FL on the 30th and a funnel cloud was seen near the Lion Country Safari in Palm Beach County on the 31st.
Table 4: Breakdown of storm reports submitted in Florida during the month of March. (Compiled from Southeast Regional Climate Center.)
Agricultural and other climate related impacts.
At the beginning of March, the cold weather and saturated soil from the rains at the end of February were evident in the Panhandle. Sub-freezing temperatures caused concern for crops in northern parts of the state. Sugarcane harvesting continued on schedule in Glades and Hendry counties, while potato planting took place in Flagler, Putnam, and St. Johns counties. Poor pasture qualities across the state, and lack of hay and winter forage, impacted livestock conditions throughout Florida, and ranchers fertilized pastures to try and revitalize them. Many of the citrus processing plants had finished early and midseason oranges and had transitioned to harvesting late-season oranges and grapefruits by the middle of the month. Corn was planted in Washington, Madison, and Suwannee counties, and preparations for cotton and peanuts began in many Panhandle counties. By the middle of March, the warmer weather and longer days boosted pasture growth in the Panhandle, and northern and central Florida. Southwest pasture conditions declined due to the dry conditions and ranchers used supplemental feed for livestock. Valencia harvest increased but weekly totals were behind last season due to low maturity levels. Most grove owners were irrigated two to three times a week and applying herbicide. Citrus trees were in full bloom by the end of the month, with petal drop and small pea-sized fruit reported on early variety trees.
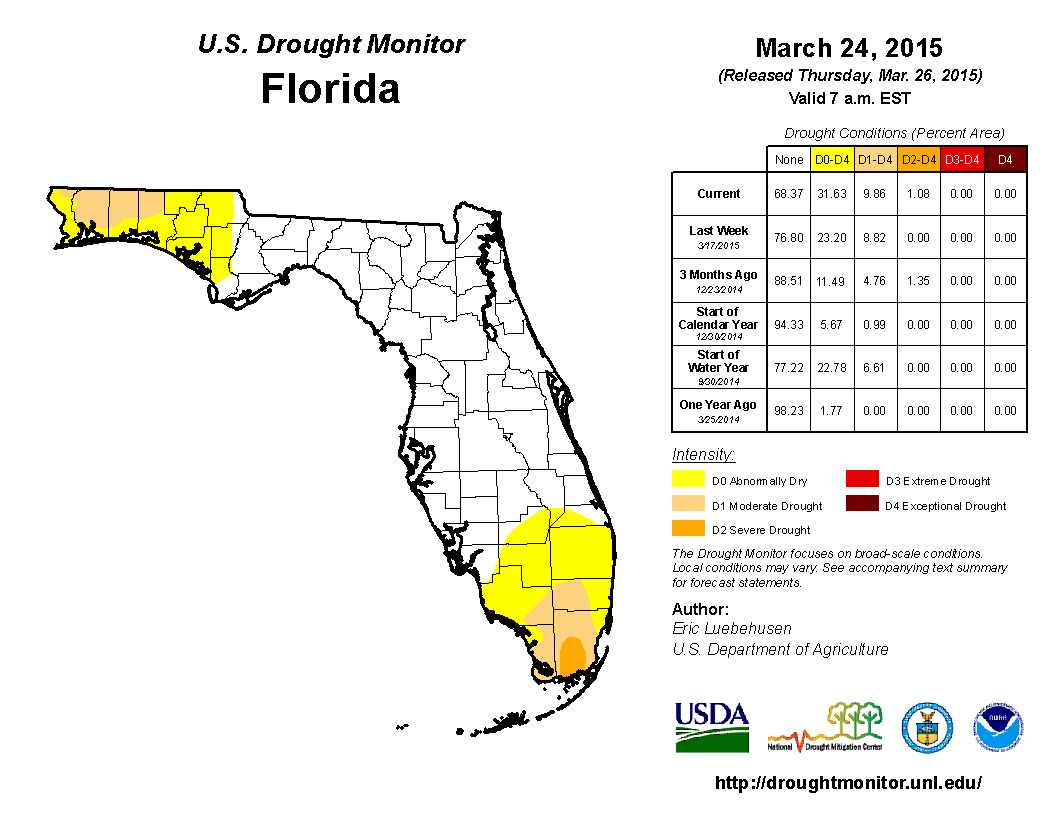
At the end of February, nearly 22% of the state was experiencing abnormally dry (D0) conditions, with the main concentration of the dryness located in the western Panhandle and southern Florida. Light widespread rainfall was seen over the Panhandle and North Florida on the 6th, while spotty shower activity was seen in South Florida from the 7th through the 9th. The rainfall over the area prompted the removal of D0 from most of Palm Beach County and portions of Collier County at the beginning of March. During the middle of the month, light and spotty rainfall was seen across the Panhandle and Peninsula, with some localized areas seeing up to 1.50” rainfall. When the drought monitor was released on the 17th, there had been an expansion of the D0 conditions in the Panhandle to include Holmes, Washington, Jackson, Bay, Gulf, and Calhoun counties. On the 23rd, a heavy band of rainfall (up to 5.00”) in coastal portions of the Panhandle counties, and on the 24th, rainfall up to 2.00” was seen in some of the Central Florida counties. By the time the last drought monitor map was released for the month, D0 had been expanded in South Florida to include Palm Beach, Glades, and Martin counties. Moderate drought conditions (D1) were also expanded within Collier and Dade counties, and severe drought conditions (D2) had been introduced into southern portions of Dade County. Based on data, roughly 3.5 million Florida citizens are currently being impacted by drought conditions that are being reported in nearly 32% of the state. At the end of the month, the water level in Lake Okeechobee had dropped to under 14 ft., mainly due to regulatory releases.
Appendix 1: Additional March Departures from Normal Data for Florida Locations
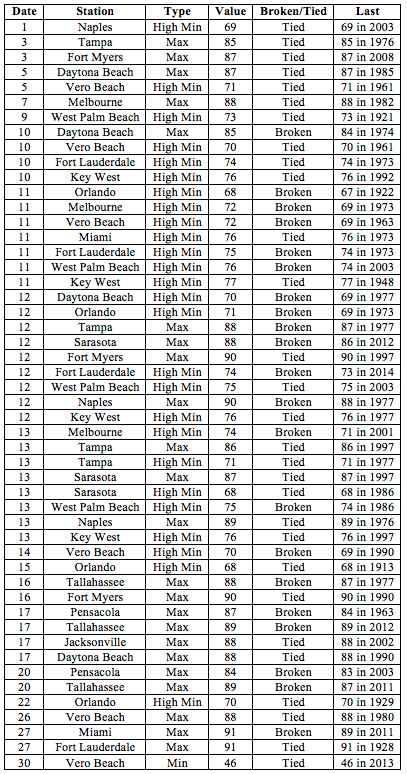
Appendix 2: Select daily maximum and minimum temperature records (o F) tied or broken during March. (Compiled from NOAA, NWS)