


The Florida Climate Center serves as the primary resource for climate data, information, and services in the state of Florida.

The Florida Climate Center achieves its mission by providing climate monitoring, research, and expertise to be applied by the people, institutions, and businesses of Florida and the surrounding region.
We provide direct service by fulfilling requests for climate and weather data and information in a variety of formats.
We perform research that advances the understanding of the climate variability and changes of Florida and the surrounding region.
We provide outreach in presentations and at events aimed at a variety of groups, interests, and ages.
Prepared by Lydia Stefanova and David F. Zierden.
Florida Climate Center
The Florida State University
Tallahassee, FL

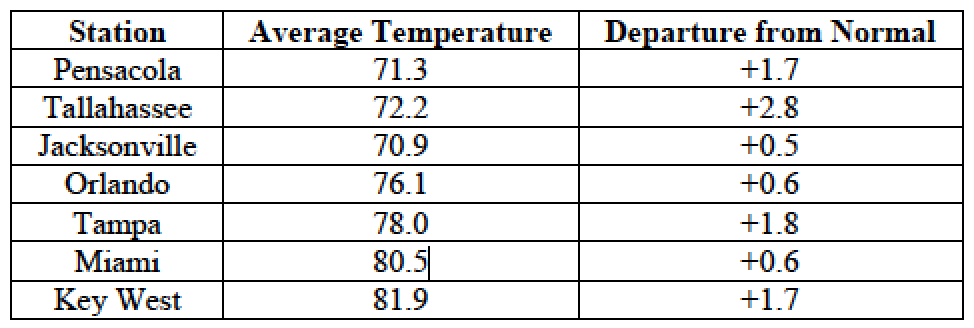
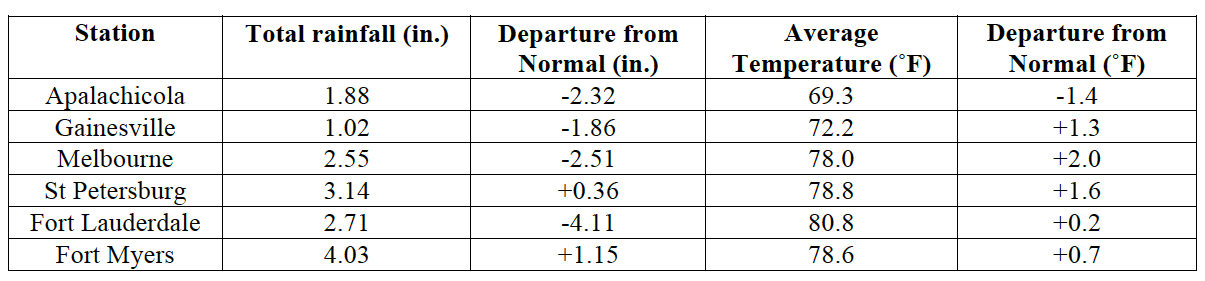
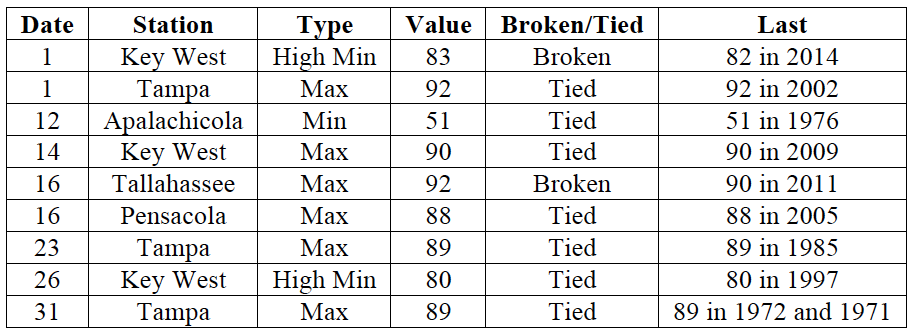
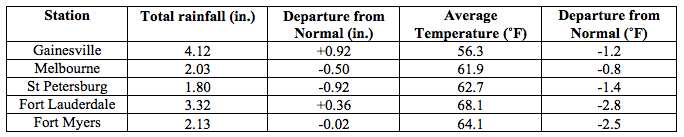
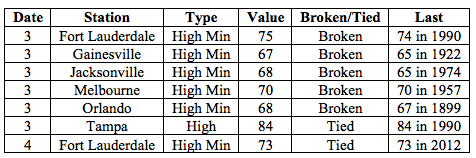
Average temperatures in October were above normal across most of the state. The departures from average temperatures in October 2015 were mostly near normal to above normal across the entire state, ranging from -1.4˚F in Apalachicola to 2.8˚F in Tallahassee (Table 1 and Appendix 1). Despite the warm monthly average temperatures, Fort Myers was the only major reporting stations to register a maximum temperature at or above 95˚F. October 2015 was the 5th warmest on record in Vero Beach, 8th warmest in Fort Lauderdale, Key West, and Tampa. Multiple maximum and minimum temperature records were tied or broken across the state in October (Appendix 2).
Table 1: October average temperatures and departures from normal (˚F) for selected cities.
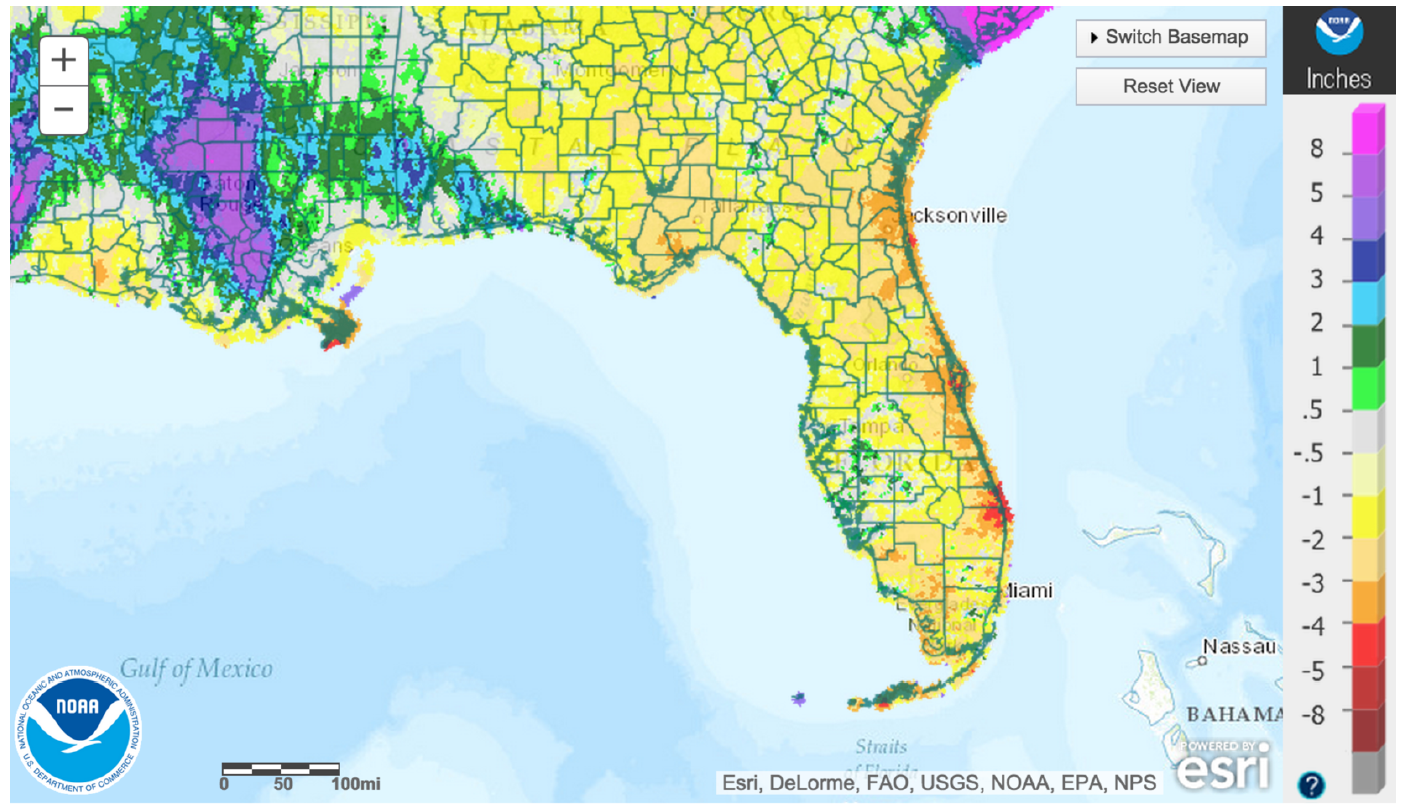
Rainfall totals were varied across the state in October.Most of the state had well below normal rainfall, although parts of the western Panhandle had above normal rainfall (Figure 1). Major reporting stations registered departures from normal ranging from -4.18” to +2.83” (Table 2 and Appendix 1), although localized parts of the state saw rainfall totals that were as much as 5” below normal to 4” above normal (Figure 1). October 2015 was the 2nd driest on record for Key West and West Palm Beach, 4th driest for Titusville, 6th driest for Jacksonville, and 10th driest for Daytona Beach. There were a small number of 24-hour precipitation records broken for the month (Table 3).
Table 2: October precipitation totals and departures from normal (inches) for select cities.
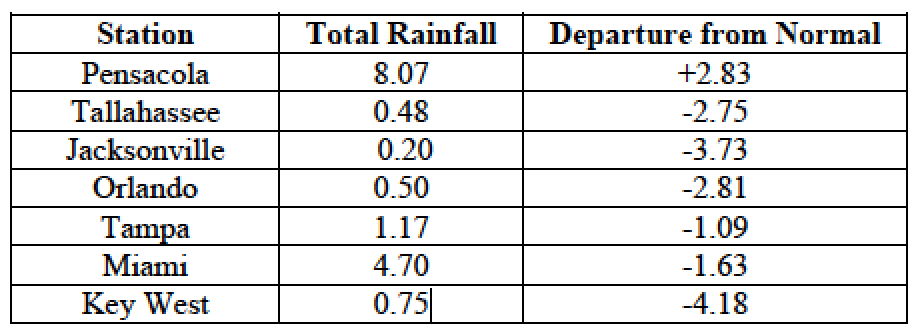
Table 3: Select daily rainfall records (inches) broken during October (compiled from NOAA, NWS).
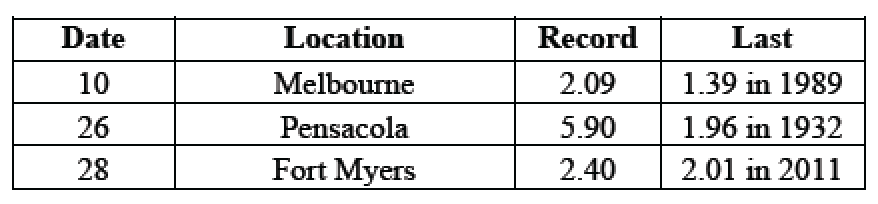
Figure 1: A graphical depiction of the monthly rainfall departure from normal (inches) for October is given in the figure below (courtesy of NOAA, NWS).
El Niño Conditions are Present in the Pacific.
Based on current data and forecast models, the Climate Prediction Center (CPC) will keep the ENSO Alert System at an El Niño Advisory. El Niño conditions are present, and positive equatorial sea surface temperatures (SST) anomalies continue across most of the Pacific Ocean. According to the CPC, there is approximately a 95% chance that El Niño conditions will continue through the Northern Hemisphere winter 2015-2016, gradually weakening through spring 2016. CPC predicts above normal temperatures and precipitation for November. This El Niño is currently very strong, on par with the landmark El Nino's of 1982/1983 and 1997/1998. Such a strong El Niño is sure to disrupt climate and weather patterns across the State throughout the winter and early spring seasons, most notably with frequent storms and rain and cooler temperatures. See this wrap-up of El Niño impacts on Florida on our website: http://climatecenter.fsu.edu/super-el-nino-poised-to-disrupt-weather-patterns.
Hazardous Weather Events in October.
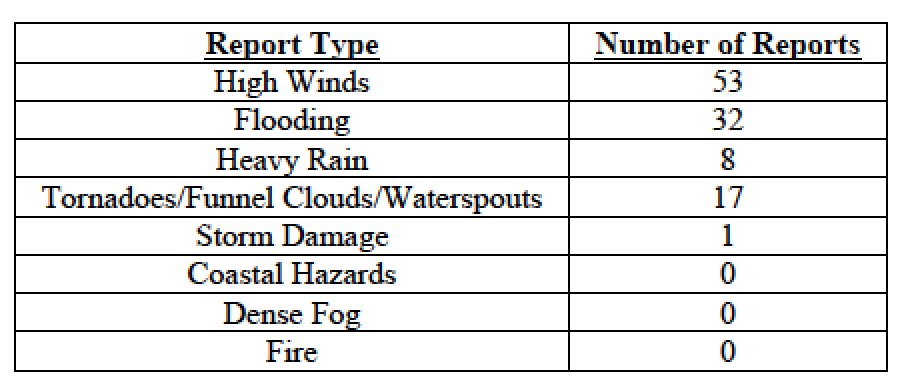
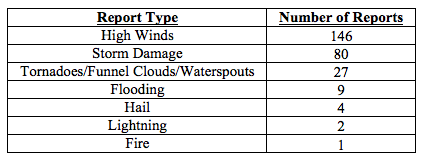
There were a total of 111 severe weather reports were made in Florida during October, the majority of which were for high winds and flooding (see Table 4). A low-pressure trough brought heavy rain and consequent flooding to portions of South Florida on October 7th. Some of the flooding resulted in street and road closures due to standing water. This was followed by unusually high tides causing widespread coastal flooding from Miami Beach to Fort Lauderdale between October 8th and 9th and again on October 25th through 28th. Coastal flooding was also reported in the area of Jacksonville and the St. Johns River on October 6th and 27th. Several waterspouts were reported between October 10th-15th in the Florida Keys and the Miami area, and three waterspout reports were filed on October 31st near Miami. On October 11th, a waterspout briefly came onshore near St. Petersburg as a F0 tornado, damaging an 18-wheeler and causing minor damage to trees and road signs, before returning over the water. Multiple instances of high winds with gusts around 40 mph were reported throughout the day on October 19th and 20th along the Florida Keys. Numerous high wind and flooding reports were associated with a frontal system sweeping across the Florida Panhandle on October 26th-27th. It brought strong onshore winds with gusts (some up to 50 mph, leading to closing of Navarre Beach Pier) along the Florida Panhandle, causing coastal flooding and power flashes and outages in and around Panama City.
Table 4: Breakdown of storm reports submitted in Florida during the month of October (Compiled from Southeast Regional Climate Center.)
Agriculture Related Impacts.
At the beginning of October, topsoil moisture levels were at mainly (78%) adequate, though some (17%) surplus values were reported across the state. By the end of the month, topsoil moisture levels were still mainly (75%) adequate, but some (19%) short values were reported. Peanut harvesting was completed at 55% by the first week of October; peanut yields and quality were very poor in Santa Rosa County due to wet conditions. Despite delays in harvesting due to rain and cloudy weather in some locations in the middle of the month, the peanut harvesting was completed at 89%, ahead of the five-year average, thanks to drier weather towards the month’s end. Cotton harvest was initially delayed in Walton County due to standing water, and some cotton had been defoliated in Washington County. Cotton harvest continued throughout the month in Jackson, Walton, and Washington counties. Haying was active in Columbia, Dixie, Pasco, Orange, Seminole, and St. Lucie Counties, with some setbacks in Orange and Seminole Counties due to wet conditions. Some farmers obtained only one cutting of hay and quality was poor due to previous rainfall. Fruit and Vegetables: Early in the month, Flagler and Putnam county farmers were behind on planting cabbage and leafy greens due to wet conditions. Drier weather in Charlotte, Collier, Glades, Hendry, and Lee counties allowed vegetable growers to catch up on planting. All crops were irrigated. Livestock and Pastures: Some pastures in Lee County had standing water while winter pastures in Jefferson County need rain. Summer and permanent pastures across the State declined seasonally. Statewide, the cattle and pasture condition was mostly good. Citrus: Conditions were favorable for citrus growers throughout the region. The citrus-growing region was seasonably warm, with lots of sunshine and little rain, but remaining drought-free through the month of October.
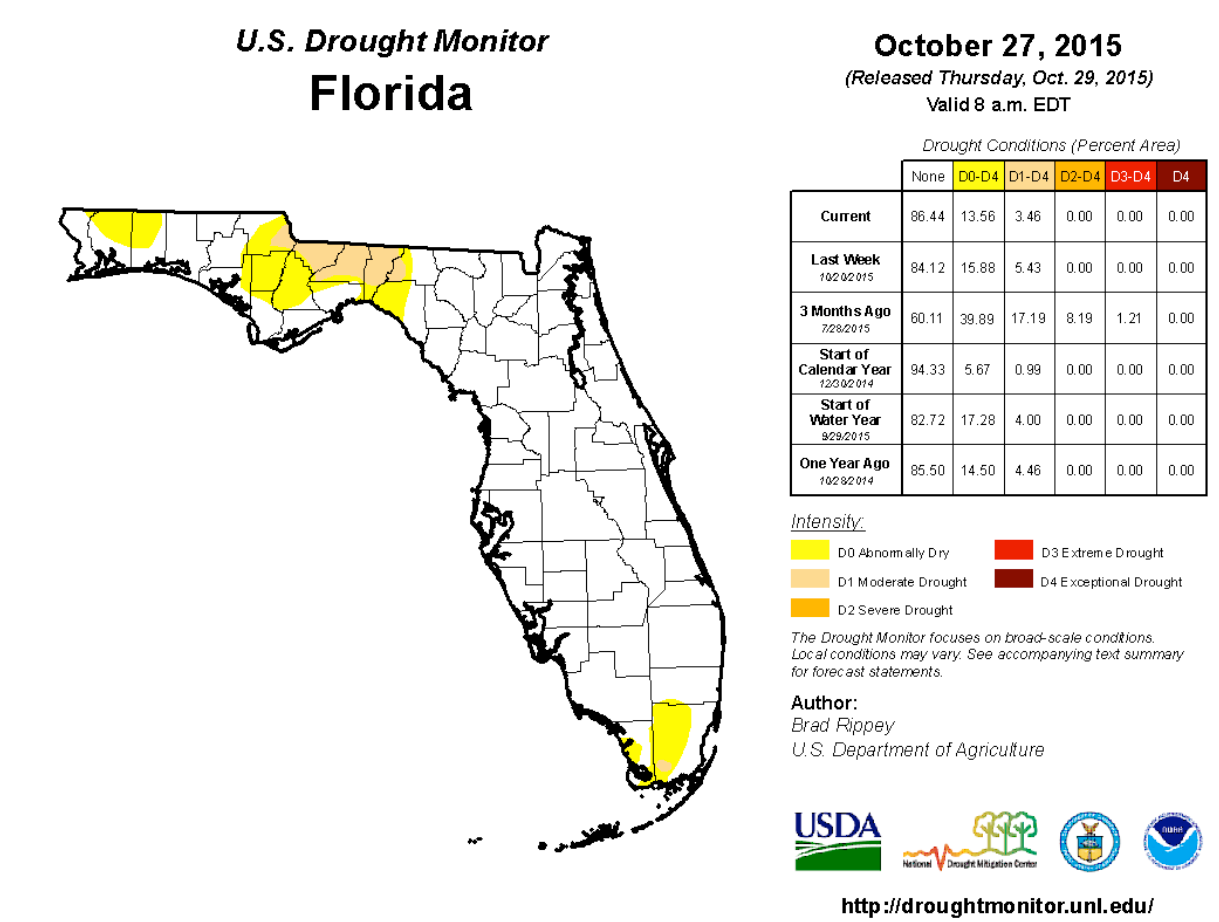
Drought Related Impacts.
At the end of September, most (83%) of the state was drought-free, while roughly 17% of the state (mainly counties along the northern portion of the Florida Panhandle and portions of Broward, Dade, Monroe, and Palm Beach counties) was experiencing abnormally dry (D0) or moderate drought (D1) conditions. D1 conditions were present in parts of Dade, Escambia, Jackson, Gadsden, Leon, Jefferson and Madison counties. The abnormally dry portions of Broward and Palm Beach County reverted to drought-free with the help of a good rain on October 17th. As October progressed, D1 conditions briefly broadened in the extreme western Panhandle, but a frontal passage over the area brought heavy rains on October 26-27 and significantly eased the drought conditions in the region. Despite the overall rain deficit for the month, roughly 86% of the state is now drought-free. Abnormally dry (D0) conditions are still present in Santa Rosa, Okaloosa, Jackson, Calhoun, Liberty, Taylor, Madison, Monroe and Dade counties. Moderate (D1) drought extends over Gadsden, Jefferson and Leon County, and in parts of Jackson and Madison County. In all, drought conditions are reported in about 14% of the state, currently affecting roughly 370 thousand Florida citizens. The water level in Lake Okeechobee at the end of the month is about 14.6 ft., slightly down from the beginning of the month.
Appendix 1: Additional October departures from normal data for Florida locations.
Appendix 2: Select daily maximum and minimum temperature records (° F) tied or broken during October (compiled from NOAA, NWS).
Prepared by Lydia Stefanova and David F. Zierden.
Florida Climate Center
The Florida State University
Tallahassee, FL
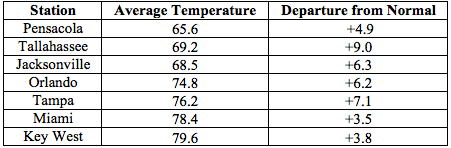
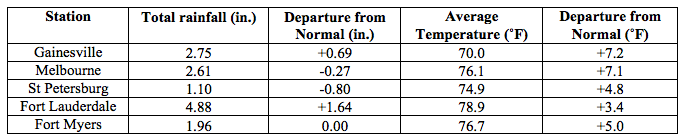
Average temperatures in November were well above normal across most of the state. The departures from average temperatures in November 2015 were well above normal across the entire state, ranging from 3.4˚F in Fort Lauderdale to 9.0˚F in Tallahassee (Table 1 and Appendix 1). Numerous maximum and high minimum temperature records were broken across the state in November, particularly in the early part of the month (Appendix 2). Maximum temperatures over 90˚F were reported in Tampa (92˚F on November 4th, 91˚F on the 5th), Fort Myers (92˚F on the 4th), Orlando (91˚F on the 2nd and 9th), and Jacksonville (91˚F on the 3rd). No minimum temperature records were tied or broken, but several minimum temperatures in the 30’s were reported: in Pensacola (35˚F on the 23rd). Tallahassee (38˚F on the 23rd, 34˚F on the 24th), Jacksonville (37˚F on the 23rd), and Gainesville (36˚F on the 23rd). Overall, November 2015 was the warmest on record for Tallahassee and 2nd warmest on record for Tampa, Orlando, Miami, West Palm Beach, and Fort Myers. For nearly all reporting stations across the state, November 2015 was amongst the top five warmest Novembers on record.
Table 1: November average temperatures and departures from normal (˚F) for selected cities.
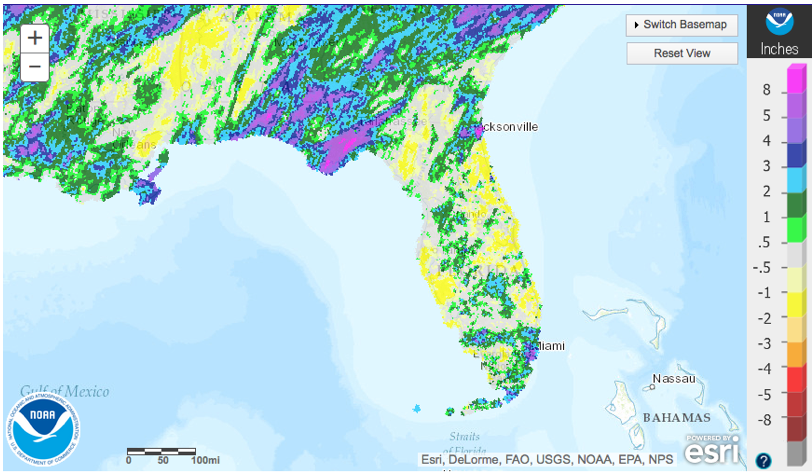
Rainfall totals were varied across the state in November. The Panhandle and portions of peninsular Florida (particularly areas near Jacksonville and Miami) had well above normal rainfall, while most of coastal peninsular Florida recorded below normal rainfall (Figure 1). Departures from normal roughly ranged from -0.80” to +4.83” (Table 2 and Appendix 1), though localized parts of the state saw rainfall totals that were as much as 2.00” below normal to more than 8.00” above normal (Figure 1). There were several 24-hour precipitation records broken for the month (Table 3).
Table 2: November precipitation totals and departures from normal (inches) for select cities.
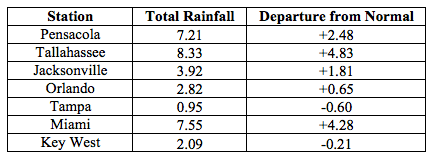
Table 3: Select daily rainfall records (inches) broken during November (compiled from NOAA, NWS).
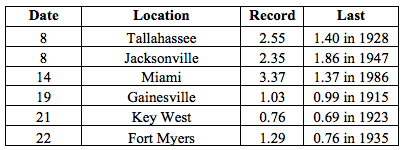
Figure 1: A graphical depiction of the monthly rainfall departure from normal (inches) for November is given in the figure below (courtesy of NOAA, NWS).
El Niño Conditions are Present in the Pacific.
Based on current data and forecast models, the Climate Prediction Center (CPC) will keep the ENSO Alert System at an El Niño Advisory. El Niño conditions are present, and positive equatorial sea surface temperatures (SST) anomalies continue across most of the Pacific Ocean. According to the CPC El Niño conditions will continue through the Northern Hemisphere winter 2015-2016, gradually weakening through spring or early summer 2016. CPC predicts above normal temperatures for most of the state, and above normal precipitation across the state for December, followed by below-normal temperatures accompanied with above-normal precipitation for the remainder of the winter season. This El Niño remains very strong, on par with the landmark El Nino's of 1982/1983 and 1997/1998. Such a strong El Niño is sure to disrupt climate and weather patterns across the State throughout the winter and early spring seasons, most notably with frequent storms and rain and cooler temperatures. See this wrap-up of El Niño impacts on Florida on our website: http://climatecenter.fsu.edu/super-el-nino-poised-to-disrupt-weather-patterns.
Hazardous Weather Events in November.
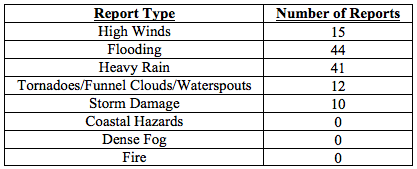
There were a total of 122 severe weather reports made in Florida during November. A stationary front over the Panhandle on November 1st and 2nd brought heavy rain, flooding, high winds and storm damage in Holmes, Jackson, Jefferson, Okaloosa, Walton, and Washington counties, and a tornado touchdown in Washington County. Flash floods associated with this front caused numerous road closures, and several instances of wind damage to structures, downed trees, and damage to power lines were reported throughout the area. A second frontal system swept over the northern portion of the state on November 8th and 9th. Over 30 reports of heavy rain and flooding came in during that period from the Panhandle’s Bay, Franklin (Apalachicola), Jackson, Holmes, Liberty, Leon, Washington, and Walton Counties, and about 20 reports of heavy rain and flooding came from Duval County. On Nov 10th two separate funnel clouds were observed in Palm Beach County, but neither touched down, and reports of five waterspouts came from the Lower Florida Keys on November 12th and 13th. On the morning of November 15th multiple reports of heavy rains were made throughout Miami area. Strong winds associated with a passing front were reported on November 18th in Okaloosa and Franklin Counties. Several reports of downed trees and minor damage came in from Okaloosa, Wakulla and Gadsden on that day, and two tornadoes were spotted in Walton County in the early afternoon. Tidal flooding was reported November 25th in Delray Beach from locations in Palm Beach and Miami-Dade and November 26th in Broward County.
Table 4: Breakdown of storm reports submitted in Florida during the month of November (Compiled from Southeast Regional Climate Center.)
Agriculture Related Impacts.
At the beginning of November, topsoil moisture levels were at predominantly (73%) adequate, though some (18% ) short and a few (8%) surplus values were reported across the state. Heavy rains at the end of October and in early November in Escambia, Holmes, Jackson, Jefferson, Okaloosa, Washington, and Walton delayed harvesting and planting of field crops for much of the month. At the beginning of the month, peanut harvesting had been completed at 94%, ahead of the 5-year average. By the end of the month, the completion was at 98%, behind the 5-year average. The rain in the Panhandle Counties hurt peanut quality. The heavy rains also negatively affected cotton harvest and quality. The combination of rainy and warm conditions in Jackson County caused cotton plants to put out new leaves, delaying the harvest, and some cotton to sprout in the boll in Jefferson County. In Escambia county cotton bales were sitting in ponding water. Soybean harvest was also delayed due to wet conditions. Hay cutting is underway in Orange and Seminole counties, but the quality is poor. Fruit and vegetable crops were irrigated throughout the month. Unseasonably warm weather in the early part of November caused blueberries in Bradford County to flower and produce fruit. Unseasonably warm weather throughout most of the month in southwest Florida caused sunburn on harvested fruit and loss of transplants, along with reduced yields and size of crops being harvested. Windy conditions in Palm Beach County resulted in scaring of tender vegetables such as peppers, eggplant, and tomatoes and twisting off of young seedlings. Livestock and pastures: permanent pastures across the State continued to decline seasonally. Statewide, the cattle condition was mostly good and pasture condition was fair to good. Winter forage benefitted from rains. The citrus growing regions were seeing unseasonably warm temperatures for most of the month, and groves in in the eastern edge of Orange County, nearly all of Osceola County, and the Indian River District were experiencing abnormally dry conditions and required irrigation. Growers have been spraying in attempts to lower the psyllid population to combat citrus greening. Harvest for the fresh market is well underway, with a few processing plants now open to process eliminations.
Drought Related Impacts.
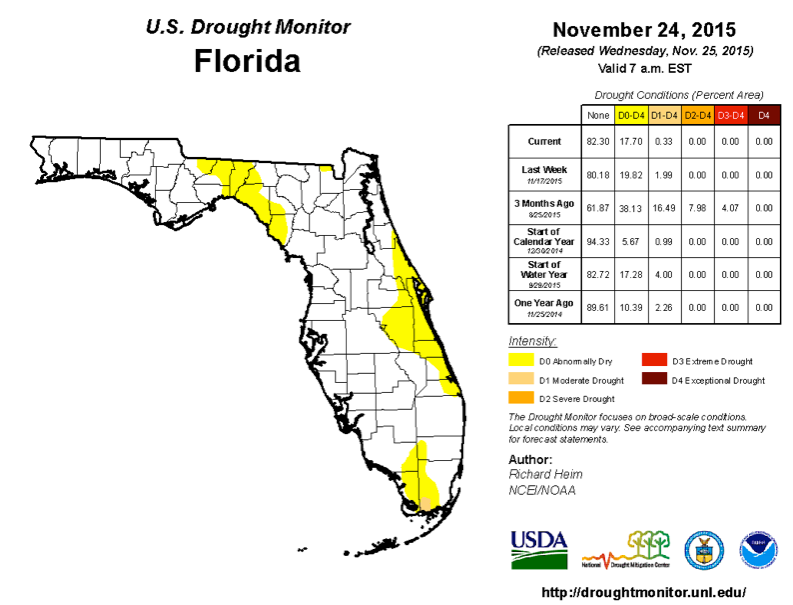
At the end of October, about 10% of the state was experiencing abnormally dry (D0) conditions, and 3.5% of the state was experiencing moderate drought (D1), with most of the D1 conditions limited to portions of Jackson, Gadsden, Leon, and Jefferson counties. Rains in the first two days of the month reduced the drought in the western Panhandle. By November 3d the surface area affected by moderate drought was reduced in size, but the abnormally dry conditions temporarily expanded over the Big Bend region. Abnormally dry conditions were established along the east coast, affecting the entire Brevard and Indian River Counties, and portions of Martin, St Lucie, Osceola, Orange, Seminole, and Volusia Counties. Some expansion of abnormally dry conditions was also seen in Monroe, Collier and Miami-Dade Counties. By mid-month, heavy rains along the Panhandle further reduced the extent of moderate drought conditions, and eased the abnormally dry conditions in much of the Big Bend region that had appeared in the prior week. As of November 24th, moderate drought conditions are eliminated from the Panhandle, and remain only in the extreme southwest part of Miami-Dade County. Based on census data, roughly 227 thousand Florida citizens are currently being impacted by drought conditions, with roughly 17 % of the state experiencing abnormally dry conditions, and less than 0.5% - moderate drought. At the end of the month the water level in Lake Okeechobee was at 14.5 ft.
Appendix 1: Additional November departures from normal data for Florida locations.
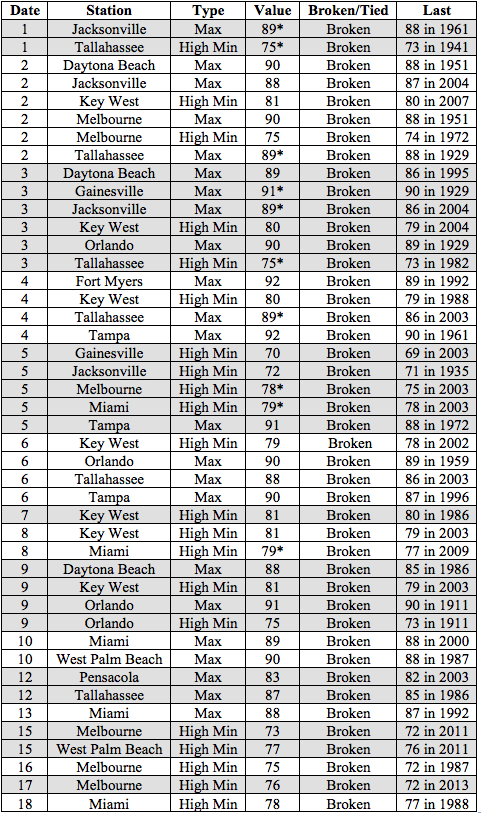
Appendix 2: Select daily maximum and minimum temperature records (° F) broken during November (compiled from NOAA, NWS). An asterisk indicates a new temperature record for the entire month of November
Prepared by Lydia Stefanova and David F. Zierden.
Florida Climate Center
The Florida State University
Tallahassee, FL
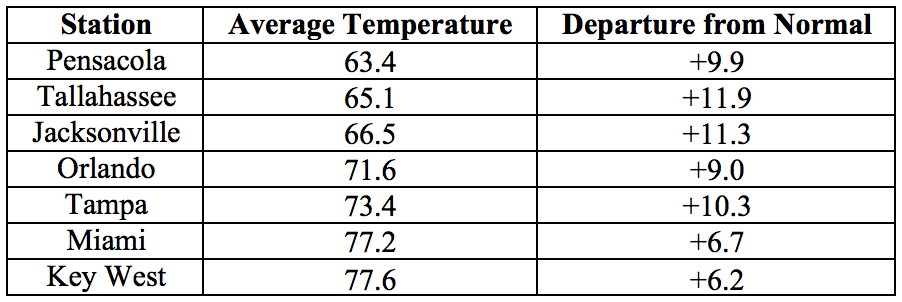
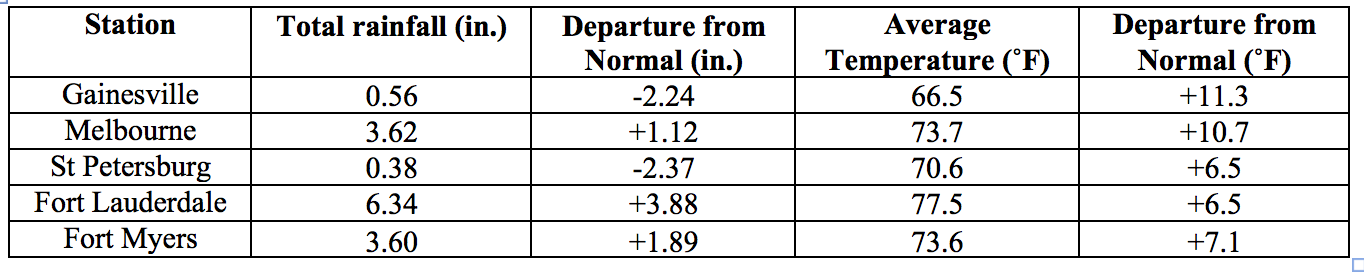
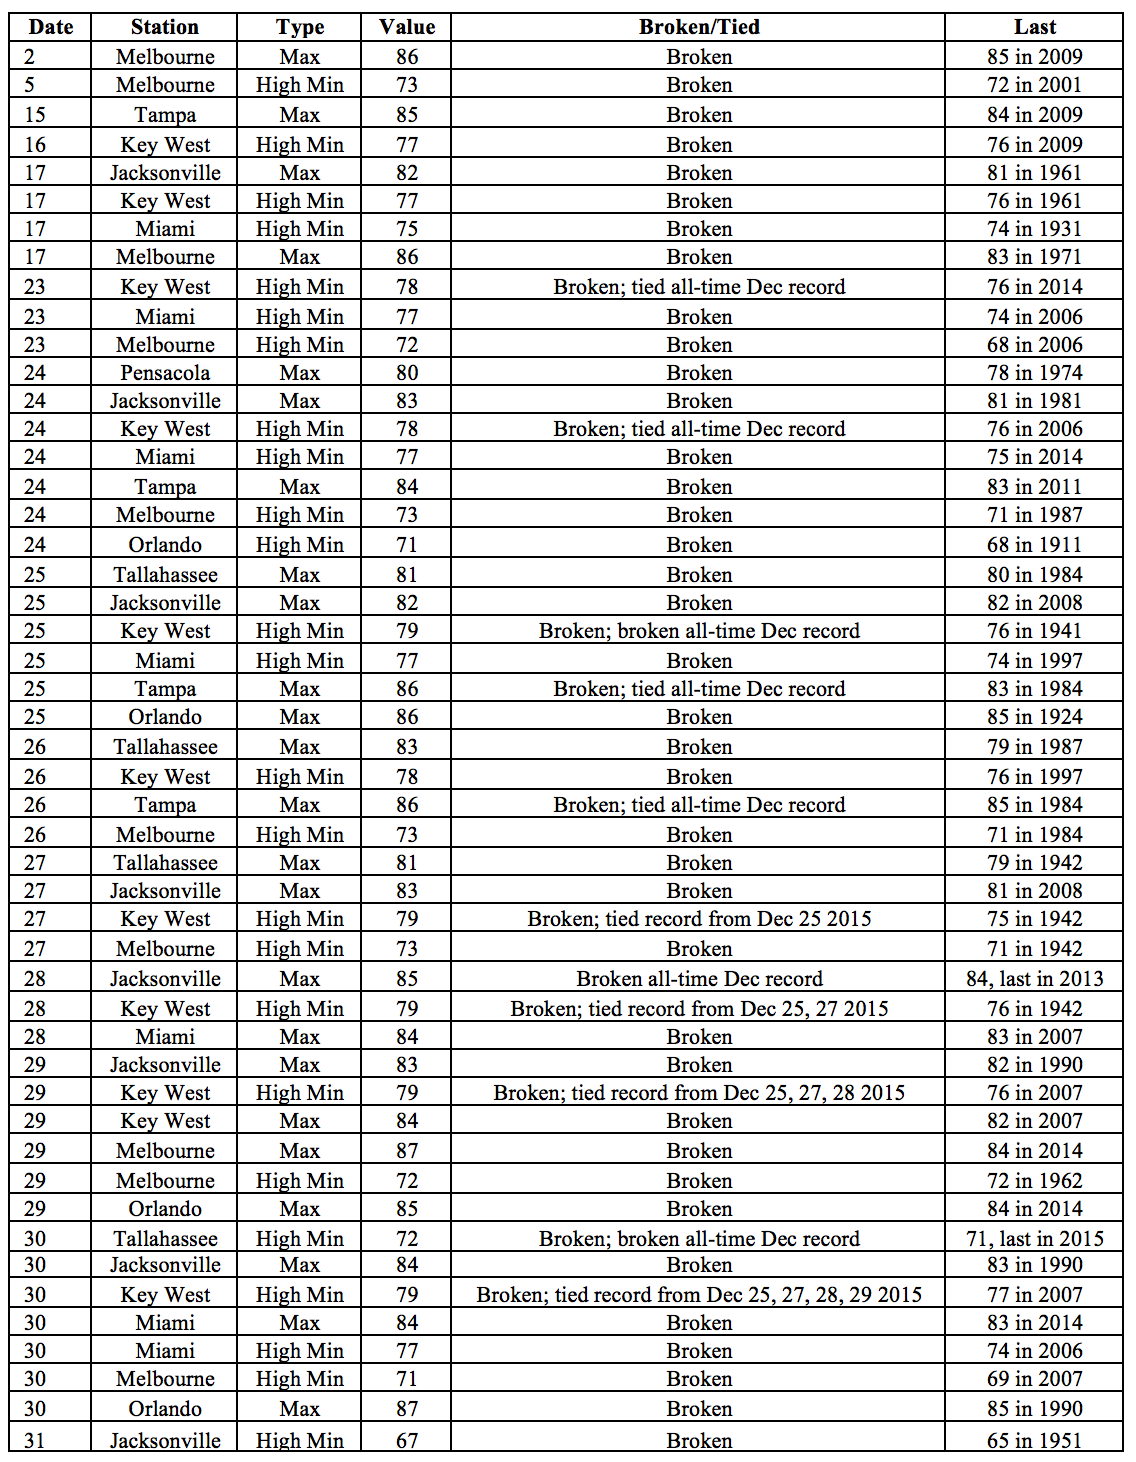
Average temperatures in December were well above normal across the state.The departures from average temperatures in December 2015 were well above normal across the entire state, ranging from +6.2˚F in Key West to +11.9˚F in Tallahassee (Table 1 and Appendix 1). This was the warmest December on record for the majority of long-term reporting stations throughout the state. Numerous maximum and high minimum temperature records were tied or broken across the state in December 2015, including several all-time records for the month of December (Appendix 2).
Table 1: December average temperatures and departures from normal (˚F) for selected cities.
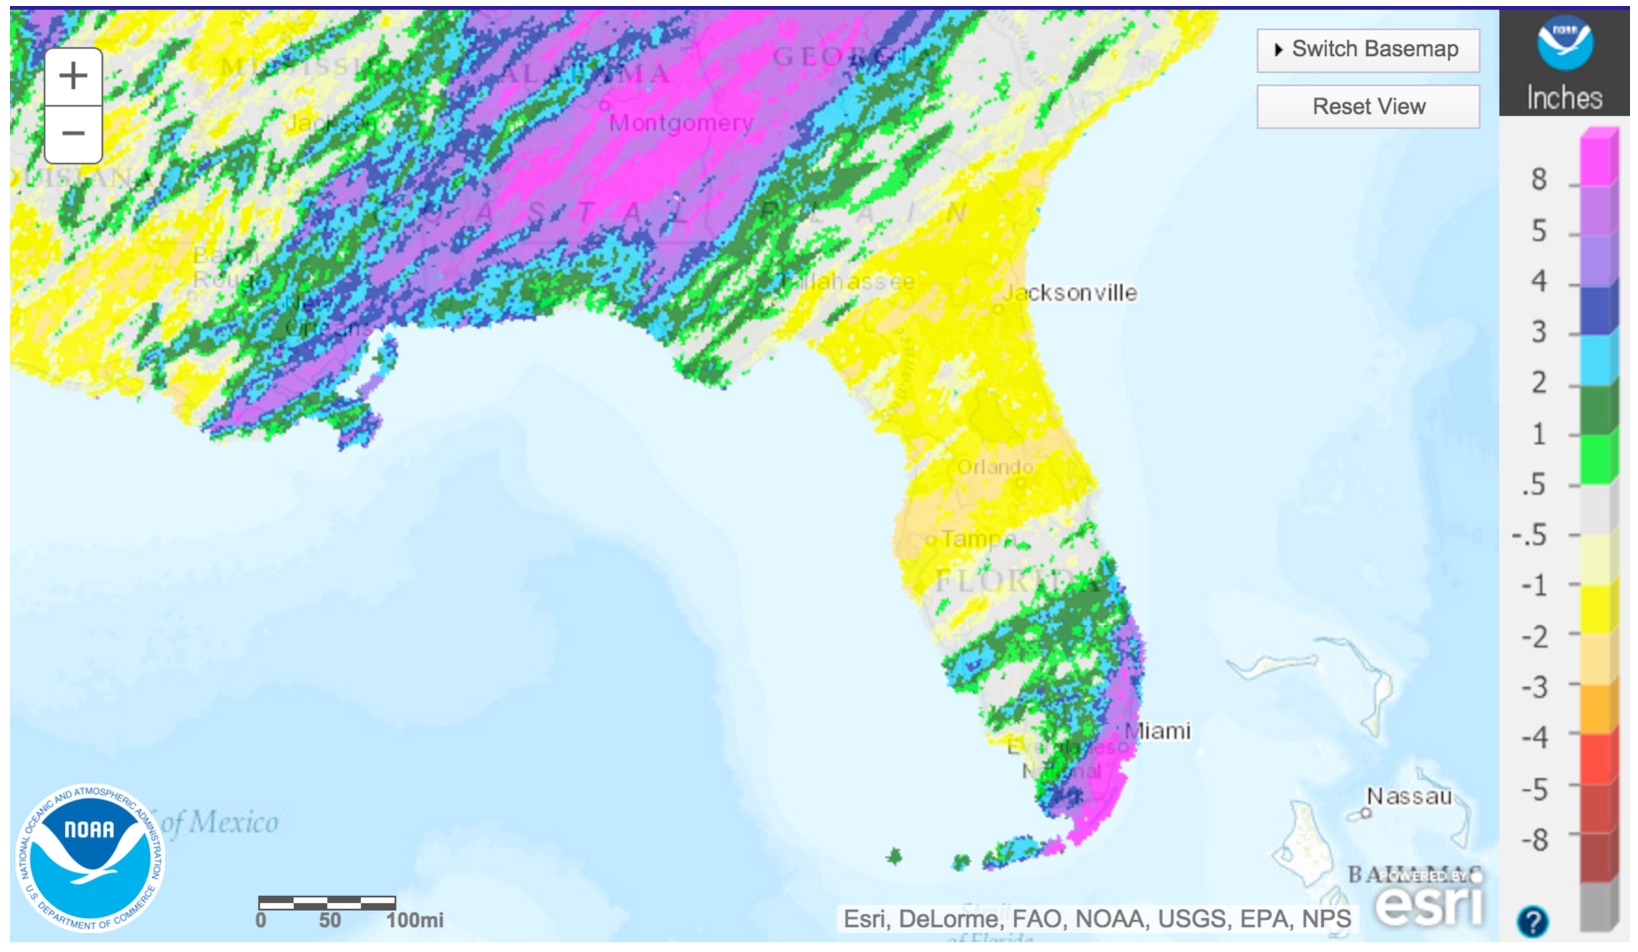
Rainfall totals were varied across the state in December. Rainfall totals for the month were above normal in the Panhandle and South Florida, and below normal in the northern peninsular portion of the state (Figure 1). Major reporting stations registered departures from normal ranging from -2.37” to +7.78” (Table 2 and Appendix 1), although localized parts of the state saw rainfall totals that were as much as 3” below normal to more than 8” above normal (Figure 1). December 2015 was the wettest on record for Miami. There were a small number of 24-hour precipitation records broken for the month (Table 3).
Table 2: December precipitation totals and departures from normal (inches) for select cities.
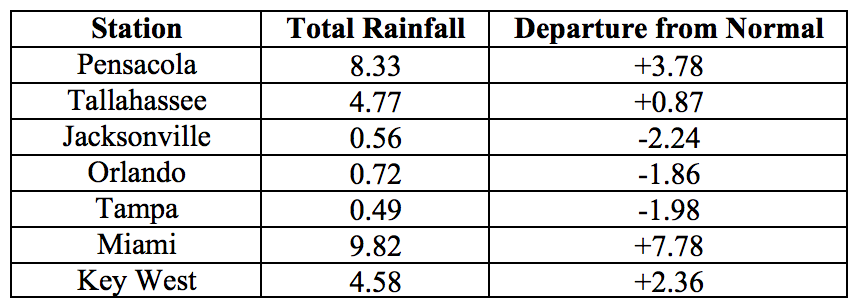
Table 3: Select daily rainfall records (inches) broken during December (compiled from NOAA, NWS).
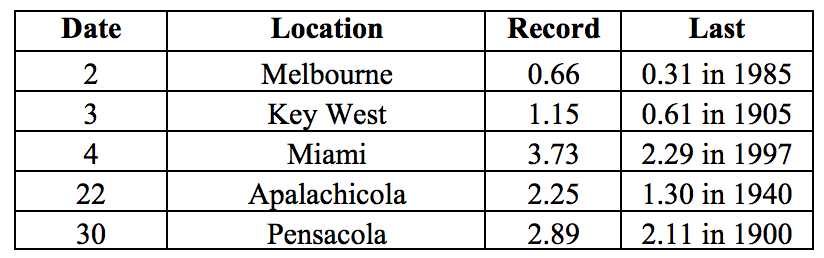
Figure 1: A graphical depiction of the monthly rainfall departure from normal (inches) for December is given in the figure below (courtesy of NOAA, NWS).
El Niño Conditions are Present in the Pacific.
Based on current data and forecast models, the Climate Prediction Center (CPC) will keep the ENSO Alert System at an El Niño Advisory. El Niño conditions are present, and positive equatorial sea surface temperatures (SST) anomalies continue across most of the Pacific Ocean. Over the past month, sea surface temperatures have also been above average across most of the Atlantic Ocean and the Gulf of Mexico. El Niño is expected to remain strong throughout this winter, with a transition to neutral conditions anticipated during spring or early summer of 2016. The CPC is predicting a strong probability of above-normal rainfall for the entire state and a moderate probability of below-normal temperatures for the northern part of the state through March 2016
Hazardous Weather Events in November.
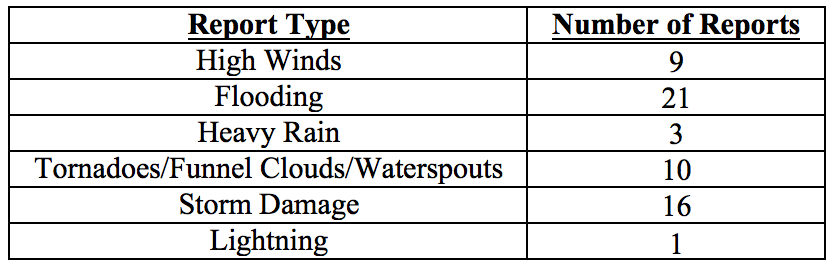
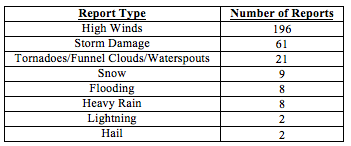
There were a total of 60 severe weather reports made in Florida during December 2015. Most of these were related to flooding (21 reports) and storm damage (16 reports). A cold front passage between December 4th and 5th gave rise to heavy rain and numerous flooding reports from the Miami area, with several street closures in the region. Some areas had water deep enough to stall vehicles. This weather system also brought heavy wind reports (gusts exceeding 40 mph) along the Florida Keys. Waterspouts and a funnel cloud were spotted near Flamingo Key and Key Largo on December 11. Thunderstorms along a low-pressure trough along the Panhandle brought in a series of reports of high winds and storm damage on December 22, including blown-down trees and power outages from wind and lightning. A strong cold front swept through the same area between December 28th and 30th, with wide spread storm damage reports (downed trees and power lines) in and around Pensacola, and reports of flooding on the Apalachicola River. This system also spawned a tornado in Santa Rosa County that was confirmed by radar.
Table 4: Breakdown of storm reports submitted in Florida during the month of December (Compiled from Southeast Regional Climate Center.)
Agriculture Related Impacts.
At the beginning of December, topsoil levels were at mainly (79%) adequate, although some (14%) short values and a few (7%) surplus levels were reported across the state. By the end of the month, the area covered by adequate levels was slightly decreased (to 77%), and a slight increase (to 17%) of short soil moisture extent was reported.The lack of rain in the first few weeks of December allowed farmers in the Panhandle counties to continue cotton and peanut harvesting, although some cotton fields in Washington county remained too wet to harvest. By the third week, peanut harvesting completion rate was at 100%, slightly ahead of last year, and matching the five-year average. Cotton harvesting is nearing completion in Jackson and Walton counties. Sugar cane harvesting continues in Hendry, Glades, Palm Beach, Broward, and St. Lucie counties with no noted delays. Rains received on sugarcane fields are being managed with lateral canals and raised beds. The cold front in the first week of December with rain and winds battered sensitive vegetable crops. Farmers in Palm Beach County planted vegetable crops on raised beds and used lateral canal systems to help minimize damage from standing water after the rains. Bacteria soft rot on tomatoes and peppers and Rhizoctonia root rot on beans was evident due to warm and humid conditions. Miami-Dade County farmers reported 50 percent of vegetable crops in the ground were flooded, damaged, or totally lost due to heavy rainfall in the first part of December. As the month continued, warm and wet weather conditions in Charlotte, Collier, Glades, Hendry, and Lee counties lowered vegetable yields and quality. Warm conditions accelerated maturity in vegetable crops, and at the same time negatively affected yields and quality. Cattle and pasture condition ratings are mainly good – rains have kept pastures green and growing, although plant diseases are more prevalent than usual for this time of the year. Most of the citrus growing region is drought free, with only the eastern edge of Orange and Volusia County, most of Osceola County, and Brevard County experiencing abnormally dry conditions. Growers were irrigating as needed and spraying for psyllids. Mowing was being reduced to an as needed basis, mostly before harvest.
Drought Related Impacts.
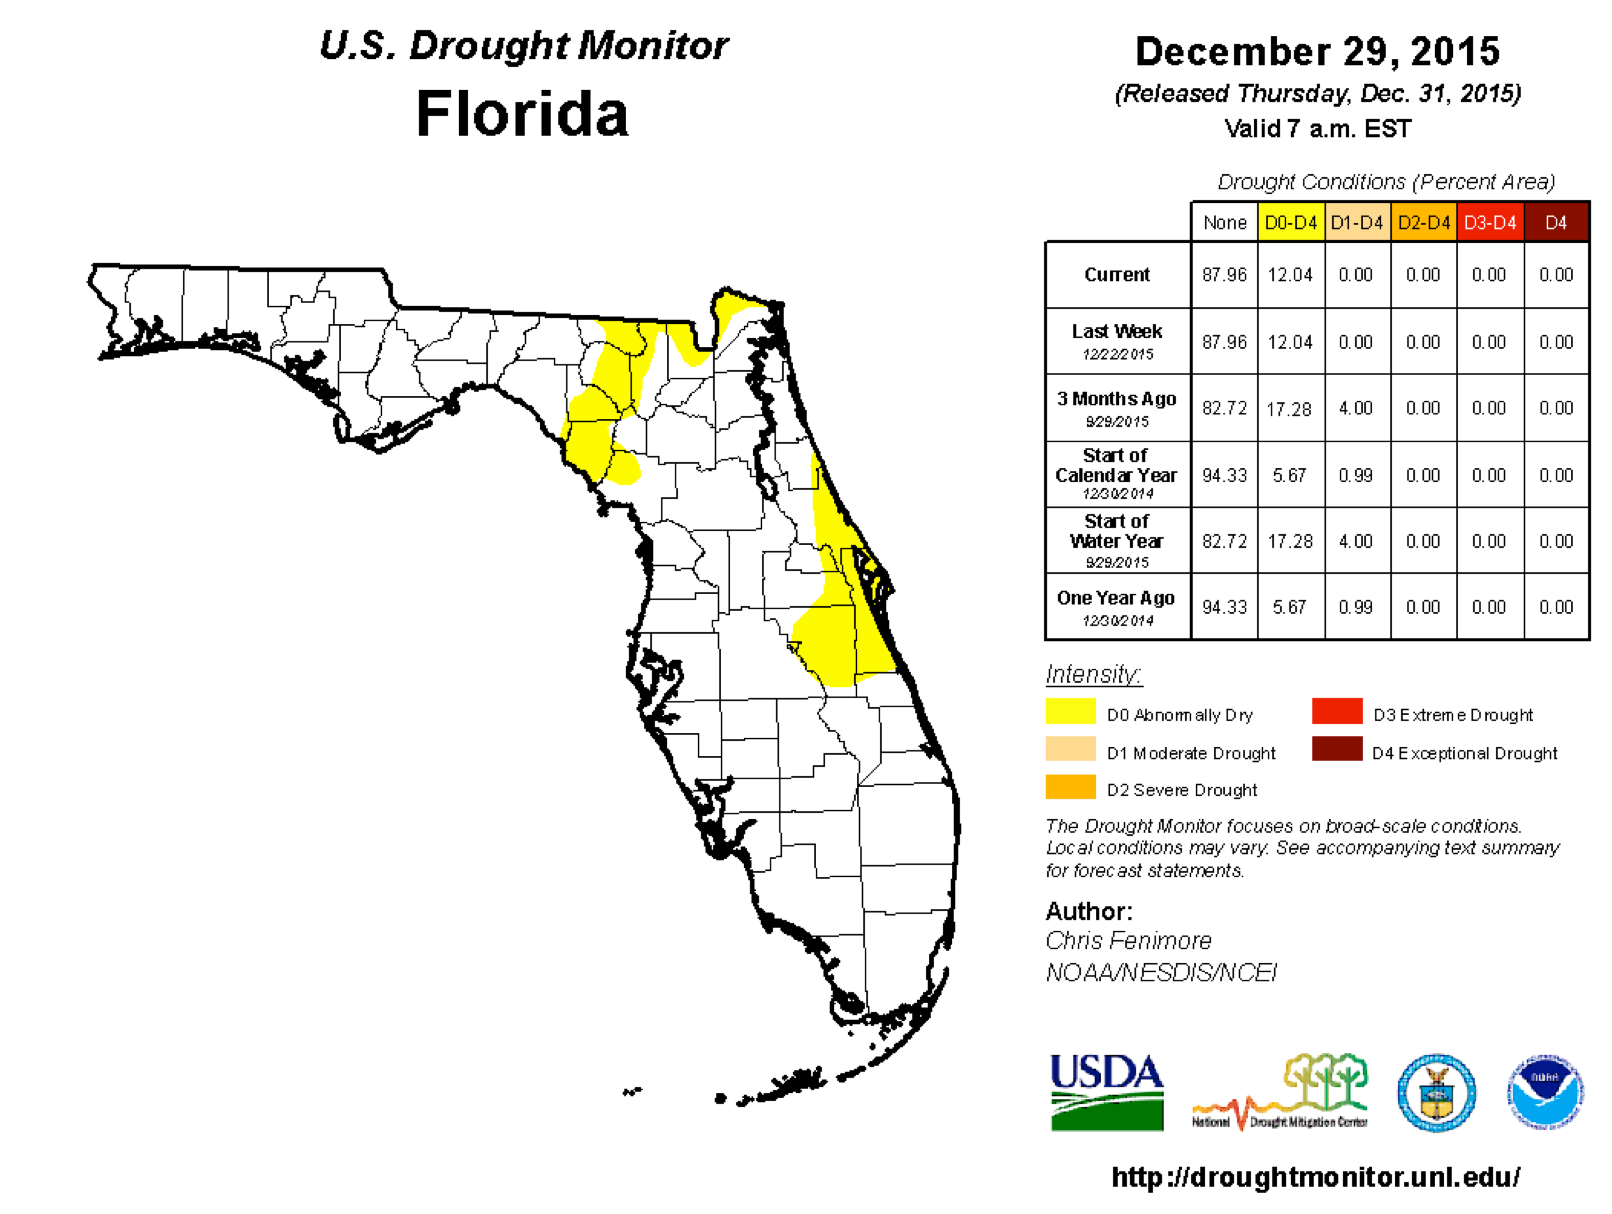
At the beginning of December, approximately 83% of the state was drought free, with the remainder of the state experiencing abnormally dry (D0) conditions, with a very small pocket of moderate drought (D1) conditions in Miami-Dade County. Rains in the first week of December eliminated the D1 conditions and shrank the D0 area to less then 8%. D0 conditions persisted throughout the month in Dixie, Osceola, Brevard, Volusia, and parts of Lafayette, Baker, Nassau, Seminole and Orange Counties. D0 conditions appeared after the second week of December in Suwannee, and parts of Columbia and Hamilton Counties, and remained in place for the remainder of the month. By the end of December, 88% of the state is drought-free, and the remaining 12% are experiencing abnormally dry conditions. The water level in Lake Okeechobee at the end of the month is about 14.76 ft., slightly up from the beginning of the month.
Appendix 1: Additional December departures from normal data for Florida locations.
Appendix 2: Select daily maximum and minimum temperature records (° F) broken during December (compiled from NOAA, NWS).
Prepared by Lydia Stefanova and David F. Zierden.
Florida Climate Center
The Florida State University
Tallahassee, FL
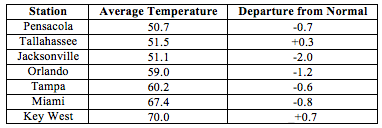
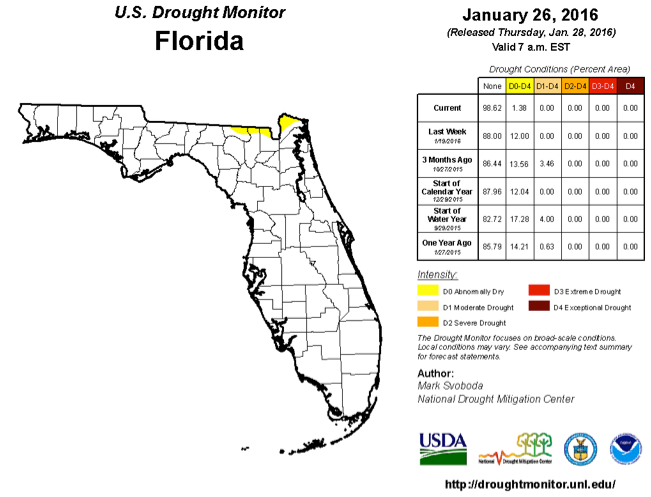
Average temperatures in January were slightly below normal across most of the state.After the record-breaking warm December, temperatures have returned close to the seasonal normal. The departures from average temperatures in January 2016 were mostly near normal to below normal across the entire state, ranging from -2.0˚F in Jacksonville to +0.7˚F in Key West (Table 1 and Appendix 1). Few maximum and minimum temperature records were tied or broken across the state in January (Appendix 2).
Table 1: January average temperatures and departures from normal (˚F) for selected cities.
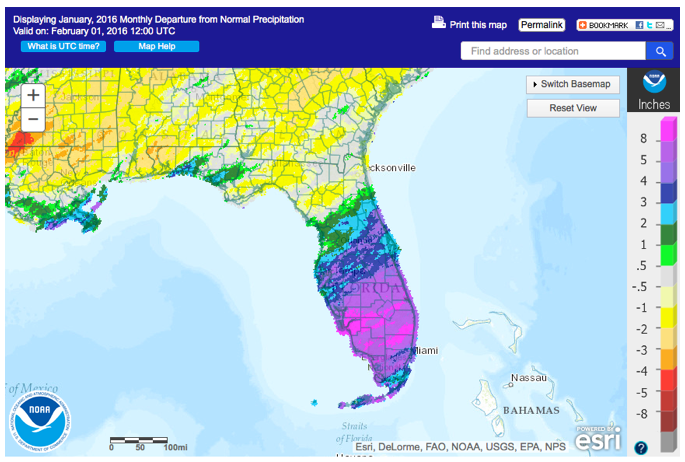
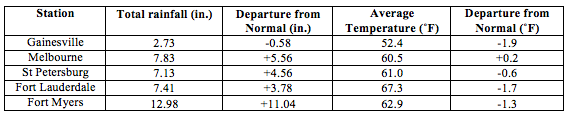
Rainfall totals in January were above normal for most of the state. . Most of the state – particularly the Florida Peninsula – had well above normal rainfall, and parts of North Florida had slightly below normal rainfall (Figure 1). Major reporting stations registered departures from normal ranging from -0.69” to +11.04” at Fort Myers (Table 2 and Appendix 1), and localized parts of western Panhandle saw rainfall totals that were as much as 4” below normal (Figure 1). January 2016 was the wettest January on record in Ft Myers, Miami, Melbourne and Vero Beach. There were a number of 24-hour precipitation records broken for the month (Table 3).
Table 2: January precipitation totals and departures from normal (inches) for select cities.
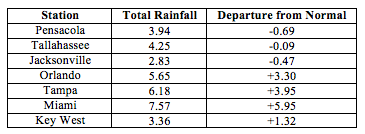
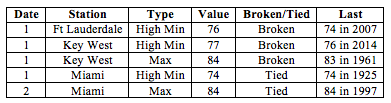
Table 3: Select daily rainfall records (inches) broken during January (compiled from NOAA, NWS).
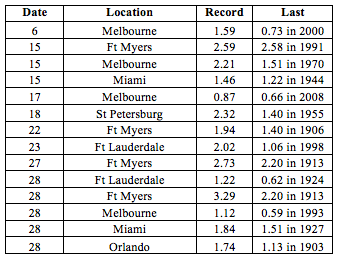
Figure 1: A graphical depiction of the monthly rainfall departure from normal (inches) for January is given in the figure below (courtesy of NOAA, NWS).
El Niño Conditions are Present in the Pacific.
Based on current data and forecast models, the Climate Prediction Center (CPC) will keep the ENSO Alert System at an El Niño Advisory. El Niño conditions remain present, and positive equatorial sea surface temperatures (SST) anomalies continue across most of the Pacific Ocean. This strong El Niño is expected to gradually weaken through spring 2016 and transition to neutral during late spring or early summer 2016. CPC predicts slightly below normal temperatures and above normal precipitation across the state for February to April 2016.
Hazardous Weather Events in January.
There were a total of 307 severe weather reports made in Florida during January. Over half of these came from just two days, January 15th and 17th. Moist warm air from the Gulf of Mexico and a cold front sweeping through the state created strong instability over the region, resulting in widespread thunderstorms with heavy precipitation, high winds, and even several tornadoes. Widespread storm damage from this system including downed trees and power lines was reported from the Panhandle to South Florida. An EF2 tornado in Manatee County on the 17th was responsible for two fatalities and several injuries; several other tornadoes were confirmed in South Central Florida damaging multiple homes. A tornado striking a beach community in Sarasota left nearly 17000 residents without power. Earlier in the month, on January 9th, another powerful tornado – with peak winds of 132 mph – near Cape Coral caused minor injuries, damaged nearly 180 homes and brought down power lines. Several more tornadoes, funnel clouds and waterspouts were spotted during this month. The high number of such events is consistent with the strong El Niño present in the Pacific. The next major cluster of hazardous weather events was observed on January 22-23. Snow flurries were reported from Gainesville to Jacksonville. High winds and were seen from Pensacola to the Florida Key, with storm damage to buildings, trees and power lines reported mostly in the Panhandle and along the Atlantic Coast.
Table 4: Breakdown of storm reports submitted in Florida during the month of January (Compiled from Southeast Regional Climate Center.)
Agriculture Related Impacts.
At the beginning of January, most (88%) of the state reported adequate topsoil levels; some surplus (8%) and short (11%) values were reported as well. Due to the heavy rains, by the end of the month the surplus values increased in coverage to 27%, and the extent of adequate topsoil levels went down to 68%. Wet fields delayed completion of harvesting of some cotton, peanut and soybean fields. Pasture conditions in the southeast were mostly poor due to standing water from heavy rains. Cool season forage (clover and ryegrass) was a failure in Flagler and Dixie counties. By the end of the month, 19% of Florida’s pastures are classified as poor or very poor, however the majority are in a good (42%) or fair (35%) condition. The condition of cattle across the state is mostly (64%) good or fair (23%). The heavy rains have exacerbated some vegetable disease conditions and disrupted planning and harvesting activities for fruit and vegetables. High winds have also been a problem for crops, causing lodging and damage. Low volumes coming to market have led to higher prices of many vegetable crops
Drought Related Impacts.
At the end of December, Florida was 88% drought-free. Thanks to abundant rainfall, by the end of the month almost 99% of the state is drought-free. Lake Okeechobee levels are very high (16.14’’) following the exceptionally heavy rainfall in South Florida, which also required back-pumping of water into the lake to provide flood protection to surrounding areas.
Appendix 1: Additional January departures from normal data for Florida locations.
Appendix 2: Select daily maximum and minimum temperature records (° F) broken during January (compiled from NOAA, NWS).
Prepared by Lydia Stefanova and David F. Zierden.
Florida Climate Center
The Florida State University
Tallahassee, FL
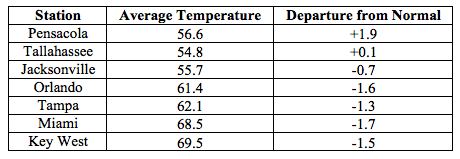
Average temperatures in February were mostly below normal across most of the state in February. Average temperatures in February 2016 were mostly below normal across the entire state with the exception of the western Panhandle. The departure from normal temperatures ranged from -2.8˚F in Ft Lauderdale to +1.9˚F in Pensacola (Table 1 and Appendix 1). Most inland stations north of Orlando saw between two and five instances of overnight temperatures dipping below freezing. A small number of temperature records, mostly high minimum, were tied or broken early in the month (Appendix 2).
Table 1: February average temperatures and departures from normal (˚F) for selected cities.
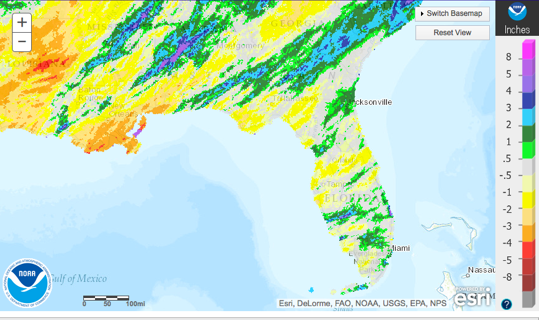
Rainfall totals in February were varied across the state. Rainfall amounts around the state were varied (Figure 1). Major reporting stations registered departures from normal ranging from -0.9” in St Petersburg to +2.23” at Key West (Table 2 and Appendix 1), although localized parts of the state saw rainfall totals that were as much as 3” below normal to 8” above normal (Figure 1). There were very few 24-hour precipitation records broken for the month (Table 3). As a whole, the winter season (December 2015 through February 2016) was the wettest on record for Fort Myers, Miami, and Vero Beach, and among the top three wettest on record for most South Florida stations.
Table 2: February precipitation totals and departures from normal (inches) for select cities.
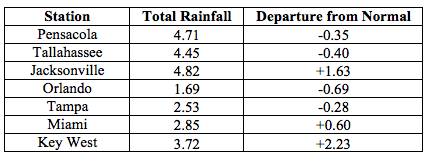
Table 3: Select daily rainfall records (inches) broken during February (compiled from NOAA, NWS).
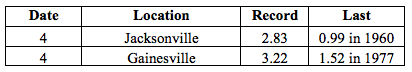
Figure 1: A graphical depiction of the monthly rainfall departure from normal (inches) for February is given in the figure below (courtesy of NOAA, NWS).
El Niño Conditions are Present in the Pacific.
Based on current data and forecast models, the Climate Prediction Center (CPC) will keep the ENSO Alert System at an El Niño Advisory. El Niño conditions remain present, and positive equatorial sea surface temperatures (SST) anomalies continue across most of the Pacific Ocean.CPC expects the El Niño conditions will transition into ENSO-neutral during late spring or early summer 2016, with a possible transition to La Niña conditions in early fall. The seasonal outlook through April 2016 indicates an increased likelihood of above-normal rainfall and near-normal temperatures for Florida.
Hazardous Weather Events in January.
There were a total of 269 severe weather reports made in Florida during February. The bulk of these (208) were the result of just two cold front systems and their associated squall lines sweeping over the state on 15-16th (95 reports) and 23-24th (113 reports). Both systems produced high winds across the state, caused multiple instances of storm damage from Pensacola to Miami, and even spawned several tornadoes. Between 15th and 16th, tornadoes were spotted in Escambia, Jackson, Glades, Collier, Broward, and Miami-Dade Counties. Some of these caused significant damage to structures, as well as downed trees and power lines. The most significant tornado, categorized as an EF3, with winds as high as 155mph, touched down in Pensacola in the late evening of Feb 23. Damage assessment documented at least 37 destroyed, 76 major and 100 minor damaged structures in its path but fortunately no fatalities. The amount of destruction prompted the declaration of a state of emergency for Escambia and Santa Rosa counties.
Table 4: Breakdown of storm reports submitted in Florida during the month of February (Compiled from Southeast Regional Climate Center.)
Agriculture Related Impacts.
Following the heavy rains in January, at the beginning of February most reported topsoil moisture levels were either adequate (51%), or surplus (45%). By the end of the month, the proportion of surplus levels has been reduced to 33%, and 60% of topsoil levels are reported as adequate. Winter wheat and other grains have suffered some damage due to excessive rains over the preceding weeks. Fields in some northern counties that had been negatively affected by heavy rains in January had dried out sufficiently by mid-month to allow for the beginning of spring planting preparations. Subsequent rains have slowed these efforts down. Excessive rain and below-normal temperatures over the past several weeks in South Florida have impacted vegetable production, reducing quality and quantity of yields. Citrus harvesting is proceeding with slight delays in some areas due to rain, and with irrigation in areas that have experienced only light rain over the past weeks. Pasture ratings across the state are mostly in the “fair” category (41%), followed by “good” (32%) and “poor” (20%). Pastures in some counties (Jackson, Washington, Dixie, Orange, Seminole) were in poor condition due to previous flooding and frost. Some ranchers are providing supplemental feed to compensate for the reduced pasture quality. Warmer weather and increasing daylight times are expected to improve pasture conditions.
Drought Related Impacts.
According to the US Drought Monitor, at the end of January, 99% of the state was drought-free. As of the most recent report, issued on February 23, the entire state is drought-free. As a consequence of the record seasonal rainfall amounts in South Florida, water level in Lake Okeechobee at the end of the month were unusually high - about 15.89’, or 1.38’ above normal for this time of the year. To provide relief from these high water levels and afford flood protection for downstream areas, water managers in the region are pumping some of the excess water into a large water detainment facility in Miami-Dade County.
Appendix 1: Additional February departures from normal data for Florida locations.
Appendix 2: Select daily maximum and minimum temperature records (° F) broken during February (compiled from NOAA, NWS).
Building A, Suite 292
Tallahassee, FL 32306-2741
Phone: (850) 644-3417 | (850) 644-0719
climate@coaps.fsu.edu