


The Florida Climate Center serves as the primary resource for climate data, information, and services in the state of Florida.

The Florida Climate Center achieves its mission by providing climate monitoring, research, and expertise to be applied by the people, institutions, and businesses of Florida and the surrounding region.
We provide direct service by fulfilling requests for climate and weather data and information in a variety of formats.
We perform research that advances the understanding of the climate variability and changes of Florida and the surrounding region.
We provide outreach in presentations and at events aimed at a variety of groups, interests, and ages.
Prepared by Preston Leftwich, David F. Zierden, and Melissa Griffin
Florida Climate Center
The Florida State University
Tallahassee, FL

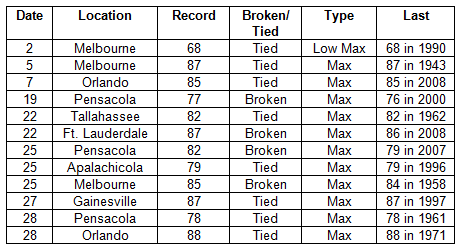
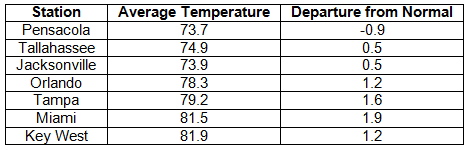
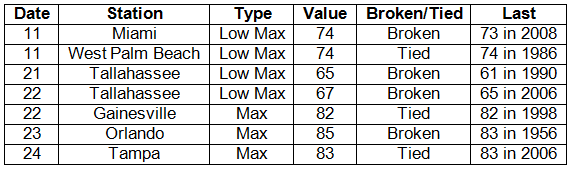
Average temperatures above normal in February. Average temperatures were above normal in all areas during February (Table 1). Although departures from normal were small at Pensacola (0.1° F), Key West (0.7° F), and Tallahassee (0.8° F), Orlando was 3.5° F above normal. Several daily maximum records were tied or broken during February (Table 2). At Melbourne, daily maxima of 87° F on the 5th and 85° F on the 25th, tied a record in existence since 1943 and broke a record in existence since 1958, respectively.
Table 1: February average temperatures and departures from normal (° F) for selected cities.
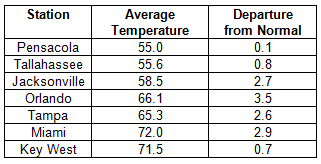
Table 2: Daily temperature records (° F) tied or broken during February. (Compiled from NOAA, NWS).
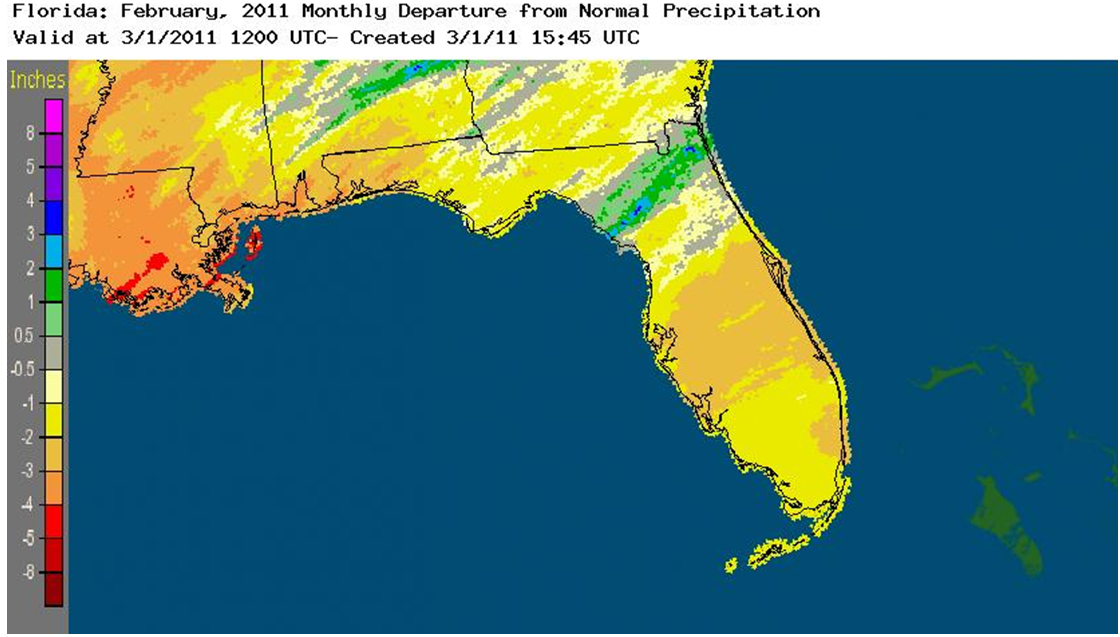
Rainfall totals generally below normal in February. Rainfall totals for February were below normal in most areas (Table 3). Rainfall totals in central and southern areas were generally below one inch. Key West recorded only 0.01 inch during the month. The monthly total at Jacksonville (4.06 in) was pushed above normal by two record daily amounts on the 8th and 10th (Table 4). A band of above normal monthly rainfall extended from the Gulf coast near Cross City northeastward to the Atlantic coast near Jacksonville (Figure 1).
Table 3: February precipitation totals and departures from normal (inches) for selected cities.
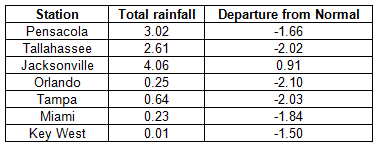
Table 4: Daily rainfall records (inches) tied or broken during February. (Compiled from NOAA, NWS).
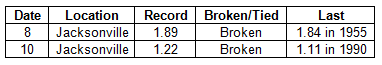
Figure 1: A graphical depiction of the monthly rainfall departure from normal (inches) for February is given in the figure below (courtesy of NOAA, NWS).
La Niña continues during February. Sea surface temperatures in the equatorial Pacific Ocean continued below normal during February, denoting a continued cold phase of ENSO, or La Niña. Above normal temperatures observed during February in the central peninsula and below normal rainfall in most areas are characteristics of winters during La Niña events.
Hazardous weather. Three-quarter-inch-diameter hail was observed near Newberry on the 2nd. Numerous severe weather events occurred on the 7th. Funnel clouds were reported near Bunnell and Flagler Beach. Flooding of roadways occurred in Gainesville. Thunderstorm wind gusts up to 61 mph were recorded at Sanford. Trees and power lines were downed by thunderstorm winds at New Smyrna Beach, Ocala, Crescent City and Holly Hill, and a tree was blown onto a car near Deland. Later in the month, wildfires started in Marion County on the 25th and in Putnam and St. Johns Counties on the 28th. All areas of the state remained abnormally dry during February. Extreme drought conditions existed in areas near the east coast.
Agricultural and other impacts. As freezing temperatures occurred in west-central parts of the state, producers watered fields to preserve strawberry crops. This effort, combined with continued dry weather, drew down the groundwater to the extent that several sinkholes formed. The harvest of mid-season fruit continued despite moderate to severe drought conditions in citrus regions. In the north, sparse precipitation and near-normal temperatures allowed fields to be prepared for spring planting.
Prepared by Preston Leftwich, David F. Zierden, and Melissa Griffin
Florida Climate Center
The Florida State University
Tallahassee, FL
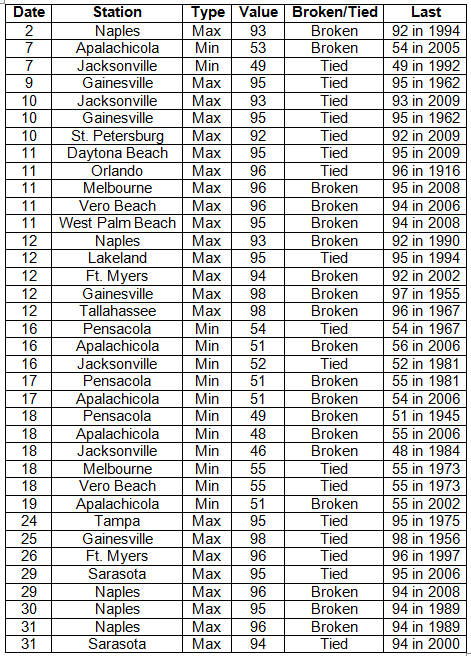
Average temperatures continue above normal in May. Average temperatures were slightly above normal except in the extreme northwest during May (Table 1). Numerous daily maximum and minimum temperature records were tied or broken (Appendix). A maximum at Orlando on the 11th (96° F) tied a record in existence since 1916. Daily maxima were set at Naples on four consecutive days (29th-31st) with 96° F on the 29th and 31st tying the record high for the month of May. In contrast, record daily minima were set on four consecutive days (16th-19th) at Apalachicola and on three consecutive days (16th-18th) at Pensacola. The minimum temperature of 49° F at Pensacola on the 18th broke a record in existence since 1945.
Table 1: May average temperatures and departures from normal (° F) for selected cities.
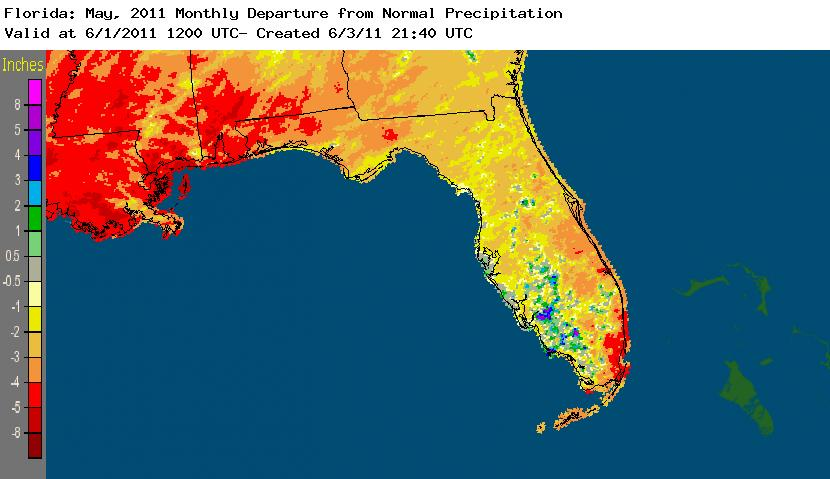
Rainfall totals below normal in most areas in May. Rainfall totals for May were below normal across most of the state in May (Table 2). Monthly totals at Tallahassee (0.59 in) and Miami (2.15 in) were more than four and three inches below normal, respectively. A daily rainfall of 1.68 inches at Sarasota on the 6th broke the previous daily record of 1.24 inches recorded in 1944. This was the only daily record set in May. Areas in the extreme northwest and the extreme southeast were the most below normal during May (Figure 1). Some areas in the southwest were above normal.
Table 2: May precipitation totals and departures from normal (inches) for selected cities.
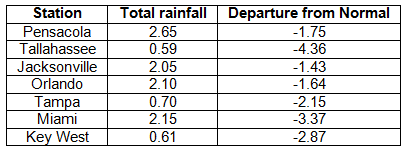
Figure 1: A graphical depiction of the monthly rainfall departure from normal (inches) for May is given in the figure below (courtesy of NOAA, NWS).
La Niña continues to weaken during May. Although sea surface temperatures in the equatorial Pacific Ocean continued to warm slightly during May, they continued below normal, denoting a weak cold phase of ENSO, or La Niña. May weather conditions continued as expected during a La Niña Spring.
Hazardous weather. Isolated events of large hail and trees and/or power lines downed by thunderstorm winds were observed on several days during May. However, the 14th was a very active day. Early in the morning trees and power lines were downed near Tallahassee, Lloyd, and Dills in the north. Later in the day trees were downed at numerous locations across north-central and central parts of the state. One person was injured when a tree was blown onto a mobile home near Oceanway in Duval County. Thunderstorm wind gusts included 76 mph at MacDill Air Force Base, 72 mph at Indian Rocks Beach, 70 mph at Pinellas Park, and 61 mph at Ft. Lauderdale. A roof was blown off a building in Temple Terrace. One-inch-diameter hail was observed at Middleburg, Sebring, and Fargo. Later in the month, hail up to the size of a golf ball (1.75 inch diameter) was observed near Jacksonville, Green Cove Springs, and Jacksonville International Airport on the 27th.
Agricultural and other impacts. Extreme drought conditions persisted in the southeast and northwest during May. Harvesting of vegetables in the south was nearly completed despite the dryness. Some young cotton and potatoes suffered damage from the dryness. Lack of soil moisture delayed planting of cotton in other areas of the north. Cool temperatures and dry conditions caused poor pasture conditions early in the month. By the end of the month most pasture was fair as moderate temperatures aided cool season forage growth. Above normal supplemental feed has been required to offset the overall dryness. Water restrictions remained in place for both agricultural and general use in the southeast.
Appendix: Daily maximum temperature records (° F) tied or broken during May. (Compiled from NOAA, NWS)
Prepared by Preston Leftwich, David F. Zierden, and Melissa Griffin
Florida Climate Center
The Florida State University
Tallahassee, FL
Note: Beginning with this summary, comparisons to normal are based on values for the period 1981-2010.
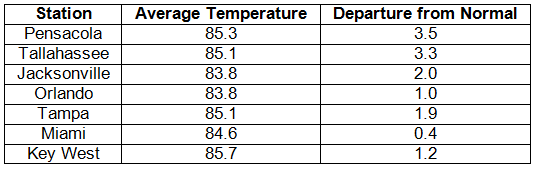
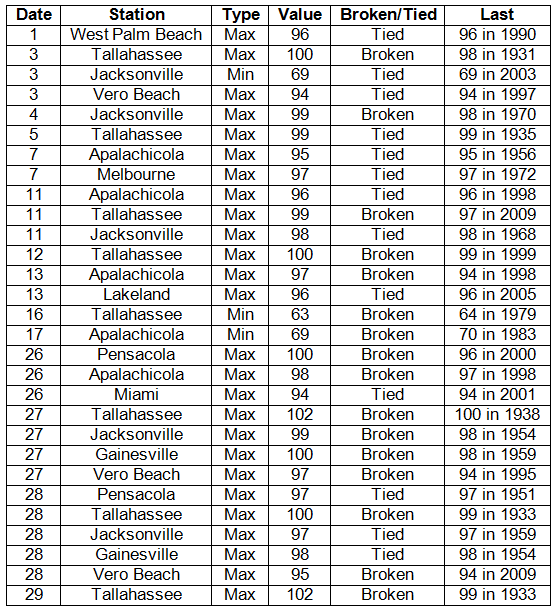
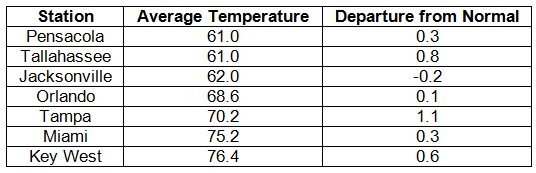
Average temperatures continue above normal in August. Average temperatures were well-above normal in the north during August (Table 1). At Tallahassee the average temperature of 85.1° F marked the warmest August on record. Numerous daily records were tied or broken in all parts of the state (Appendix). Daily maxima at Tallahassee reached at least 100° F seven times. Five of seven daily maximum records tied or broken at Tallahassee had been in existence since the 1930s. Both Apalachicola and Jacksonville set new daily maximum records on four days. In contrast, low temperatures of 69° F at Jacksonville on the 3rd, 63° F at Tallahassee on the 16th, and 69° F at Apalachicola on the 17th were daily minimum records.
Table 1: August average temperatures and departures from normal (° F) for selected cities.
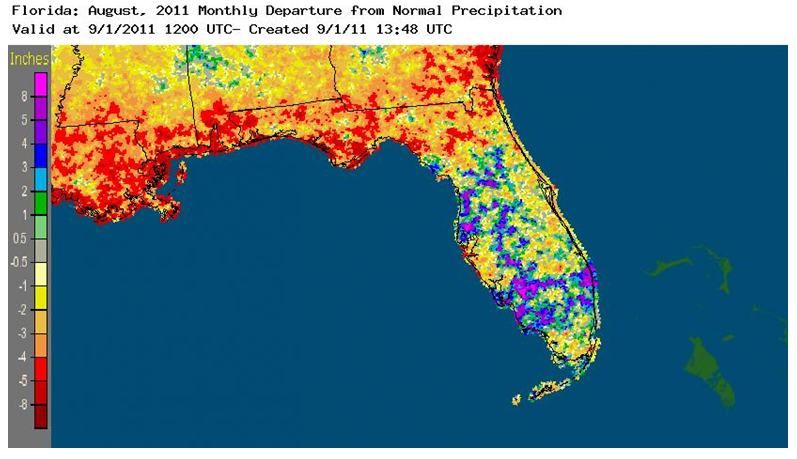
Rainfall totals vary during August. Rainfall totals varied greatly across the state during August (Table 2). In the north, monthly totals at Pensacola (2.27 inches) and Tallahassee (2.03 inches) were more than 5 and 5 inches below normal, respectively. It was the driest August on record at Tallahassee. In contrast, monthly totals in central and southern areas were generally above normal. Miami and Key West observed rainfall of more than 11 inches during the month. In addition, monthly totals at West Palm Beach and Vero Beach exceeded 11 inches, also. The monthly total at Key West was more than 5 inches above normal. Five daily rainfall records were broken. A daily total of 1.84 inches at Daytona Beach on the 1st broke a record in existence since 1944. A daily total of 3.78 inches at Vero Beach on the 16th broke a record in existence since 1947. Also, a daily total of 2.07 inches at Key West on the 31st broke a record in existence since 1872. Areal patterns of monthly rainfall relative to normal are depicted in Figure 1.
Table 2: August precipitation totals and departures from normal (inches) for selected cities.
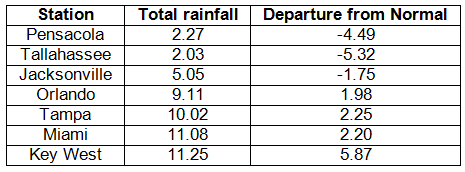
Table 3: Daily rainfall records (inches) broken during August (compiled from NOAA, NWS).
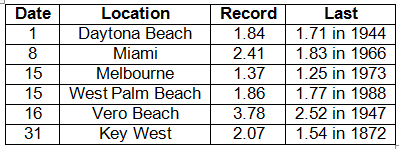
Figure 1: A graphical depiction of the monthly rainfall departure from normal (inches) for August is given in the figure below (courtesy of NOAA, NWS).
ENSO continues in neutral phase during August. Sea surface temperatures in the equatorial Pacific Ocean continued near-normal during August, indicating a neutral phase of El Niño-Southern Oscillation (ENSO). A neutral phase of ENSO had no impact on weather across the state during August.
Hazardous weather. A weak tornado damaged roofs, blew out windows and caused tree damage along a path from Tamarac to North Lauderdale on the 2nd. On the 5th, a waterspout that moved onshore from a lake near Eustis damaged two roofs and downed power lines. Thunderstorms downed trees near Crescent City, St. Augustine, Callahan, Mandarin, Anthony and Hastings on the 12th. Two persons were injured when thunderstorm winds blew a tree onto a mobile home near Ocala on the 13th. On the 23rd, thunderstorm winds blew a tree across I-75 near Micanopy and damaged a mobile home near Chiefland. As Hurricane Irene passed well offshore on the 25th, gusty winds and some heavy rain were recorded in immediate eastern coastal areas. Also, two persons drowned in high surf generated by Irene.
Agricultural and other impacts. High temperatures and continued dryness stressed cotton, peanuts and pasture in the Panhandle. Rain during the latter half of the month improved drought conditions in southeastern and southwestern areas. However, water restrictions remained in place in portions of the southeast.
Appendix: Daily maximum and minimum temperature records (° F) tied or broken during August (compiled from NOAA, NWS).
Prepared by Melissa Griffin, Preston Leftwich, and David F. Zierden
Florida Climate Center
The Florida State University
Tallahassee, FL
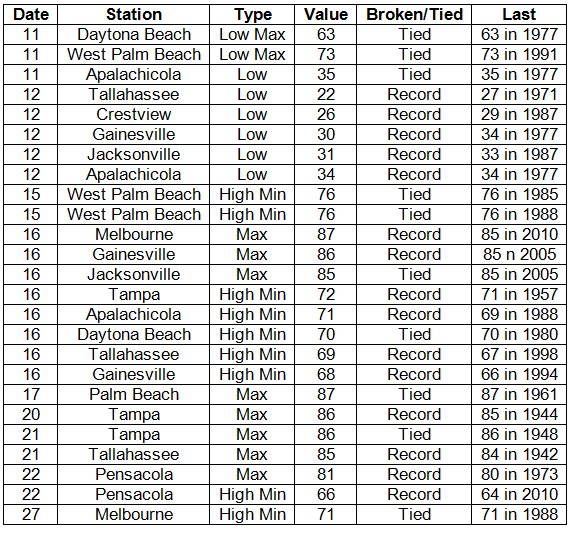
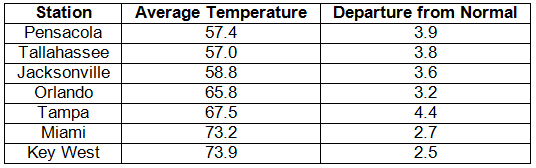
Average temperatures were near normal in November. Average temperatures were near normal across the entire state (Table 1). Departures from normal ranged from -0.2° F at Jacksonville to 1.1° F at Tampa. An extremely cold dry air mass pushed into northern parts the state at the beginning of the month, causing numerous minimum temperature records to be broken or tied from the 11th to the 12th (Appendix). The minimum temperature at High Springs, FL on the morning of the 11th was 20° F. Because of this cold snap, some of the National Weather Service's offices in the northern part of the state have suspended issuance of Frost Advisories until March 1st. After the strong cold front pushed through the state, temperatures rebounded and tied and broke maximum records in a few locations from the 15th to the 17th. Temperatures were slightly warmer than normal ahead of another strong cold front prior to Thanksgiving.
Table 1: November average temperatures and departures from normal (° F) for selected cities.
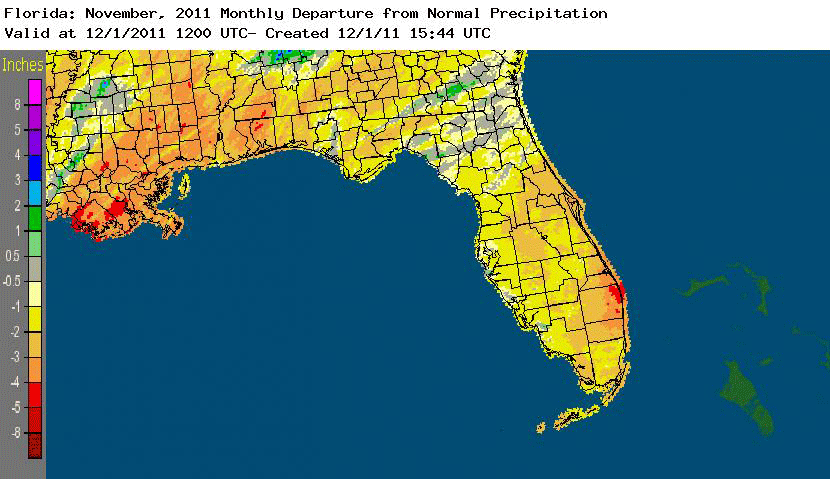
Rainfall totals were below normal statewide in November. Rainfall totals were below normal statewide in November (Table 2). The month was the 4th driest on record at Orlando and the 10th driest on record at Key West. The passage of cold fronts through the northern portions of the state were the main source of precipitation for November, though the totals that amounted from each passage were still not enough to impact the lingering drought. Areal patterns of monthly rainfall relative to normal are depicted in Figure 1.
Table 2: November precipitation totals and departures from normal (inches) for selected cities.
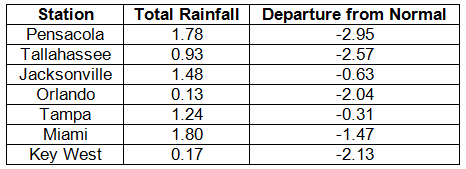
Figure 1: A graphical depiction of the monthly rainfall departure from normal (inches) for November is given in the figure below (courtesy of NOAA, NWS).
La Niña continues during November. La Niña conditions continue to be present across the equatorial Pacific, with sea surface temperatures (SST) at least 0.5?C below average for the region. The atmospheric circulation anomalies and winds are consistent with La Niña. The current La Niña is forecasted to strengthen and continue through the winter of 2011/2012. The Climate Prediction Center has predicted warmer than normal temperatures and below normal precipitation during this La Niña. However, the 'Wild Card' will be the Arctic Oscillation (AO), which has the potential to trump the typical La Niña pattern. The AO is always present and fluctuates between positive and negative phases. The negative phase of the AO pushes cold Canadian air into the US, leading to periods of well-below normal temperatures, as it has the last two winters. Strong AO phases typically last a few weeks and are very difficult to predict more than a week or two in advance.
Hazardous weather. The only severe weather report for the month came out of Hamilton County as a line of strong storms moved through portions of southern Alabama and Georgia on the 16th. Numerous trees were reportedly knocked over, there was some minor damage done to a shed, and shingles were pulled from a roof.
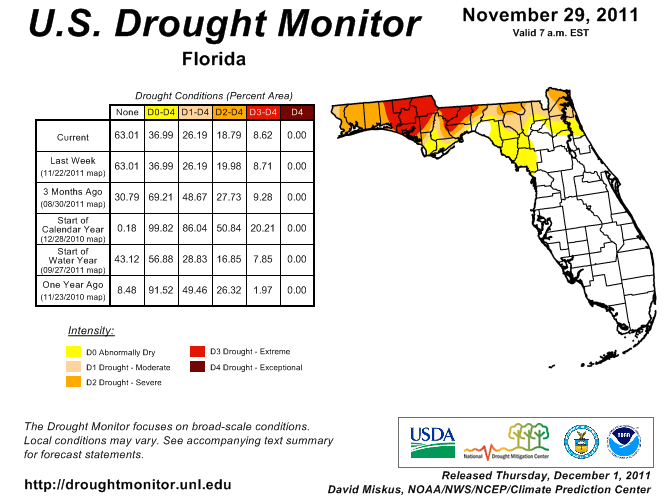
Agricultural and other impacts. The cold snap earlier in the month damaged vegetable crops in portions of the Florida Panhandle, while warmer temperatures and precipitation caused disease issues in St. Lucie County and the agricultural areas to the southwest of Lake Okeechobee. The continued drought limited the amount of small grain forage being planted in the state. Since the October 25 release of the National Drought Monitor, there has been little change to the drought. Extreme drought lingers in the Panhandle, while Escambia, Santa Rosa and Okaloosa Counties have gone from moderate to severe drought. Water restrictions remain in place in South Florida, even though Lake Okeechobee has maintained a water level of 13.84 ft. This is due the forecasted La Niña and decreased chance of precipitation throughout the winter.
Figure 2: Drought conditions in Florida as of November 29, 2011 (courtesy of U.S. Drought Monitor).
Appendix: Daily maximum and minimum temperature records (° F) tied or broken during November (compiled from NOAA, NWS).
Prepared by Melissa Griffin, Preston Leftwich, and David F. Zierden
Florida Climate Center
The Florida State University
Tallahassee, FL
Average temperatures were above normal in December. Average temperatures were well above normal across the entire state (Table 1). Departures from normal ranged from 2.5°F at Key West to 4.4°F at Tampa. Unlike the previous two Decembers, there was very little cold air that made it into the state, which led to the warmer than normal temperatures that are typically reported with La Niña conditions. Miami had its 8th warmest December on record, while Tampa had its 9th, and both Orlando and Pensacola had their 11th. All of the temperature records broken for the month were either maximum high temperatures or record high nighttime low temperatures.
Table 1: December average temperatures and departures from normal (° F) for selected cities.
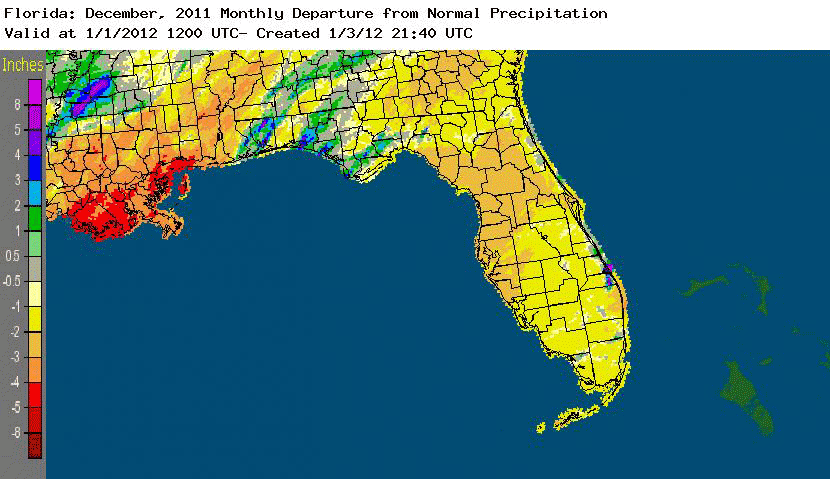
Rainfall totals varied statewide in December. Rainfall totals varied across the state during December (Table 2). Portions of the Panhandle had above normal rainfall, while most locations in the Peninsula recorded below normal precipitation. The month was the 5th driest on record at Tampa, while it was the 5th wettest on record at Pensacola. Most of the rainfall for the month reported at Pensacola came from two separate events, which broke daily rainfall records on the 20th and 26th (Table 3). The below normal rainfall for the month across most the state led the U.S. Drought Monitor to designate dry conditions in the Peninsula. Areal patterns of monthly rainfall relative to normal are depicted in Figure 1.
Table 2: December precipitation totals and departures from normal (inches) for selected cities.
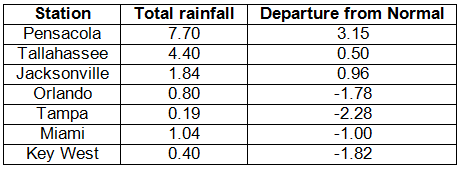
Table 3: Daily rainfall records (inches) broken during December (compiled from NOAA, NWS).
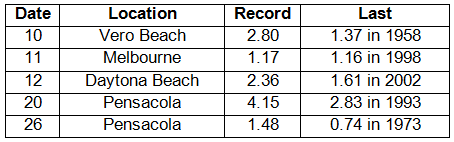
Figure 1: A graphical depiction of the monthly rainfall departure from normal (inches) for December is given in the figure below (courtesy of NOAA, NWS).
La Niña continued during December. La Niña conditions continue to be present across the equatorial Pacific, with sea surface temperatures (SST) at least 0.5?C below average for the region. The atmospheric circulation anomalies and winds are consistent with La Niña. The current La Niña is forecasted to continue through the winter of 2011/2012 into the spring, with the possibility of a return to neutral conditions by the summer. The Climate Prediction Center has predicted warmer than normal temperatures and below normal precipitation during this La Niña. The Arctic Oscillation (AO) remained positive during December, holding off any extreme cold air outbreaks like those seen during the last two winters.
Hazardous weather. No hazardous weather was reported in the state during December 2011.
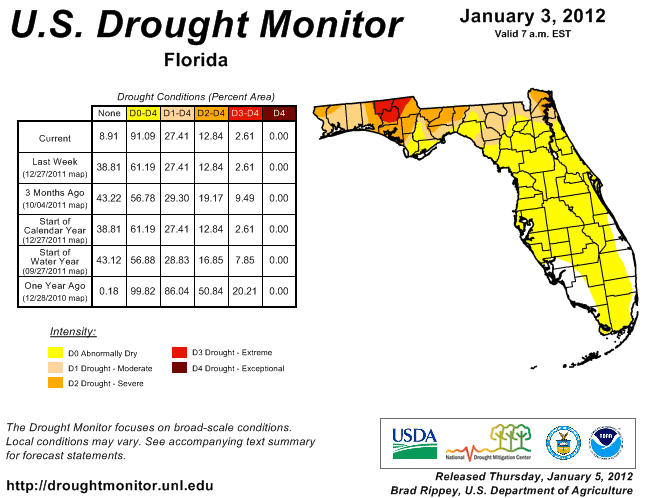
Agricultural and other impacts. Winter planting progressed due to dry conditions, with good growth evident in may winter crops due to mild temperatures. Ryegrass was not planted, due to La Niña, and most of the livestock in the state is being fed hay and supplements. Since the November 29 release of the National Drought Monitor, there have been some large changes to the status of the drought in Florida. The area of extreme drought that lingered in parts of the Panhandle eased after some areas received above normal rainfall during December. However, portions of the Peninsula had drier than normal conditions during December. At the end of November, only about 37% of the state was under any type of drought designation. That number has now increased to just over 91%. Continued La Niña conditions through the winter will mean decreased precipitation, and water restrictions remain in place in South Florida (the water level of Lake Okeechobee is now 13.55 ft). Restrictions in other areas could go into effect.
Figure 2: Drought conditions in Florida as of January 3, 2012 (courtesy of U.S. Drought Monitor).
Appendix: Daily maximum and minimum temperature records (° F) tied or broken during December (compiled from NOAA, NWS).
Building A, Suite 292
Tallahassee, FL 32306-2741
Phone: (850) 644-3417 | (850) 644-0719
climate@coaps.fsu.edu