


The Florida Climate Center serves as the primary resource for climate data, information, and services in the state of Florida.

The Florida Climate Center achieves its mission by providing climate monitoring, research, and expertise to be applied by the people, institutions, and businesses of Florida and the surrounding region.
We provide direct service by fulfilling requests for climate and weather data and information in a variety of formats.
We perform research that advances the understanding of the climate variability and changes of Florida and the surrounding region.
We provide outreach in presentations and at events aimed at a variety of groups, interests, and ages.
Prepared by Lydia Stefanova, Daniel J. Brouillette, and David F. Zierden.
Florida Climate Center
The Florida State University
Tallahassee, FL

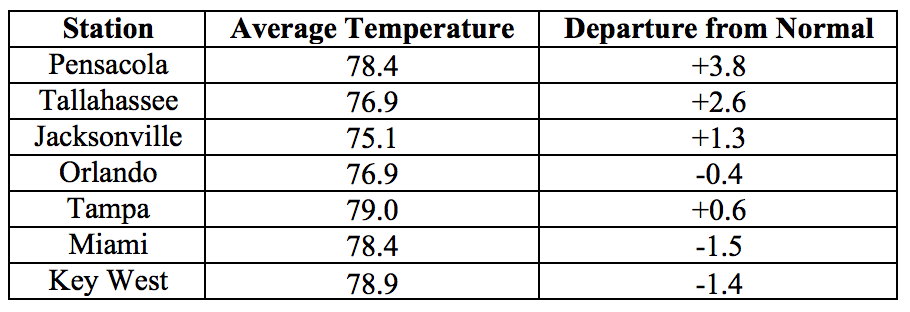
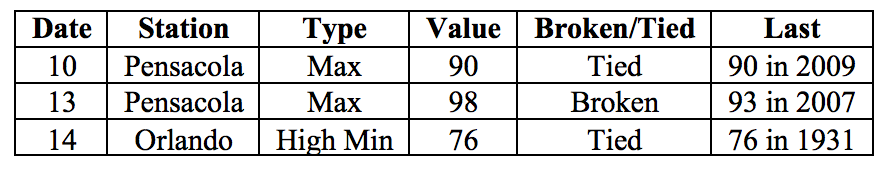
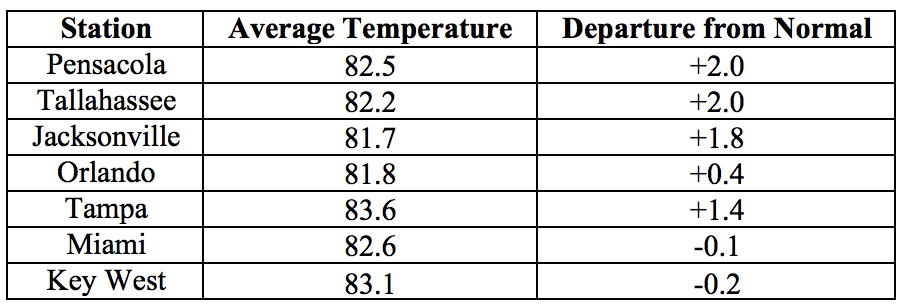
Average temperatures in May were mixed across the state. The departures from average temperatures in May 2018 were above normal in the northern portion of the state and below normal in the south. The departures from average May temperatures ranged from -1.7˚F in Fort Lauderdale to +3.8˚F in Pensacola (Table 1 and Appendix 1). May 2018 was the 2nd warmest for Pensacola. A handful of daily temperature records were tied or broken across the state (Appendix 2).
Table 1: May average temperatures and departures from normal (˚F) for selected cities.
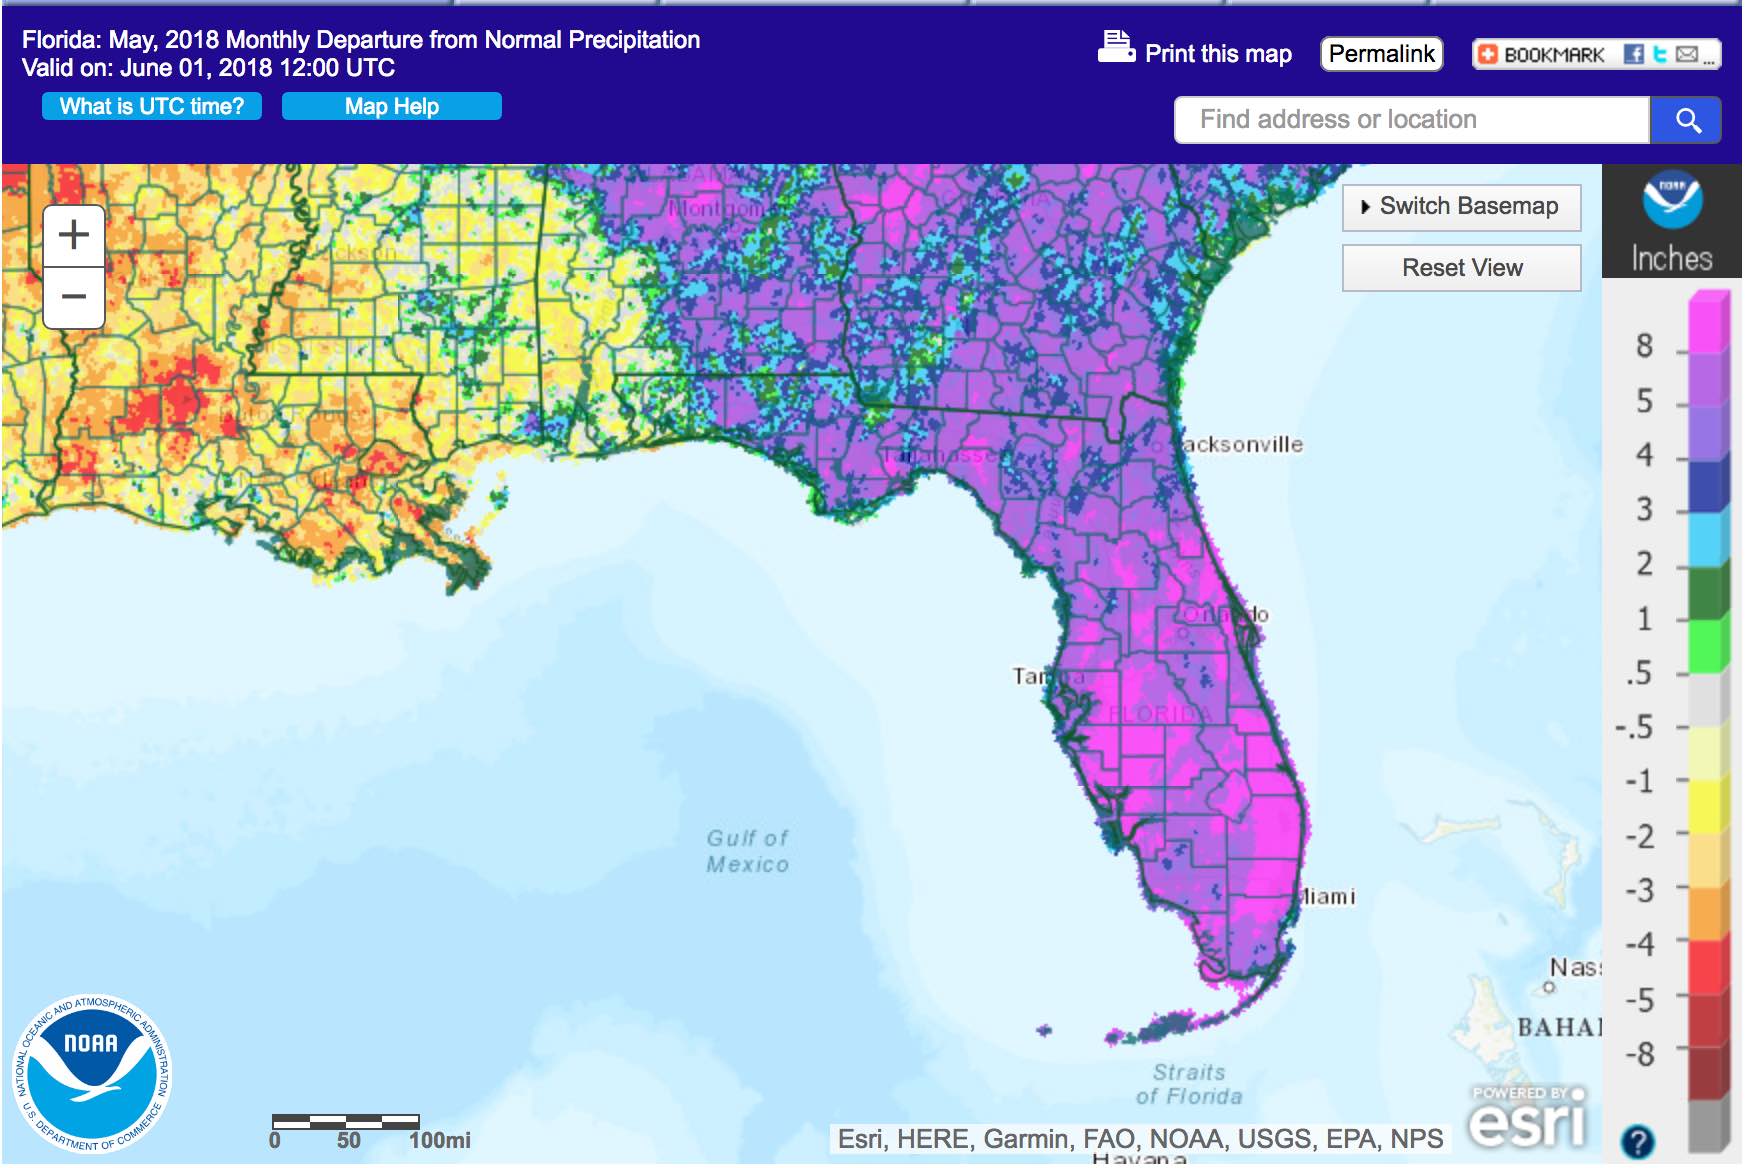
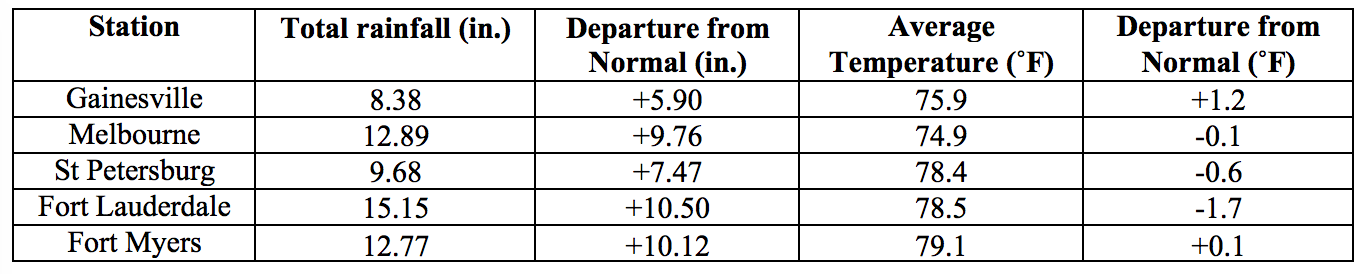
Rainfall totals in May were well above normal for most of state. Rainfall totals in May 2018 were well above normal across the state, except for the extreme western Panhandle (Figure 1). Departures from normal at major reporting stations ranged from -0.45” in Pensacola to +11.25” in Miami (Table 2 and Appendix 1), although localized parts of the state saw rainfall totals that were over 15’’ above normal. For most stations in peninsular Florida this was among the top 10 wettest Mays on record, with monthly totals exceeding the normal values 3- to 4-fold. It was the wettest May on record for Key West, breaking the previous record set in 1904 by over an inch. Based on preliminary rankings, to be officially confirmed later this week, this was also the wettest May on record statewide. A few 24-hour precipitation records broken for the month (Table 3).
Table 2: May precipitation totals and departures from normal (inches) for select cities.
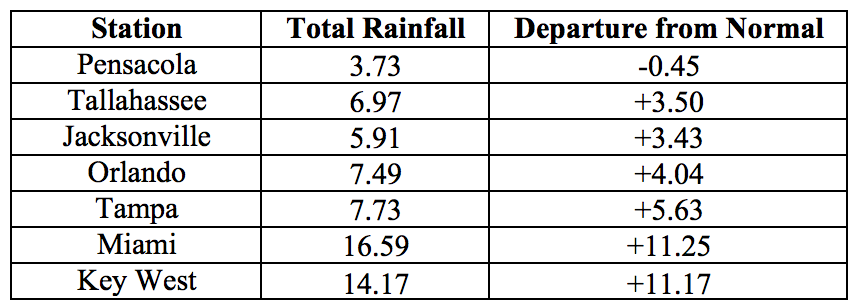
Table 3: Select daily rainfall records (inches) broken during May. (Compiled from NOAA, NWS).
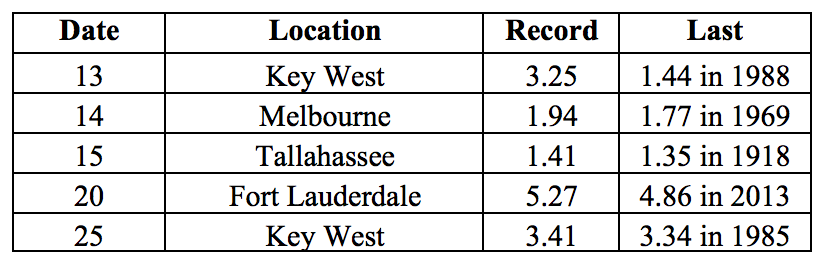
Figure 1: A graphical depiction of the monthly rainfall departure from normal (inches) for May is given in the figure below (courtesy of NOAA, NWS)
ENSO-Neutral Conditions are Present in the Pacific.
Based on current data and forecast models the Climate Prediction Center (CPC) has issued a Final La Niña Advisory. ENSO-neutral conditions are currently present, with sea surface temperatures (SST) near normal across most of the Pacific Ocean. ENSO-neutral conditions are favored to persist until fall of 2018, with a possibility of El Niño by winter of 2018. The CPC seasonal outlook favors above-normal temperatures and above-normal precipitation through August 2018.
Hazardous Weather Events in May.
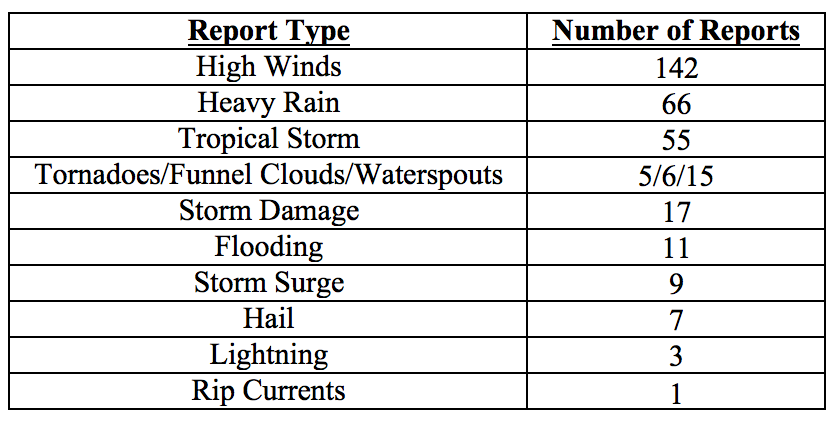
There were a total of 337 hazardous weather events logged to the National Weather Service Local Storm Reports Database for the state during May 2018. The majority of these involved high winds and heavy rain (see Table 4 for a breakdown).
A tropical disturbance entering the Gulf of Mexico from the Caribbean Sea developed into Subtropical Storm Alberto on May 25th, making for an unusually early start to the 2018 hurricane season. In anticipation of impact, a state of emergency was declared for the state, and evacuations orders were issued in some coastal areas. At its peak strength, Alberto had sustained winds of 65mph, weakening to 45mph as it made landfall in Bay County on the 28th. Storm surges were reported in Franklin and Wakulla Counties, with some beaches and roads going underwater. Two tornadoes were recorded during the passage of Alberto, one in Martin County on the 27th, and near Homestead in Miami-Dade on the 29th. Tropical storm conditions were felt in Bay, Dixie, Franklin, Gulf, Homes, Leon, Okaloosa, Wakulla, and Walton counties. High winds were felt throughout the state. The largest rainfall amounts after landfall were reported from Escambia, Okaloosa and Walton Counties.
Other significant weather events for the month included a lightning strike on the 16th that killed one person and injured two others working on a farm in Parkland, Palm Beach County. Multiple swimmers required rescue from rip currents near Cocoa Beach on the 5th, with one reported fatality. Several swimmers were successfully rescued from rip currents near Destin on the 18th and near Boca Raton on the 20th.
The heaviest rains for the month were measured on the 20th in Broward and Palm Beach Counties, with 6-hour rainfall totals up to over 8”.
Table 4: Breakdown of storm reports submitted in Florida during the month of May (Compiled from Iowa State University/Iowa Environmental Mesonet.)
Drought-Related Impacts.
At the end of April about half of the state’s area was drought free, including most of the Panhandle to north-central Florida. Most of central to southern Florida was experiencing either abnormally dry (D0) conditions or moderate (D1) to severe (D2) drought. Conditions were gradually improving during the first half of the month and drought was completely eliminated throughout the state following the heavy rains brought about by subtropical storm Alberto and the associated circulation.
At the end of the month, Lake Okeechobee water levels were at 14.19 ft., which is about a foot above normal for this time of the year. Significant discharges are being made in an effort to lower lake levels in anticipation of the wet summer season.
Agriculture-Related Impacts.
At the beginning of May, most topsoil moisture levels were either adequate or short, with some very short values present as well. Dry conditions in the first half of the month were problematic for some pastures and for planting of row crops, and citrus groves required regular irrigation. As rainy conditions set in across the state starting on the 14th of the month, citrus irrigation was discontinued. Fruit and vegetable harvest in many areas suffered from excessive rain. Planting and harvesting of row crops was made difficult by muddy fields. Some low-lying or poorly draining pastures were flooded, but otherwise pasture quality responded very well to the rain. Cattle across the state are in mostly good condition.
Appendix 1: Additional May departures from normal data for Florida locations.
Appendix 2: Select daily maximum and minimum temperature records (° F) broken or tied during May (compiled from NOAA, NWS).
Prepared by Lydia Stefanova, Daniel J. Brouillette, and David F. Zierden.
Florida Climate Center
The Florida State University
Tallahassee, FL
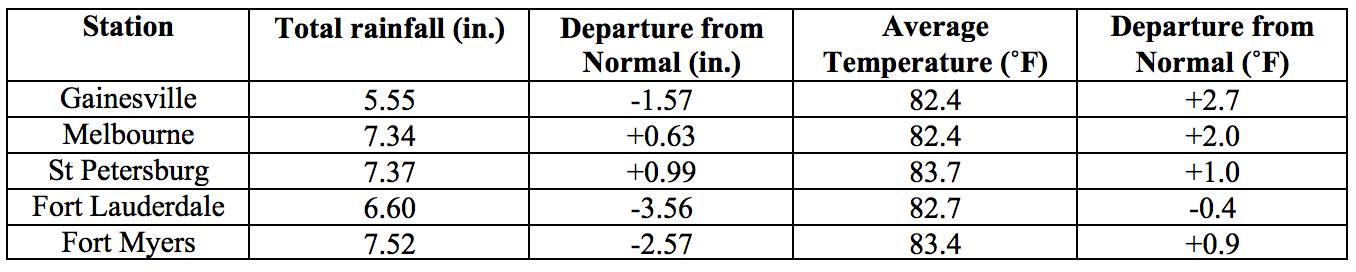
Average temperatures in June were above normal across most of the state. The departures from average temperatures in June 2018 were above normal across most of state with some below normal values in the southern portion. Departures from average temperatures ranged from -0.4˚F in Fort Lauderdale to +2.7˚F in Gainesville (Table 1 and Appendix 1). June 2018 was the 3rd warmest in Melbourne, 5th warmest in Tampa, St. Petersburg and Fort Lauderdale, 9th warmest in Pensacola, and 10th warmest in Gainesville. Several warm temperature records were tied or broken across the state (Appendix 2).
Table 1: June average temperatures and departures from normal (˚F) for selected cities.
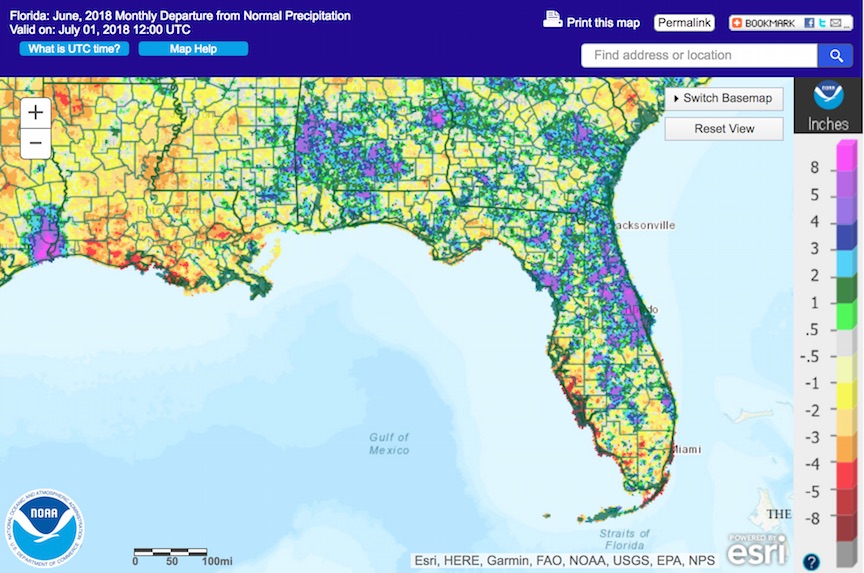
Rainfall totals in June were well mixed across the state. Rainfall totals in June 2018 were mixed, with below normal values most prominent in parts of south and southwest Florida and above normal values in most of the central and eastern parts of the state (Figure 1). Departures from normal ranged from -3.73” in Tampa to +3.32” in Jacksonville (Table 2 and Appendix 1), although localized parts of the state saw rainfall totals that were as much as 5.00” below normal to 8.00” above normal (Figure 1). Two records for 24-hour precipitation were tied or broken for the month (Table 3).
Table 2: June precipitation totals and departures from normal (inches) for select cities.
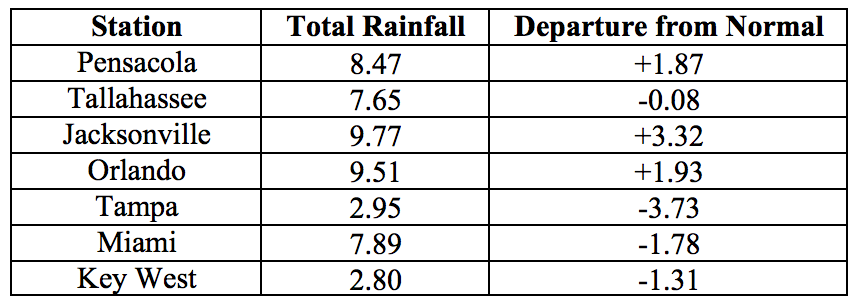
Table 3: Select daily rainfall records (inches) broken during June. (Compiled from NOAA, NWS).
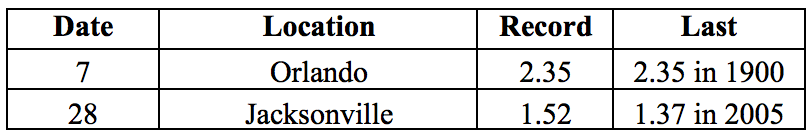
Figure 1: A graphical depiction of the monthly rainfall departure from normal (inches) for June is given in the figure below (courtesy of NOAA, NWS)
ENSO-Neutral Conditions are Present in the Pacific.
Based on current data and forecast models, the Climate Prediction Center (CPC) has set the ENSO Alert System Status to El Niño Watch. ENSO-neutral conditions are currently present, with sea surface temperatures (SST) near- to above-average across the east-central Pacific Ocean, and above average in the eastern Pacific Ocean. ENSO-neutral conditions are favored through the summer, with an increasing probability of El Niño developing into Fall and Winter 2018. The CPC seasonal outlook favors above-normal temperatures for Florida through September 2018.
Hazardous Weather Events in June.
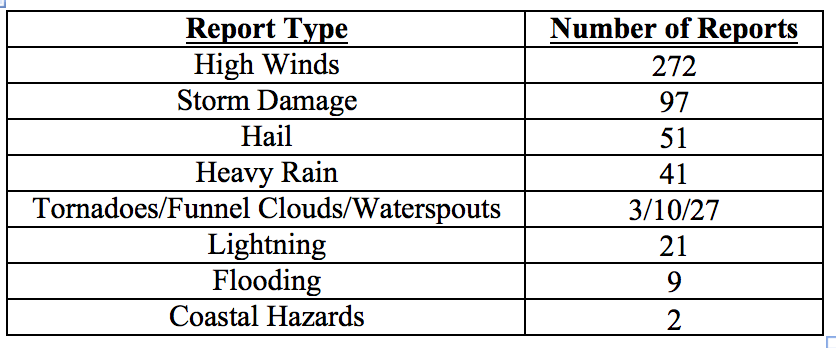
A total of 533 hazardous weather events were logged in the National Weather Service’s Local Storm Reports database for the state during the month of June (see Table 4 for a breakdown by type). The most frequent types of hazardous weather conditions encountered throughout the month involved high winds and storm damage.
Thunderstorms were frequent throughout the month and across the state. Wind gusts in excess of 50mph were recorded on multiple occasions in Alachua, Brevard, Broward, Duval, Escambia, Flagler, Monroe, Miami-Dade, Okaloosa, Palm Beach, Santa Rosa, and St. Johns Counties. A record daily wind gust of 53 mph was set for June 27th at Gainesville regional airport, breaking the old record of 41 mph for this date. Strong sustained winds ranging from 10 to 38mph were reported on the 28-29th of the month in multiple locations of Escambia, Flagler, and Santa Rosa Counties, and heavy rain on these dates impacted Escambia, Okaloosa and Santa Rosa Counties. Hailstorms were observed on multiple occasions during the month in Alachua, Bay, Brevard, Broward, Collier, Columbia, Flagler, Hendry, Indian River, Lake, Lee, Marion, Martin, Miami-Dade, Monroe, Orange, Osceola, Palm Beach, Seminole, St. Johns, and Volusia Counties. Hailstones with 2-inch diameter were recorded near St. Augustine Beach on the 3rd.
Multiple waterspouts were observed along the coastal waters near the Florida Keys and Miami area, with one waterspout crossing onto land as a weak tornado on the 13th in the area of Palm Beach. Several funnel clouds were reported on various dates in Alachua, Broward, Manatee, Marion, Miami-Dade, Palm Beach, Seminole, and St. Lucie Counties, and a possible brief tornado caused moderate roof damage on an apartment building in Tampa on the 29th.
Some of the most life-threatening weather events during June were lightning strikes. At least 13 people were struck by lightning this month in incidents in Alachua, Bay, Brevard, Broward, Clay, Duval, Lake, Orange, Sarasota, and Volusia Counties, including two fatalities. Another fatality and five injuries were reported as a result of rip currents at Pensacola Beach in Escambia County on the 19th of the month.
Table 4: Breakdown of storm reports submitted in Florida during the month of June (Compiled from Iowa State University/Iowa Environmental Mesonet.)
Drought-Related Impacts.
As of the latest US Drought Monitor Report issued on June 26th the entire state has remained free since the end of May, despite the below-normal rainfall in parts of South Florida,
At the end of the month, Lake Okeechobee water levels were at 14.26 ft., which is somewhat higher than normal for this time of the year. Following a very rainy May, large volumes of water were being released from the lake, causing problems with prolonged low salinity levels in the estuary. After a drier June, pulsed releases are being made to allow salinity levels to recover. There is a growing concern of spreading algal bloom in the lake.
Agriculture-Related Impacts.
At the beginning of June, topsoil moisture levels were at mainly adequate (74%) to surplus (24%). These levels have held relatively steady throughout the month, with just a slight shift towards lower values. Irrigation across the citrus growing region had been scaled back in the first half of the month, but has returned to daily due to warm temperatures and reduced rainfall. Overall it is estimated that the citrus crop is doing well. Cattle and pastures across the state are in generally good condition although some counties have had problems with prolonged oversaturation with pasture flooding causing difficulties for cattle. Overabundant rains in the Panhandle in May and into June delayed the cutting of hay and harvesting wheat and caused difficulty for planting of row crops. Some of the already planted crops were suffering with disease and weed pressure. It is likely that some crop fields will require replanting. Fruit and vegetable harvest has been proceeding well, although land preparation for fall planting was hindered by daily afternoon rains. Sugarcane is doing well.
Appendix 1: Additional June departures from normal data for Florida locations.
Appendix 2: Select daily maximum and minimum temperature records (° F) broken or tied during June (compiled from NOAA, NWS).
Prepared by Lydia Stefanova, Daniel J. Brouillette, and David F. Zierden.
Florida Climate Center
The Florida State University
Tallahassee, FL
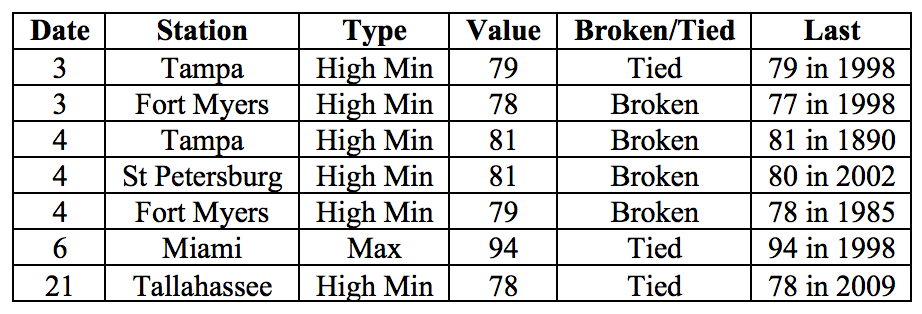
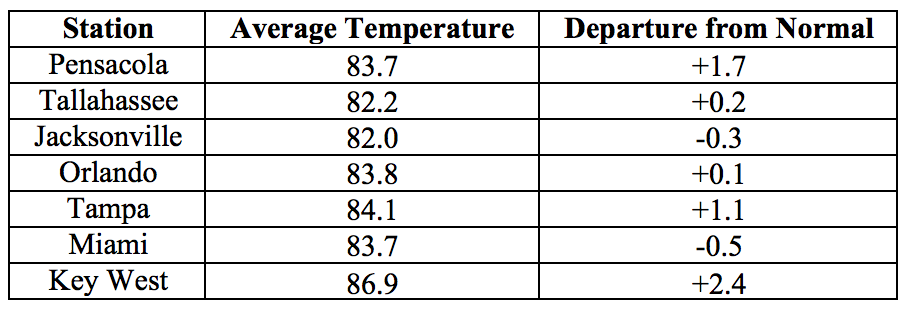
Average temperatures in July were mostly above normal. The departures from average temperatures in July 2018 were above normal across most of the state, ranging from -0.5˚F in Miami to +2.5˚F in Melbourne (Table 1 and Appendix 1). July 2018 was the warmest on record in Key West, 3rd warmest in Melbourne, and 8th warmest in Tampa and Fort Lauderdale. Several warm temperature records were tied or broken across the state (Appendix 2).
Table 1: July average temperatures and departures from normal (˚F) for selected cities.
Rainfall totals in July were mixed across the state. Rainfall totals in July 2018 were mixed across the state (Figure 1). Departures from normal roughly ranged from -2.44” in St. Petersburg to +2.31 ” in Jacksonville (Table 2 and Appendix 1), though localized parts of the state saw rainfall totals that were as much as 4.00” below normal to more than 8.00” above normal (Figure 1). One 24-hour precipitation record was broken for the month (Table 3).
Table 2: July precipitation totals and departures from normal (inches) for select cities.
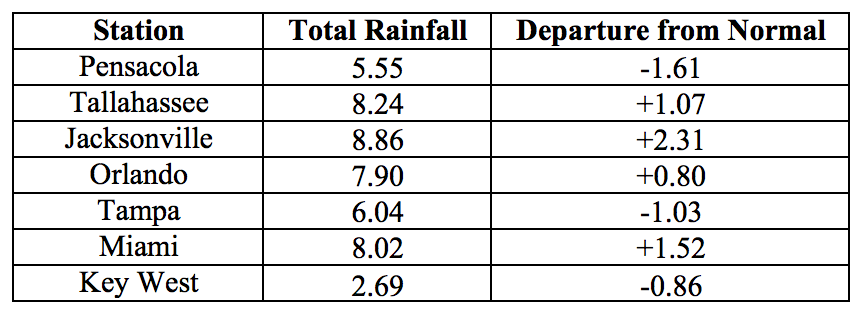
Table 3: Select daily rainfall records (inches) broken during July. (Compiled from NOAA, NWS).
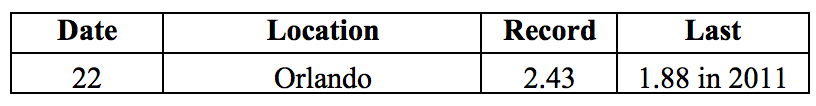
Figure 1: A graphical depiction of the monthly rainfall departure from normal (inches) for July is given in the figure below (courtesy of NOAA, NWS)
ENSO-Neutral Conditions are Present in the Pacific.
Based on current data and forecast models, the Climate Prediction Center (CPC) has set the ENSO Alert System Status to El Niño Watch. ENSO-neutral conditions are currently present, with sea surface temperatures (SST) near- to above-average across most of the Pacific Ocean. ENSO-neutral conditions are favored through the summer, with an increasing probability of El Niño developing into Fall and Winter 2018. The CPC seasonal outlook favors above-normal temperatures for Florida through September 2018.
Hazardous Weather Events in July.
A total of 385 hazardous weather events were logged in the National Weather Service’s Local Storm Reports database for the state during the month of July (see Table 4 for a breakdown by type). The most frequent types of hazardous weather conditions encountered throughout the month involved high winds and storm damage. Over half (199) of all hazardous weather occurred between the 21st and 23rd of the month when the circulation was impacted by a low-pressure system over the area.
Two hazardous weather-related fatalities and several injuries were reported as a result of thunderstorms, lightning, and rip currents. Strong thunderstorm winds downing a large tree in Daytona Beach caused one injury and one fatality on the 22nd of the month. Two people were injured by a lightning strike on the 10th of the month in Palm Beach. One fatality was the result of a rip current at the coast near Melbourne. According to broadcast media, over 140 people were rescued from rip currents along the coast of Volusia County between the 10th and 11th of the month.
Thunderstorm wind gusts exceeding 50 mph were measured on various instances in Alachua, Bay, Brevard, Collier, Duval, Franklin, Manatee, Miami-Dade, Palm Beach, Pinellas, and Volusia Counties. Gusts over 60 mph were reported on the 23rd over St. George Island in Franklin County and near Dunedin in Pinellas County.
Three weak and brief tornadoes were seen in South Florida (in Dade, Broward, and Palm Beach Counties), and three more were reported in St. Johns, Flagler, and Lake Counties. There were 21 waterspouts observed along the Atlantic Coast, with 18 of those reported in the area from Miami to the Florida Keys. Eight waterspouts were observed in the Gulf coastal waters between Clearwater and Pensacola.
Table 4: Breakdown of storm reports submitted in Florida during the month of July (Compiled from Iowa State University/Iowa Environmental Mesonet.)
Drought-Related Impacts.
As of the latest US Drought Monitor Report issued on July 24th the entire state has remained free since the end of May, despite the below-normal rainfall in parts of the state during the last month.
At the end of the month, Lake Okeechobee water levels were at 14.36 ft., which is somewhat higher than normal for this time of the year. Algal bloom in the lake remains a serious concern, as it is now covering some 40% of the lake surface. Water releases from the lake are being made to ensure available lake capacity since the tropical season has the potential to fill the lake in a very short period
Agriculture-Related Impacts.
At the beginning of July, topsoil moisture levels were at mainly adequate (82%) or surplus (16%). By the end of the month topsoils were somewhat wetter, with 72% adequate and 24% surplus values.
During most of the month the citrus growing region has been experiencing normal to above-normal temperatures, with frequent and widespread rainshowers. Canals and ditches generally had ample water for irrigation, and irrigation was run as needed in areas that received less rain. The citrus fruit are developing well and growers have a positive outlook for the upcoming crop. Pasture quality has been mostly good, although oversaturated pastures and standing water have been observed in some low-lying fields in areas that received large amounts of rain, particularly in the northern part of the state. Cattle are in mostly good condition. Hay cutting was going on throughout the month in Dixie, Jackson, Levy, and Lafayette Counties, with delays in areas with wet conditions. Row crop planting in the Panhandle has been delayed because of oversaturated fields, and peanut plantings in Levy County are suffering from excess water. Corn was being harvested in Dixie, Levy, Okeechobee, and Palm Beach Counties. Sugarcane is doing well.
Appendix 1: Additional July departures from normal data for Florida locations.
Appendix 2: Select daily maximum and minimum temperature records (° F) broken or tied during July (compiled from NOAA, NWS).
Prepared by Daniel J. Brouillette
Florida Climate Center
The Florida State University
Tallahassee, FL
Mean temperatures in August were mainly near to slightly above normal across the state, except in a portion of the north-central part of the peninsula, where they were considerably above normal. The anomalies in monthly mean temperature were mix of positive and negative across the state but near to slightly above normal, overall, ranging from as positive as +2.6˚F at Gainesville and Melbourne in the north-central part of the state to as negative as -0.7˚F at Fort Myers and Miami in the coastal southern sections (Table 1 and Appendix 1). Continuing a long-term trend, anomalies in monthly mean minimum temperature were more positive than anomalies in monthly mean maximum temperatures. August 2018 was the second warmest at Melbourne, sixth warmest at Gainesville, and seventh warmest at Orlando. Several high temperature records and one low temperature record were tied or broken across the state (Appendix 2).
Table 1. August average temperatures and departures from normal (˚F) for selected cities.
| Station | Mean Temperature | Departure from Normal |
| Pensacola | 82.1 | +0.3 |
| Tallahassee | 81.9 | +0.1 |
| Jacksonville | 82.4 | +0.6 |
| Orlando | 82.8 | 0.0 |
| Tampa | 83.9 | +0.7 |
| Miami | 83.5 | -0.7 |
| Key West | 85.7 | +1.2 |
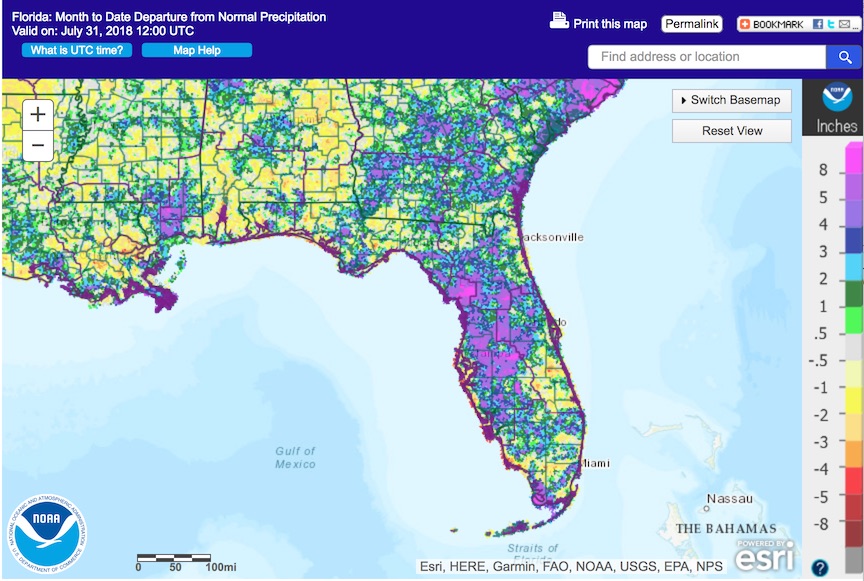
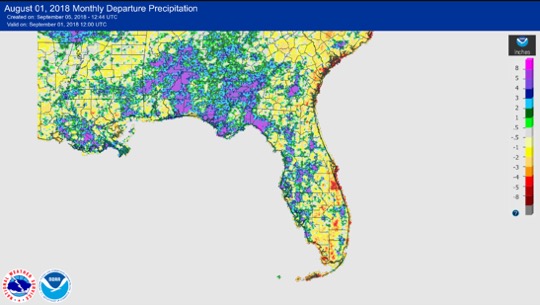
Rainfall totals in August were much above normal over most of the panhandle, near to above normal in the western one-third of the peninsula, and below normal in many areas of the eastern peninsula and Keys, with considerable local variability characteristic of the summer months in Florida (Figure 1). Station anomalies ranged from -5.51” at Melbourne to +6.83” at Tampa (Table 2 and Appendix 1) (Figure 1). A few 24-hour precipitation records broken for the month (Table 3).
Table 2. August precipitation totals and departures from normal (inches) for selected cities.
| Station | Total Rainfall | Departure from Normal |
| Pensacola | 7.54 | +0.78 |
| Tallahassee | 11.48 | +4.13 |
| Jacksonville | 7.68 | +0.88 |
| Orlando | 6.72 | -0.41 |
| Tampa | 14.60 | +6.83 |
| Miami | 9.58 | +0.70 |
| Key West | 1.89 | -3.49 |
Table 3. Select daily rainfall records (inches) broken during August. (Compiled from NOAA, NWS)
| Date | Location | Record | Last |
| 25 | Tallahassee | 2.68 | 2.11 in 2008 |
| 23 | Gainesville | 3.73 | 3.45 in 1993 |
| 25 | Tampa | 2.45 | 2.17 in 1939 |
Figure 1. A graphical depiction of the monthly rainfall departure from normal (inches) for May is given in the figure below (courtesy of NOAA, NWS).
ENSO-neutral conditions are present in the Pacific, with El Niño favored to develop.
Based on current data and forecast models, forecasters with the Climate Prediction Center (CPC) have issued an El Niño Watch. ENSO-neutral conditions currently are present, with sea-surface temperatures (SST) near to above average across the equatorial Pacific Ocean. The chance of El Niño development during the climatological boreal autumn (from now through the end of November) is rated at near 60% and near 70% during the climatological boreal winter (December-January-February). The CPC seasonal outlook favors above-normal temperatures and above-normal precipitation through September 2018. For the climatological autumn as a whole (through the end of November), there is equal probability of below-, near-, and above-normal temperatures and above-normal rainfall in Florida.
Hazardous Weather Events in August.
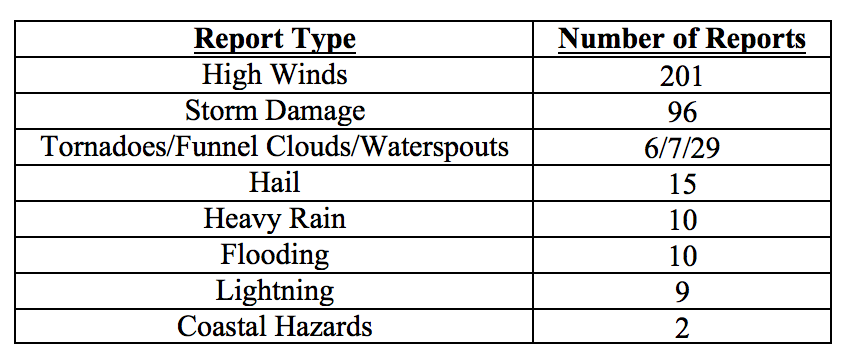
According the Local Storm Reports (LSRs) issued by the local National Weather Service (NWS) offices serving Florida, 208 instances of hazardous weather were reported across the state in August 2018.
Table 4. Breakdown of storm reports submitted in Florida during the month of August. (Compiled from Iowa State University/Iowa Environmental Mesonet.)
| Report Type | Number of Reports |
| Storm Damage | 47 |
| High Winds | 95 |
| Dense Fog | 0 |
| Hail | 12 |
| Tornadoes/Funnel Clouds/Waterspouts | 6 |
| Heavy Rain | 29 |
| Fire | 0 |
| Flooding | 7 |
| Lightning | 7 |
| Heat | 0 |
| Coastal Hazards/Rip Currents | 5 |
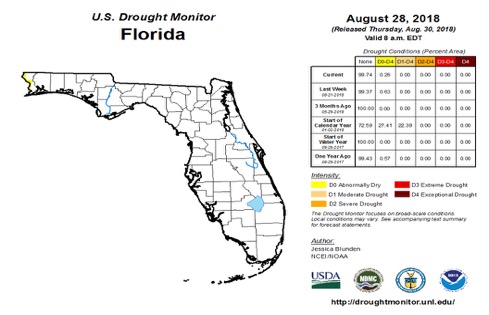
Drought-Related Impacts
At the end of August, according to the U.S. Drought Monitor, all of Florida was drought free, continuing conditions that have been present since the late spring. Western Escambia County, accounting for 0.26% of the state’s land area, had abnormally dry conditions in the second half of the month, owing to rainfall deficits over the last 30 to 60 days.
As of 5 September, the Lake Okeechobee water level was at 14.65 ft. above sea level, which is above average for this time of the year.
Agriculture-Related Impacts.
At the beginning of September, topsoil-moisture levels were at mainly adequate although about one-quarter of the state had surplus topsoil-moisture levels, mainly on the panhandle, and about two percent was short on topsoil moisture.
A major theme through the month has been the continuation of very wet soil conditions on the panhandle, which has hindered the cutting of hay and the harvest of peanuts at times. Flooded low-lying areas in the St. Johns River valley negatively impacted cattle pasture lands. Summer crops, including avocado, bitter melon, boniato, malanga, mango, and okra, were harvested; good conditions generally persisted for citrus, allowing spray schedules to be followed and grove maintenance performed. The preparation of land for fall vegetable cultivation was managed as conditions allowed and planting started.
Appendix 1
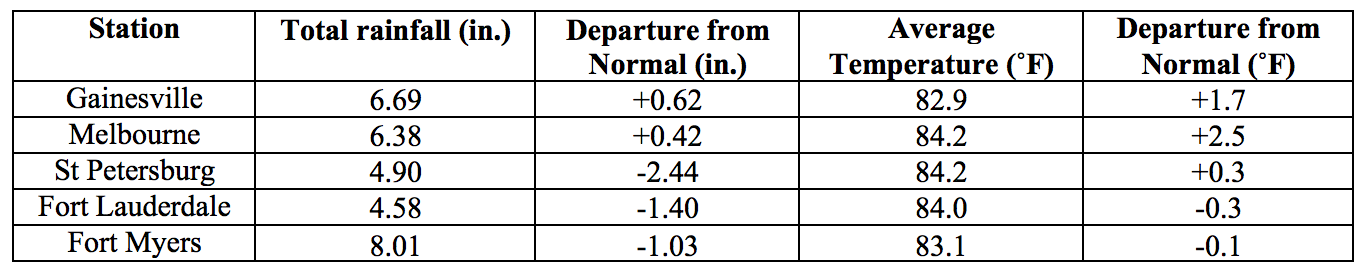
Additional May Departures from Normal Data for Florida Locations
| Station | Total rainfall (in.) | Departure from Normal (in.) | Average Temperature (˚F) | Departure from Normal (˚F) |
| Gainesville | 8.69 | +2.30 | 83.5 | +2.6 |
| Melbourne | 2.17 | -5.51 | 84.4 | +2.6 |
| Fort Lauderdale | 5.27 | -2.17 | 84.0 | -0.6 |
| Fort Myers | 11.06 | +0.92 | 82.7 | -0.7 |
Appendix 2
Select daily maximum and minimum temperature records (oF) tied or broken during May.
(Compiled from NOAA, NWS)
| Date | Station | Type | Value | Broken/Tied | Last |
| 2 | Tallahassee | Low Max | 78 | Tied | 78 in 1974 |
| 1 | Melbourne | High Min | 78 | Tied | 78 in 1983 |
| 2 | Melbourne | High Min | 78 | Tied | 78 in 1988 |
| 3 | Melbourne | High Min | 81 | Broken | 80 in 2014 |
| 4 | Melbourne | High Min | 82 | Tied | 82 in 1963 |
| 5 | Melbourne | High Min | 82 | Broken | 80 in 2017 |
| 6 | Melbourne | High Min | 81 | Broken | 79 in 2017 |
| 31 | Melbourne | High Min | 83* | Broken | 81 in 2003 |
| 22 | Tampa | High Min | 82 | Broken | 80 in 2016 |
| 27 | Tampa | Max | 95 | Tied | 95 in 1947 |
| 8 | Fort Lauderdale | High Min | 82 | Tied | 82 in 2012 |
| 15 | Fort Lauderdale | High Min | 82 | Tied | 82 in 2004 |
| 17 | Fort Lauderdale | High Min | 83 | Tied | 83 in 2013 |
| 2 | Key West | High Min | 85 | Broken | 84 in 2010 |
| 25 | Key West | High Min | 85 | Broken | 84 in 2015 |
| 26 | Key West | High Min | 85 | Tied | 85 in 2009 |
*This value ties the all-time highest minimum temperature ever recorded at Melbourne (records back to 1937), last set on 14 July 2017.
Prepared by Daniel J. Brouillette
Florida Climate Center
The Florida State University
Tallahassee, FL
Mean temperatures in October were much above normal statewide (Table 1 and Appendix 1). October 2018 was the warmest on record at Tampa and Key West (the second consecutive at both locations), as well as other less major stations, and in the top five warmest on record at several other stations. Several high temperature records were tied or broken across the state (Appendix 2).
Table 1. October average temperatures and departures from normal (˚F) for selected cities.
| Station | Mean Temperature | Departure from Normal |
| Pensacola | 74.8 | +5.2 |
| Tallahassee | 74.0 | +4.6 |
| Jacksonville | 74.2 | +3.7 |
| Orlando | 78.1 | +2.6 |
| Tampa | 80.0 | +3.9 |
| Miami | 81.3 | +1.5 |
| Key West | 83.6 | +3.3 |
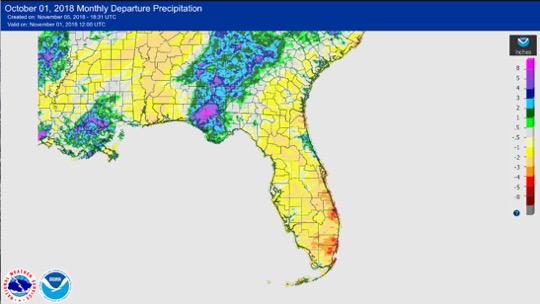
Rainfall totals in October were below normal except in the central and eastern panhandle (Figure 1). Rainfall was somewhat above normal in the central and eastern panhandle owing to Hurricane Michael on the 10th of the month. 24-hour precipitation records were broken for the month (Table 3).
Table 2. October precipitation totals and departures from normal (inches) for selected cities.
| Station | Total Rainfall | Departure from Normal |
| Pensacola | 3.75 | -1.49 |
| Tallahassee | 3.90 | +0.67 |
| Jacksonville | 1.30 | -2.63 |
| Orlando | 2.05 | -1.07 |
| Tampa | 1.42 | -0.84 |
| Miami | 1.76 | -4.57 |
| Key West | 3.19 | -1.74 |
Table 3. Select daily rainfall records (inches) broken during October. (Compiled from NOAA, NWS)
Figure 1. A graphical depiction of the monthly rainfall departure from normal (inches) for October is given in the figure below (courtesy of NOAA, NWS).
ENSO-neutral conditions are present in the Pacific, with El Niño favored to develop.
Based on current data and forecast models, forecasters with the Climate Prediction Center (CPC) continue with an El Niño Watch. ENSO-neutral conditions currently are present, with sea-surface temperatures (SST) above average across the equatorial Pacific Ocean. El Niño development is favored by the end of the climatological boreal autumn (from now through the end of November), and the chance of development is 70-75% during the climatological boreal winter (December-January-February). The CPC seasonal outlook favors above-normal temperatures and above-normal precipitation statewide through November 2018.
Hazardous Weather Events in October.
According the Local Storm Reports (LSRs) issued by the local National Weather Service (NWS) offices serving Florida, nnn instances of hazardous weather were reported across the state in October 2018. Of special interest was Hurricane Michael, which made landfall on the 10th as a high-end Category 4 storm near Mexico Beach and was the third-strongest storm ever to landfall on the United States in terms of minimum central pressure.
Table 4. Breakdown of storm reports submitted in Florida during the month of October. (Compiled from Iowa State University/Iowa Environmental Mesonet.)
| Report Type | Number of Reports |
| Storm Damage | 1 (excluding hurricane) |
| High Winds | 30 |
| Dense Fog | 0 |
| Hail | 0 |
| Tornadoes/Funnel Clouds/Waterspouts | 16 |
| Heavy Rain | 24 |
| Fire | 0 |
| Flooding | 0 (excluding storm surge/coastal) |
| Lightning | 0 |
| Heat | 0 |
| Coastal Hazards/Rip Currents | 1 |
Drought-Related Impacts
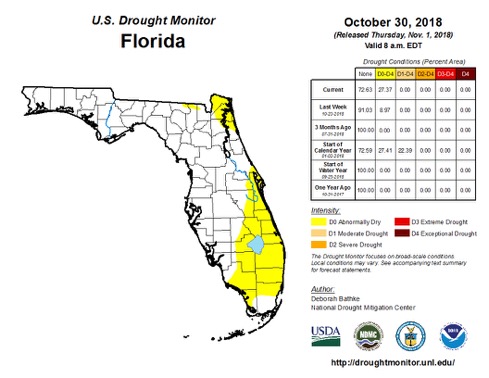
At the end of October, according to the U.S. Drought Monitor, abnormally dry conditions were present in a large area from the Space Coast, south along the coast to near Miami and southwest from there, as well as in northeast Florida in the Jacksonville area.
As of 5 November, the Lake Okeechobee water level was at 13.65 ft. above sea level, which is near average for this time of the year.
Agriculture-Related Impacts.
At the end of October, topsoil-moisture levels were at surplus or adequate over two-thirds of the state, with the remaining third very short or short. Citrus harvest got underway this month; the early harvest has looked good, according to reports, and groves and trees also look to be in good condition. By the end of the month, the irrigation of crop vegetables was required because of dry conditions developing. Cattle conditions remained good as of the end of the month. Hurricane Michael decimated the cotton crop, especially those plants that were already defoliated prior to the storm, with 10-90% crop loss depending on the county. Peanuts on the panhandle suffered significant losses; late-season yields were halved.
At the end of the month, two-thirds of the state had topsoil that were adequate or excess in terms of moisture, with the balance of the state short or very short.
Appendix 1
Additional September Departures from Normal Data for Florida Locations
| Station | Total rainfall (in.) | Departure from Normal (in.) | Average Temperature (˚F) | Departure from Normal (˚F) |
| Gainesville | 0.61 | -2.27 | 74.6 | +3.7 |
| Melbourne | 1.27 | -3.79 | 80.3 | +4.3 |
| Fort Lauderdale | 1.65 | -4.59 | 81.2 | +2.3 |
| Fort Myers | 0.78 | -2.01 | 79.5 | +1.6 |
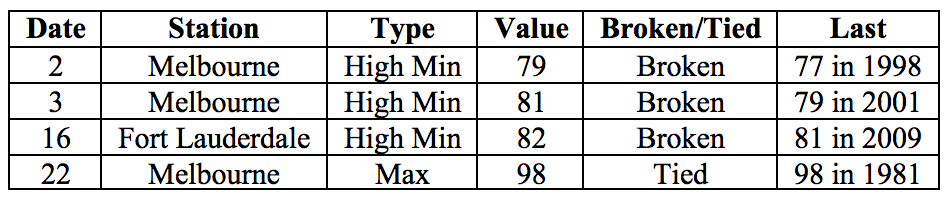
Appendix 2
Select daily maximum and minimum temperature records (oF) tied or broken during September.
(Compiled from NOAA, NWS)
| Date | Station | Type | Value | Broken/Tied | Last |
| 15 | Tallahassee | Max | 91 | Broken | 90 in 1990 |
| 17 | Tallahassee | Max | 90 | Tied | 90 in 1972 |
| 20 | Tallahassee | Max | 90 | Tied | 90 in 2005 |
| 10 | Jacksonville | Min | 79* | Broken | 76 in 1919 |
| 15 | Jacksonville | Max | 91 | Broken | 90 in 1990 |
| 16 | Jacksonville | Max | 91 | Broken | 92 in 2017 |
| 17 | Jacksonville | Max | 94 | Broken | 91 in 1989 |
| 17 | Jacksonville | Min | 75 | Tied | 75 in 1879 |
| 20 | Jacksonville | Max | 90 | Broken | 89 in 2006 |
| 10 | Orlando | Min | 77 | Broken | 75 in 2017 |
| 15 | Orlando | Min | 74 | Tied | 74 in 2009 |
| 19 | Orlando | Min | 73 | Tied | 73 in 1950 |
| 4 | Tampa | Max | 92 | Tied | 92 in 2007 |
| 15 | Tampa | Max | 92 | Tied | 92 in 1990 |
| 16 | Tampa | Max | 93 | Broken | 92 in 1959 |
| 18 | Tampa | Max | 92 | Broken | 90 in 1989 |
| 19 | Tampa | Max | 89 | Tied | 89 in 2017 |
| 16 | Miami | Min | 80 | Broken | 79 in 1933 |
| 21 | Miami | Max | 91 | Broken | 89 in 2006 |
| 4 | Key West | Min | 82 | Tied | 82 in 2013 |
| 12 | Key West | Min | 81 | Tied | 81 in 1941 |
| 15 | Key West | Min | 82 | Tied | 82 in 2014 |
| 17 | Key West | Max | 89 | Tied | 89 in 2009 |
| 19 | Key West | Min | 82 | Broken | 80 in 2004 |
| 21 | Key West | Max | 89 | Tied | 89 in 2007 |
| 24 | Key West | Max | 89 | Tied | 89 in 1990 |
| 25 | Key West | Min | 80 | Broken | 79 in 2010 |
| 26 | Key West | Min | 81 | Broken | 80 in 2015 |
| 27 | Key West | Min | 80 | Tied | 80 in 2003 |
*This value breaks the all-time highest minimum temperature ever recorded at Jacksonville for the month of October (records back to 1871); the previous record was 78 degrees, last set on 4 October 1964.
Building A, Suite 292
Tallahassee, FL 32306-2741
Phone: (850) 644-3417 | (850) 644-0719
climate@coaps.fsu.edu