


The Florida Climate Center serves as the primary resource for climate data, information, and services in the state of Florida.

The Florida Climate Center achieves its mission by providing climate monitoring, research, and expertise to be applied by the people, institutions, and businesses of Florida and the surrounding region.
We provide direct service by fulfilling requests for climate and weather data and information in a variety of formats.
We perform research that advances the understanding of the climate variability and changes of Florida and the surrounding region.
We provide outreach in presentations and at events aimed at a variety of groups, interests, and ages.
Prepared by Lydia Stefanova, Daniel J. Brouillette, and David F. Zierden.
Florida Climate Center
The Florida State University
Tallahassee, FL

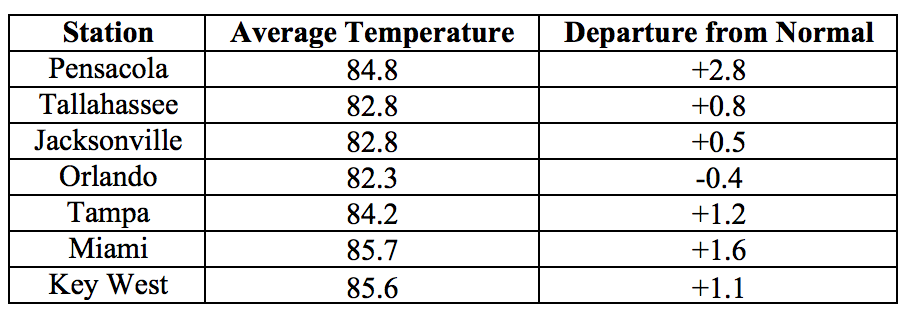
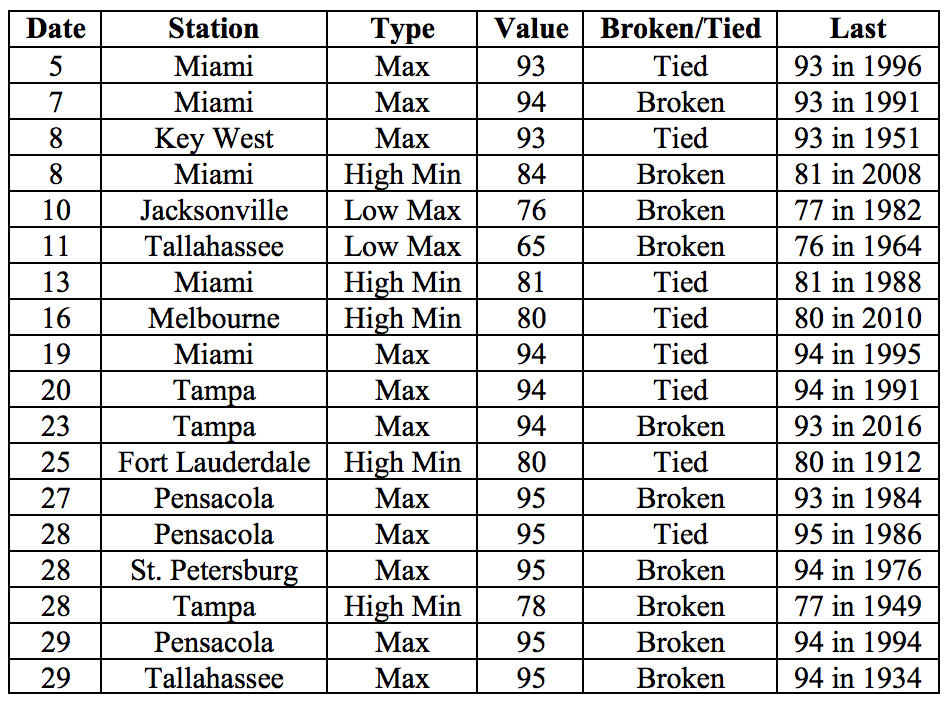
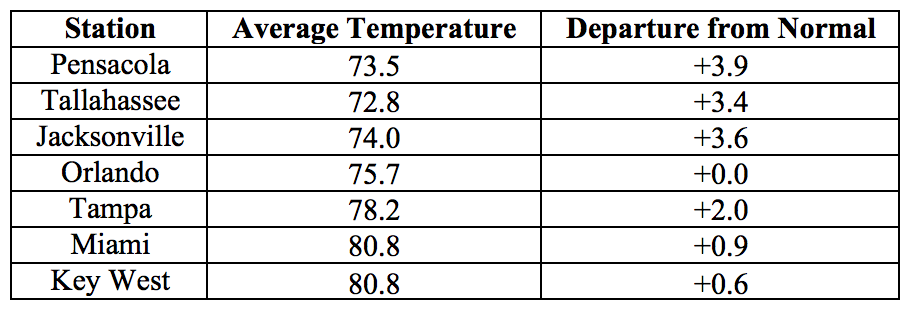
Average temperatures in July above normal for most the state. The departures from average temperatures in July 2017 were above normal across most of the state, ranging from -0.4˚F in Orlando to +2.8˚F in Pensacola (Table 1 and Appendix 1). Most reporting stations across the state had more than 21 days with high temperatures in the 90s. For Miami, July 2017 was not only the warmest July on record, but also the warmest of any month on record. It was also the 3rd warmest July for Pensacola, 5th for West Palm Beach, 6th for Tampa, and 10th for Key West. Several high minimum temperature records were tied or broken across the state (Appendix 2).
Table 1: July average temperatures and departures from normal (˚F) for selected cities.
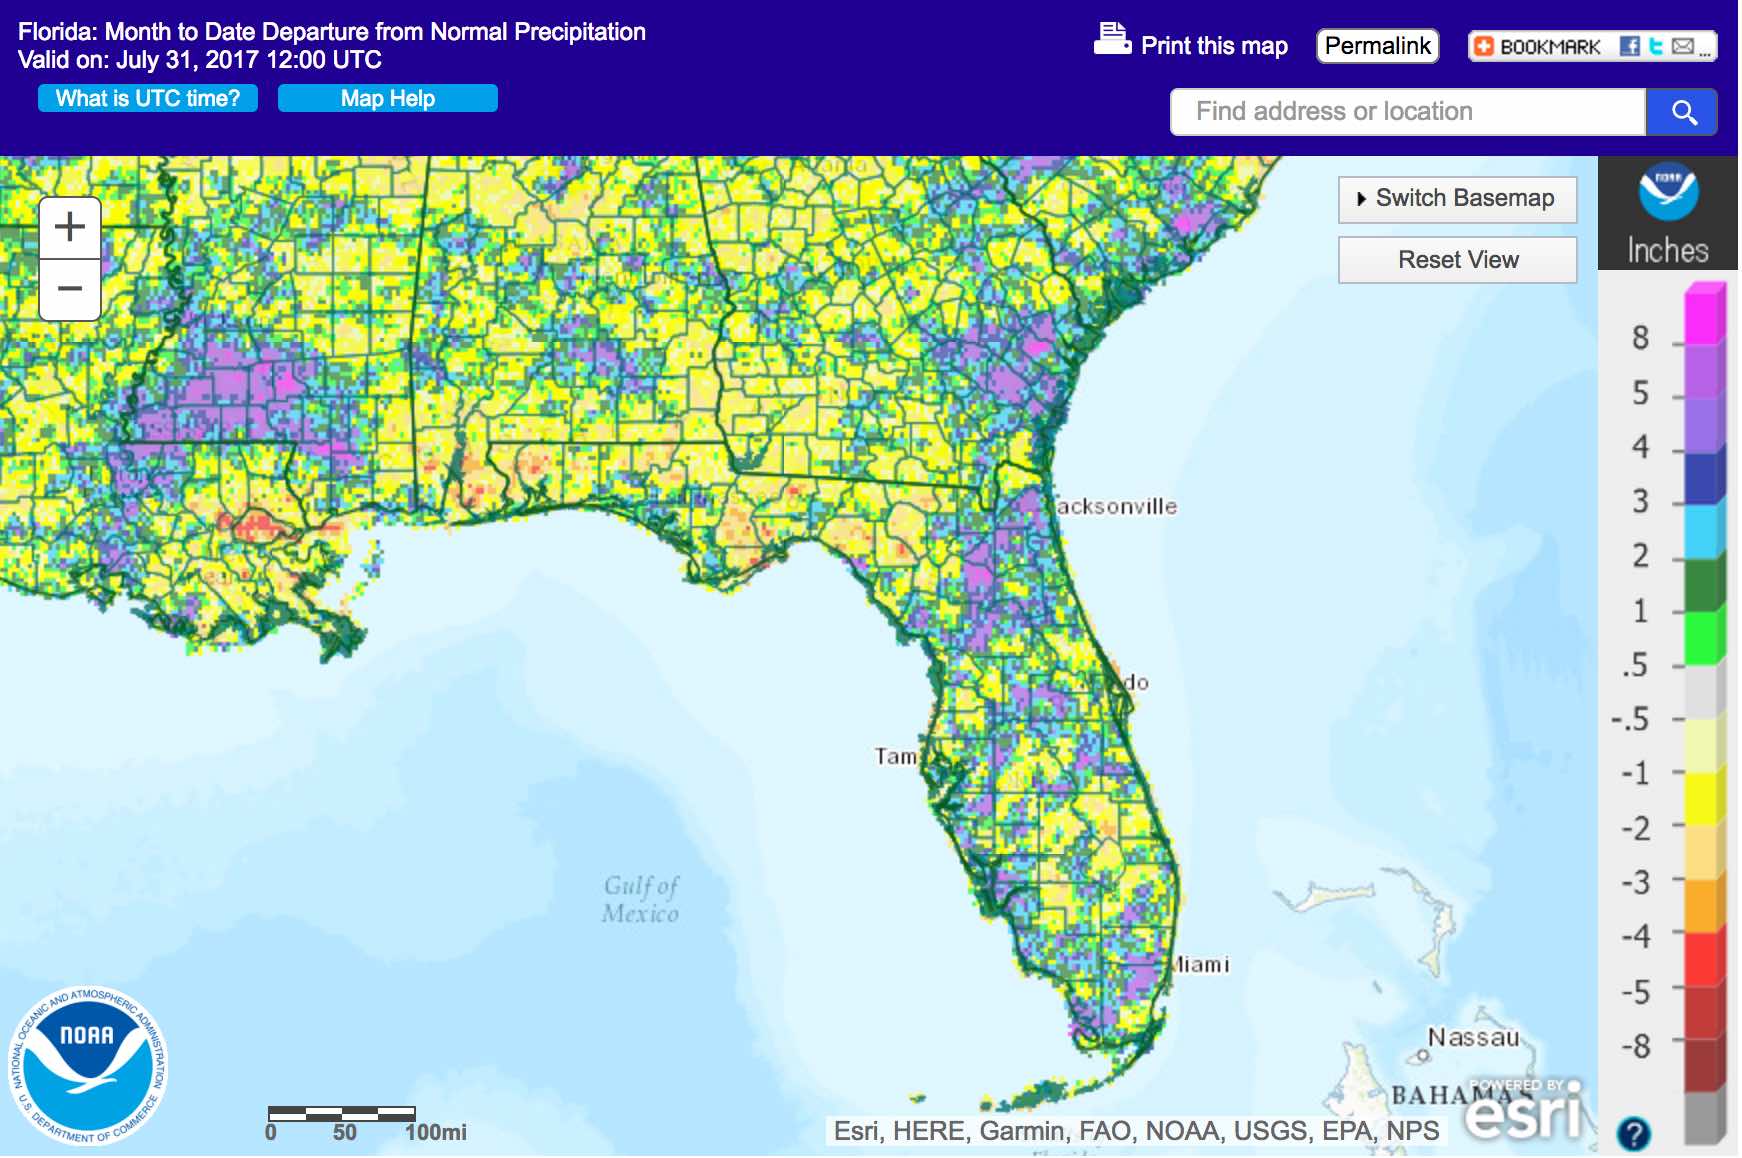
Rainfall totals in July were mixed across the state. Rainfall totals in July 2017 were below normal in most parts of the Panhandle and mixed in Peninsular Florida (Figure 1). Departures from normal roughly ranged from -1.90” in Pensacola to +10.63” in Gainesville (Table 2 and Appendix 1), although localized parts of the state saw rainfall totals that were as much as 4.00” below normal (Figure 1). July 2017 was the wettest on record for Gainesville – in fact, the rainfall from June to date at Gainesville has already eclipsed the record for the full summer period (June through August). This was also the 7th wettest July on record for Miami, and the 10th for Jacksonville. A number of 24-hour precipitation records broken for the month (Table 3).
Table 2: July precipitation totals and departures from normal (inches) for select cities.
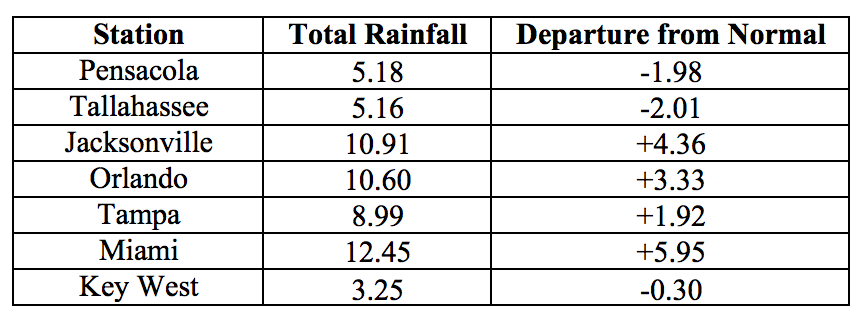
Table 3: Select daily rainfall records (inches) broken during July. (Compiled from NOAA, NWS).
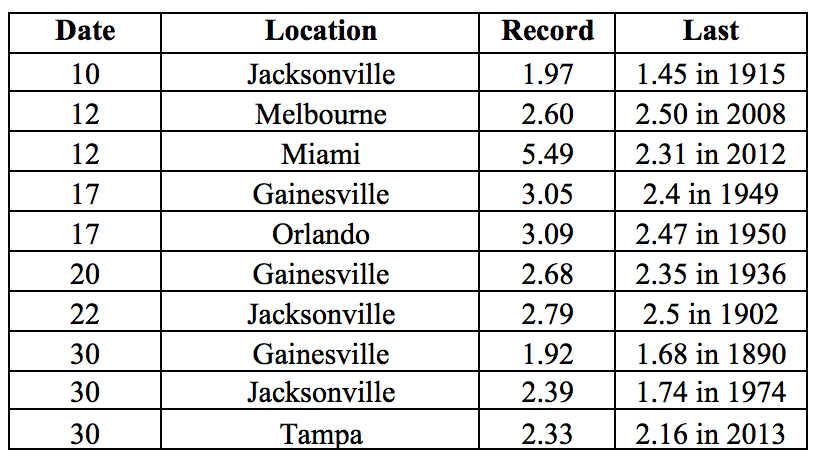
Figure 1: A graphical depiction of the monthly rainfall departure from normal (inches) for July is given in the figure below (courtesy of NOAA, NWS)
ENSO-Neutral Conditions are Present in the Pacific.
Based on current data and forecast models, the Climate Prediction Center (CPC) the ENSO alert system is currently set to “Not Active”. ENSO-neutral conditions are currently present, with sea surface temperatures (SST) near- to above-average across most of the central and east-central Pacific Ocean. ENSO-neutral conditions are favored to persist through into the winter. The CPC seasonal outlook favors above-normal temperatures for Florida through October 2017.
Hazardous Weather Events in July.
A total of 405 hazardous weather events were logged into the National Weather Service Local Storm Reports Database for Florida in July 2017 (see Table 4 for a breakdown by type).
Thunderstorms were widespread throughout the month, with strong winds resulting in localized storm damage, rainfall and flooding.
Wind damage, including downed trees power lines, was reported at different times in 30 counties. Several flooding events required road closures in localized areas, particularly in Duval County on the 30th of the month. Hail with diameter ranging from 0.25’’ to 1.25’’ was reported in Alachua, Broward, Duval, Hillsborough, Lake, Marion, Orange, Osceola, Palm Beach, Pasco, Pinellas, Polk, Putnam, Sarasota, St. Johns and Volusia Counties on different days throughout the months. Lightning strikes in July caused more than fifteen injuries, in Brevard, Broward, Duval, Martin, Palm Beach, Pinellas and Volusia Counties and two fatalities, in Brevard and Okaloosa Counties. Several lightning-caused house fires were reported as well.
Funnel clouds were observed in Kissimmee on the 8th, in Miami-Dade and West Palm Beach on the 16th, in Seminole, St. Lucie and near I95 in Martin County on the 17th, and off of Flagler Beach on the 23rd. Two brief tornadoes were seen in Orange County on the 8th and an EF-0 tornado briefly touched down near the coast in Duval County on the 23rd. A number of waterspouts were observed during throughout the month, including twenty sightings (some with multiple spouts) along the Florida Keys, eleven sightings near Miami and the Everglades, seven along the west-central coast, and four in the Panhandle.
Some ten to fifteen heat-related illnesses were reported by Miami Beach Ocean Rescue throughout the day on the 25th.
A cool front, uncommon for this time of the year, moved over the northern portion of the state in the last days of the month. The atmospheric instability created by its passing, combined with the warm air mass over the Gulf of Mexico, gave rise to a tropical depression which quickly turned into Tropical Storm Emily. In anticipation of heavy rain, a state of emergency was declared for 31 Florida counties. Emily made landfall near Tampa with tropical storm force winds reported from Collier to Manatee Counties, and proceeded northeastward across the Peninsula, bringing locally heavy rains to parts of central Florida.
Table 4: Breakdown of storm reports submitted in Florida during the month of July. (Compiled from Iowa State University/Iowa Environmental Mesonet)
Drought-Related Impacts.
The entire state was drought-free at the end of June, and remained drought-free throughout July (as of the latest US Drought Monitor Report, issued on July 27th). Water levels in Lake Okeechobee water by the end of the month were at 12.81 ft., which is below normal for this time of the year.
Agriculture-Related Impacts.
Topsoil levels across the state have held at mostly adequate throughout the state. Canals and ditches in the citrus growing area have filled up well. Growers have been doing light irrigation as needed. Pastures have benefitted from plentiful rainfall in most areas, and are in generally good condition. Cattle are seeking shade in the afternoon but are also in generally good condition. Cotton planting has been completed, and corn and tobacco are being harvested. Hay cutting is active, although some delays due to wet conditions have been encountered in Dixie, Lafayette, Levy, Osceola, Suwannee, Taylor, Volusia, and Walton Counties. Wet conditions in some fields have delayed application of needed weed and disease control agents and nitrogen supplementation. Sugar cane and rice in south Florida are developing well following adequate rains and plenty of sunshine, and progressing normally for this time of the year.
Appendix 1: Additional July departures from normal data for Florida locations.
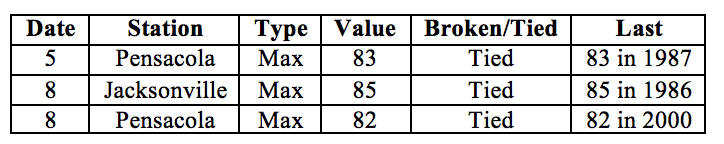
Appendix 2: Select daily maximum and minimum temperature records (° F) broken during July (compiled from NOAA, NWS).
Prepared by Lydia Stefanova, Daniel J. Brouillette, and David F. Zierden.
Florida Climate Center
The Florida State University
Tallahassee, FL
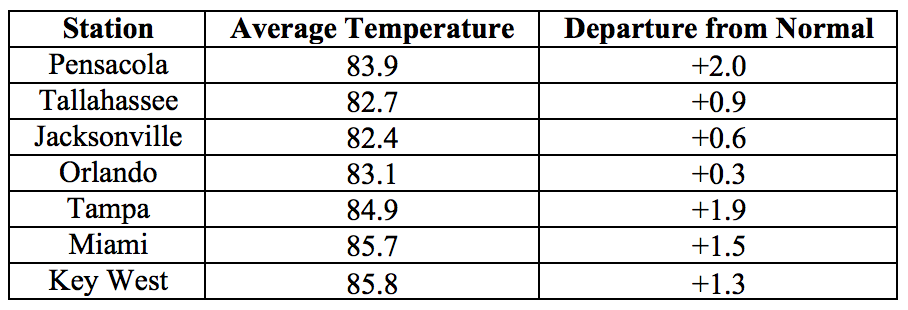
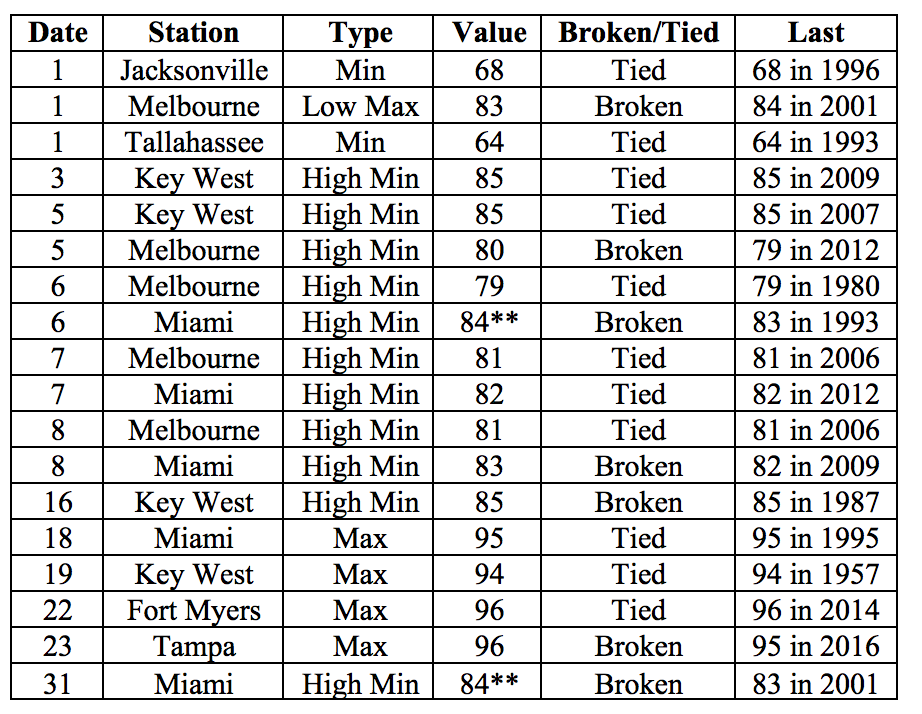
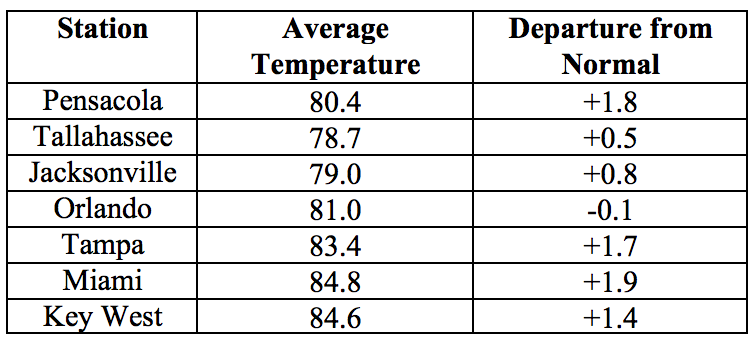
Average temperatures in August were above normal for most of the state. The departures from average temperatures in August 2017 were above normal across most of the state, ranging from -0.3˚F in Fort Lauderdale to +2.8˚F in Melbourne (Table 1 and Appendix 1). August 2017 was the warmest on record for Miami (for a second month in a row), 3rd warmest for Tampa, 5th for West Palm Beach, 9th for Key West, and 10th for Pensacola. Several temperature records were tied or broken across the state (Appendix 2).
Table 1: August average temperatures and departures from normal (˚F) for selected cities.
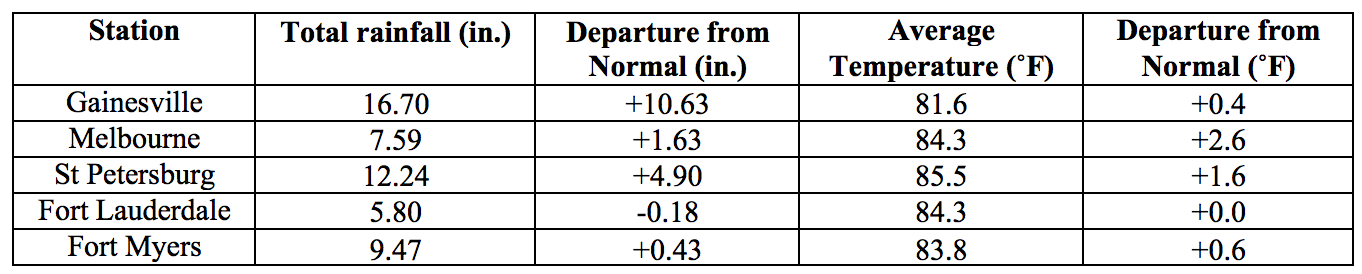
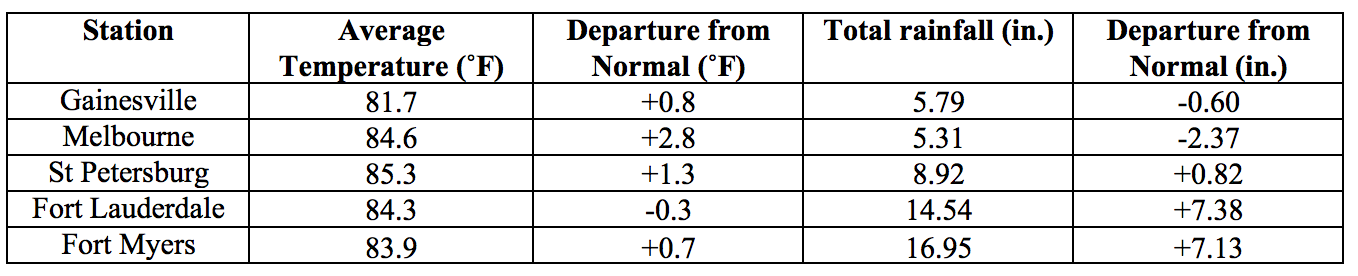
Rainfall totals in August were mixed. Rainfall totals in August 2017 were above normal in the western Panhandle and along most of the Gulf Coast, and below normal along most of the Atlantic Coast (Figure 1). Departures from normal rainfall at major reporting stations ranged from -3.15” in Key West to +12.78” in Pensacola (Table 2 and Appendix 1). August 2017 was the wettest on record for Fort Myers, and the 2nd wettest for Pensacola. A few 24-hour precipitation records broken for the month (Table 3).
Table 2: August precipitation totals and departures from normal (inches) for select cities.
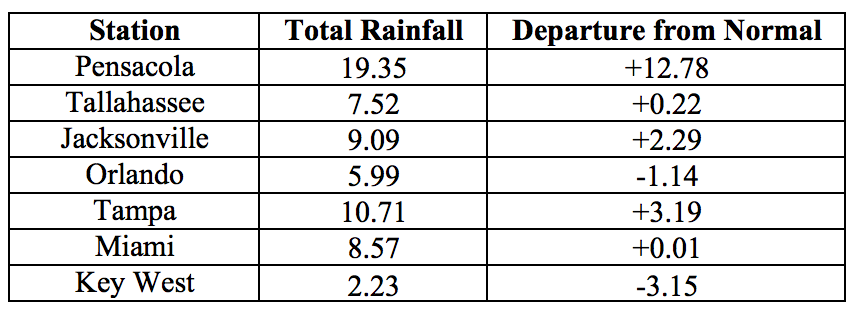
Table 3: Select daily rainfall records (inches) broken during August. (Compiled from NOAA, NWS).
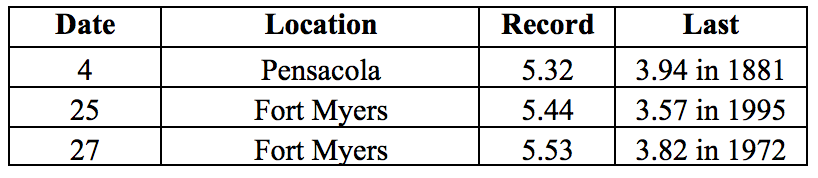
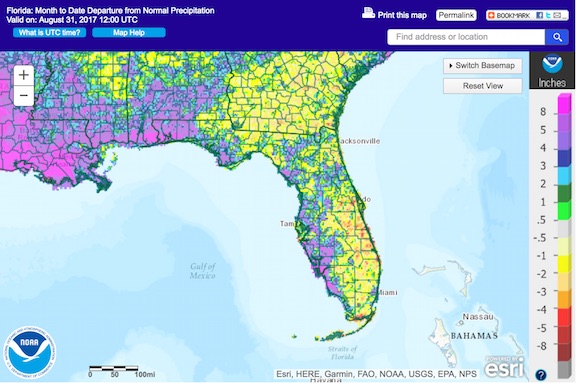
Figure 1: A graphical depiction of the monthly rainfall departure from normal (inches) for August is given in the figure below (courtesy of NOAA, NWS)
ENSO-Neutral Conditions are Present in the Pacific.
Based on current data and forecast models, the Climate Prediction Center (CPC) the ENSO alert system is currently set to “Not Active”. ENSO-neutral conditions are currently present, with sea surface temperatures (SST) near- to below-average across most of the central and eastern Pacific Ocean. ENSO-neutral conditions are favored to persist through the winter 2017-2018 season. The CPC seasonal outlook favors above-normal temperatures and above-normal precipitation for Florida through November 2017.
Hazardous Weather Events in August.
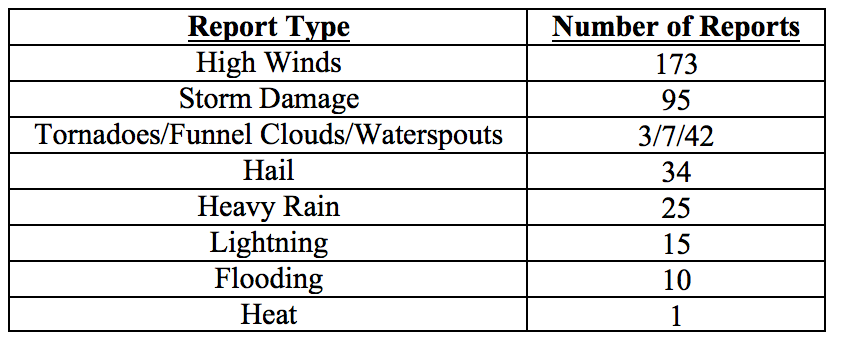
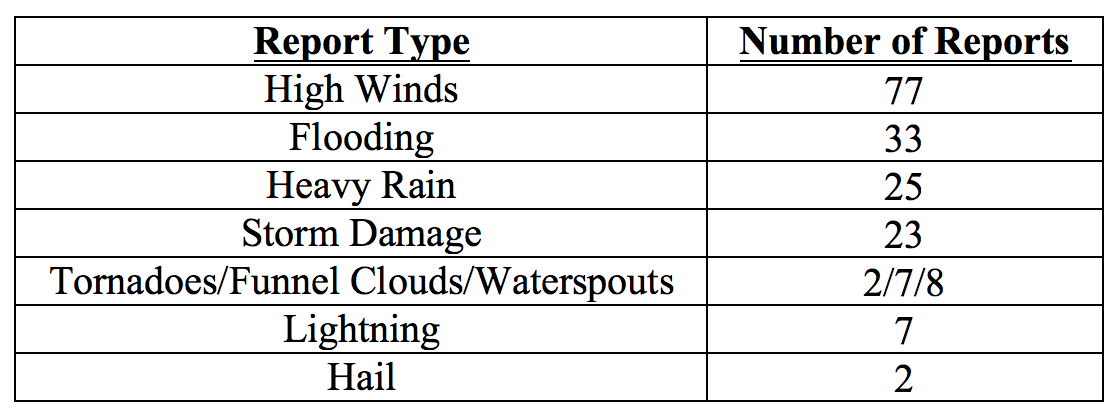
A total of 184 hazardous weather events were recorded in the NWS Local Storm Reports Database for August 2017. The largest proportion of these was reports of high winds, followed by reports of flooding, heavy rain, and storm damage (see Table 4 for a summary). Several waterspouts were observed on various dates along the Florida Keys, and near Palm Beach, Flagler Beach, Cocoa Beach and Homestead. Funnel clouds were observed in Escambia, Flagler, Okeechobee, Osceola, Palm Beach, and St. Johns Counties. An EF-0 tornado was confirmed in the Lower Florida Keys and on the 11th in Indian River County. Thunderstorm wind gusts and wind damage were reported on multiple days throughout the month. Some of the highest reported wind gusts included marine thunderstorm winds with gusts up to 53 mph on the first of the month in parts of south Florida, and a gust wind of 61 mph near St. Augustine on the 9th. A strong downburst with estimated winds of 50-60 mph near Cape Canaveral on the 3rd peeled off a pier roof and caused three minor injuries. Roof and carport damage was also reported on the 18th near Cocoa Beach. Several reports of downed trees and powerlines were logged in on various dates, in Alachua, Baker, Bradford, Brevard, Duval, Gadsden, Jackson, Jefferson, Nassau, St. Johns, Union, and Walton Counties. Twenty-four hour totals exceeding 5’’ were observed in Brevard, Miami-Dade, and Seminole Counties on the first of the month, and in Miami-Dade County on the following day and again on the 27th. Marion County reported 2.5’’ of precipitation falling over a period of 30 minutes on the 18th and Palm Beach – up to 3.36’’ in just over an hour on the 20th. Flash flood waters entering businesses and houses were reported on the first of the month in parts of Miami and Miami Beach, and in Collier County on the 25th. Flooding reports on various days throughout the month encompassed Baker, Broward, Collier, Duval, Escambia, Flagler, Putnam, Miami-Dade, and Santa Rosa Counties. These included street and road flooding and closures. In Collier, a person was rescued from a vehicle stranded in two feet of water on the 19th, and multiple vehicles were stranded due to flood waters on the 25th. Lightning reports through the month included three injuries (one in Miami-Dade and two in Santa Rosa County), and a handful of house fires (in Duval, Santa Rosa, and Volusia Counties).
Table 4: Breakdown of storm reports submitted in Florida during the month of August (Compiled from Southeast Regional Climate Center.)
Drought-Related Impacts.
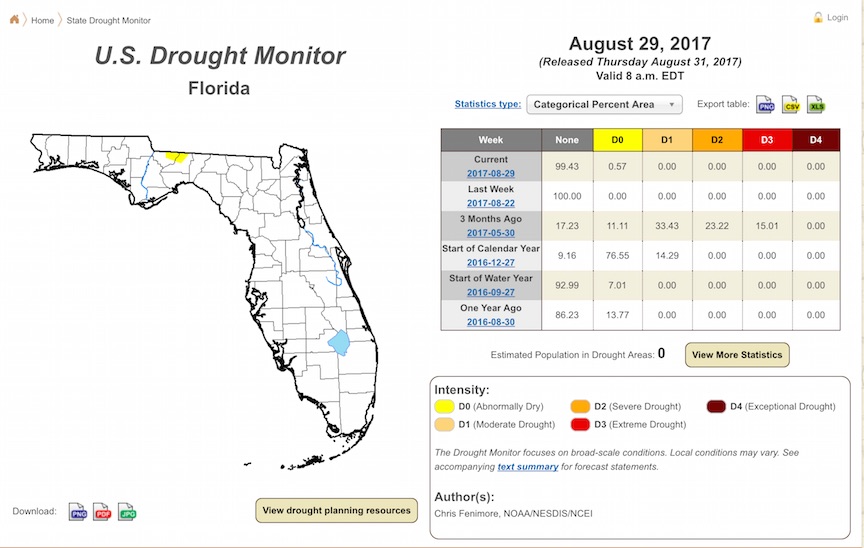
The entire state was drought-free at the end of July, and remained drought-free throughout the first three weeks of August. As of the latest US Drought Monitor Report, issued on August 29th), a small area of abnormally dry (D0) conditions has appeared over the northern portions of Gadsden and Leon Counties. In all, D0 conditions are affecting about half of a percent of the state’s area.
Water levels in lake Okeechobee at the end of the month were at 13.54 ft., which is still below normal for this time of the year.
Agriculture-Related Impacts.
By the end of July soil moisture levels were predominantly adequate. Soil moistures remained at predominantly adequate levels, with some surplus values and a few short values present as well. The citrus area received sufficient rainfall throughout the month. A few areas that received less rainfall required some irrigation; canals and ditches in most areas have had sufficient water for irrigation. Overall the citrus crop is in good condition. Cattle and pasture conditions have held in mostly good condition in most parts of the state, thanks to the adequate rainfall and warm temperatures. Too much rain in Bradford County caused a problem for some cattle, and too little rain in Holmes County affected pasture quality. Hay cutting in Bradford, Dixie, Lafayette, Levy, Suwannee, Taylor, and Volusia Counties was slowed down because of wet conditions. Disease pressure is becoming an issue for cotton producers in Holmes County and some peanut producers in Jackson County. Harvesting is underway for sweet potatoes in Madison County, for field corn in Jackson County, and for tobacco in Columbia and Lafayette Counties. Peanut harvesting has just begun in Dixie, Gilchrist, Levy, and Jackson Counties. Growers are reporting that sugarcane is in progressing well and is in good conditions. Vegetable growers in south Florida have been preparing fields for fall plantings, and have experienced some delays because of heavy rains.
Appendix 1: Additional August departures from normal data for Florida locations.
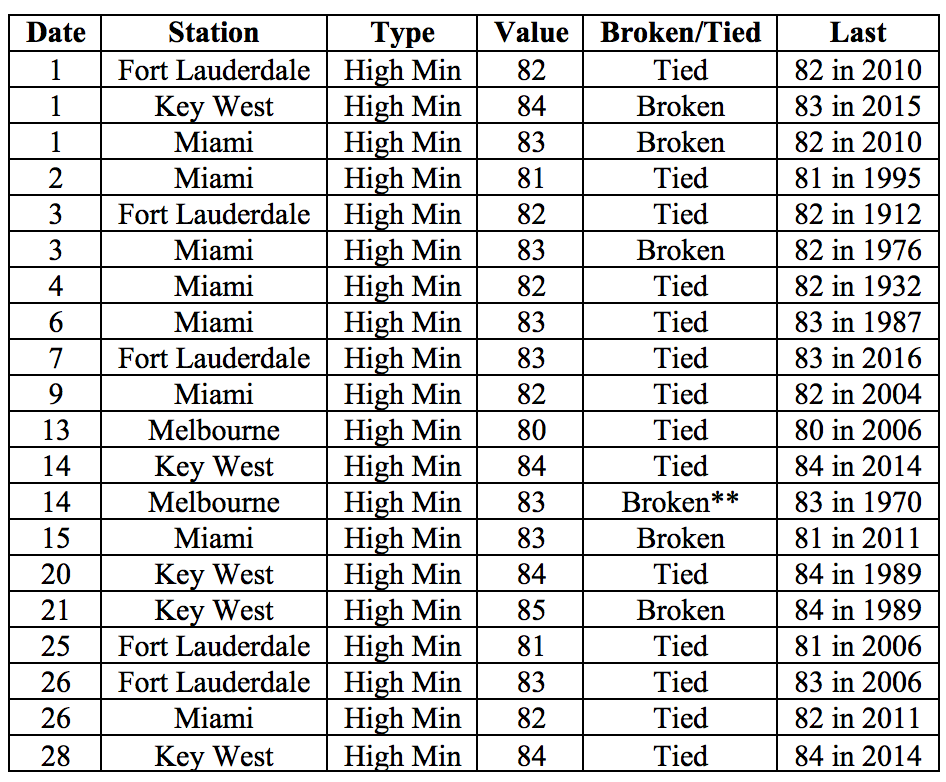
Appendix 2: Select daily maximum and minimum temperature records (° F) broken during August (compiled from NOAA, NWS). **Indicates an all time record.
Prepared by Lydia Stefanova, Daniel J. Brouillette, and David F. Zierden.
Florida Climate Center
The Florida State University
Tallahassee, FL
Average temperatures in September were above normal for most of the state. The departures from average temperatures in September 2017 were above normal across most of the state, ranging from -0.1˚F in Orlando to +1.9˚F in Miami (Table 1 and Appendix 1). September 2017 was the warmest on record for Miami (for a third month in a row), 2nd warmest for Tampa and West Palm Beach, 5th for Fort Myers, and 11th for Key West. Several temperature records were tied or broken across the state (Appendix 2).
Table 1: September average temperatures and departures from normal (˚F) for selected cities.
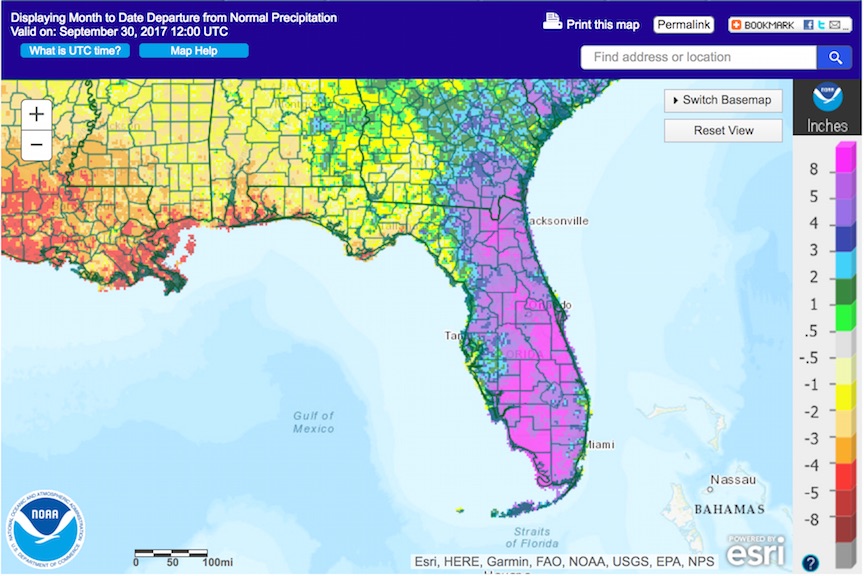
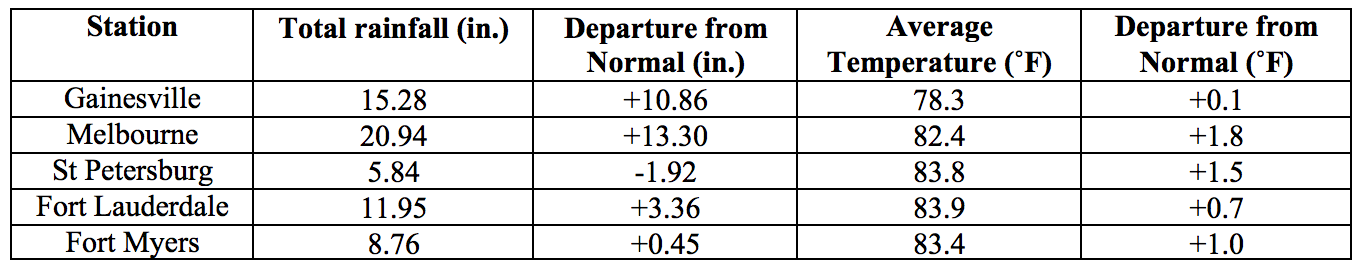
Rainfall totals in September were mixed across the state. Rainfall totals in September 2017 were below normal in most parts of the Panhandle and above normal in the majority of peninsular Florida and the Florida Keys (Figure 1). Departures from normal ranged from -1.92” in St. Petersburg to +8.03” in Orlando (Table 2 and Appendix 1), although localized parts of the state saw rainfall totals that were as much as 15” or more above normal (Figure 1). Overall, September 2017 was the 3rd wettest on record for Gainesville, and 4th wettest for Orlando. Several 24-hour precipitation records broken for the month (Table 3). In addition, Gainesville reported a record 2-day rainfall total of 12.40” from Hurricane Irma between the 10th and 11th, which broke the old records of 11.81” from Hurricane Four in 1894 and 10.42” from Tropical Storm Debby in 2012.
Table 2: September precipitation totals and departures from normal (inches) for select cities.
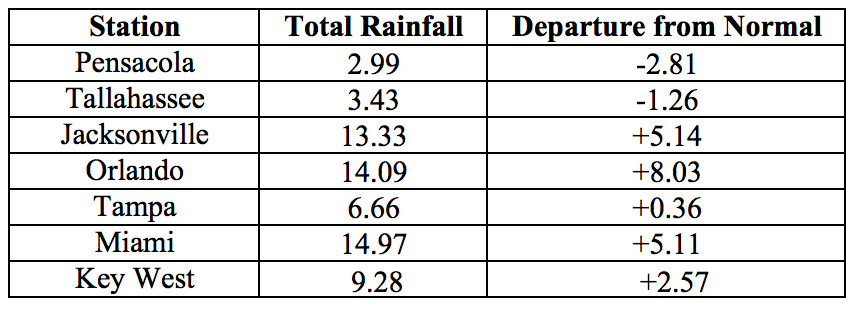
Table 3: Select daily rainfall records (inches) broken during September. (Compiled from NOAA, NWS).
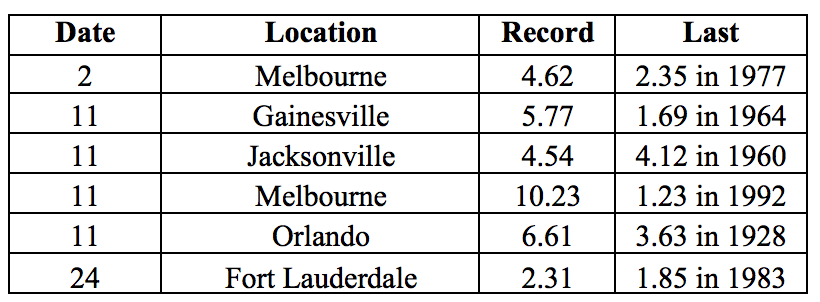
Figure 1: A graphical depiction of the monthly rainfall departure from normal (inches) for September is given in the figure below (courtesy of NOAA, NWS)
ENSO-Neutral Conditions are Present in the Pacific.
Based on current data and forecast models, the Climate Prediction Center (CPC) the ENSO alert system status is set to La Niña Watch. ENSO-neutral conditions are currently present, with sea surface temperatures (SST) near- to below-average across the central and eastern Pacific Ocean. Forecast models increasingly favor the development of La Niña conditions during the fall and winter of 2017-2018. Taking into account the ENSO forecast and long-term trends, the CPC seasonal outlook favors above-normal temperatures and below-normal precipitation for Florida through November 2017.
Hazardous Weather Events in September.
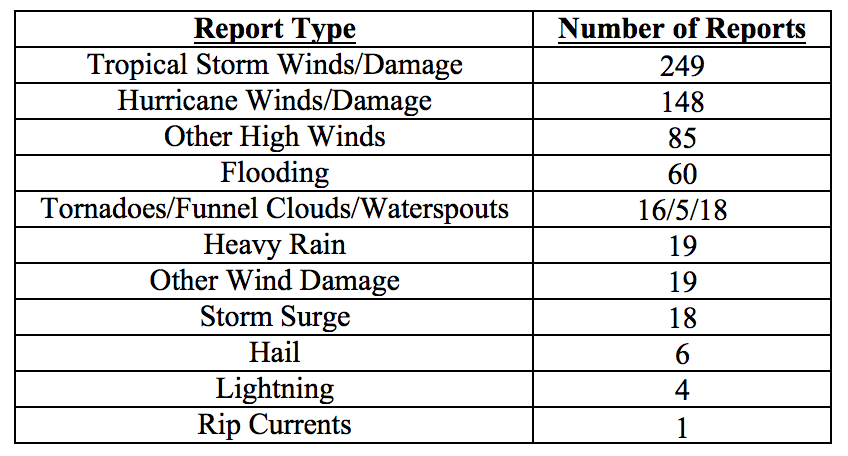
There were a total of 648 hazardous weather events recorded in the National Weather Service Local Storm Reports database for September 2017 (see Table 4 for breakdown by type).
The overwhelming majority of these reports (about 85%) were associated with the approach and passage of Hurricane Irma, between September 9th and 11th. Major Hurricane Irma made three separate landfalls on Florida. The first occurred at Cudjoe Key (Monroe County in the lower Keys), on 10 September at 9:10 AM EDT, with 130 mph maximum sustained winds (Category 4). This landfall was the first of a major hurricane on Florida since Hurricane Wilma made landfall at Cape Romano (Collier County) on 24 October 2005. The second Irma landfall was later that same day at 3:35 PM EDT at Marco Island (Collier County), with 115 mph maximum sustained winds (Category 3). The third was one-half hour later at Naples, with 115 mph maximum sustained winds. Irma’s center then moved inland about 25 miles, weakening to Category 2 strength, before moving in a generally north-northwest direction. As it passed just east of Tampa on the night of the 10th, the storm maintained Category 1 strength. By the time the center reached the Big Bend region around dawn on the 11th, Irma had weakened to tropical-storm strength. By the afternoon of the 11th, the center had exited the state into Georgia. Commensurate with its strength, Irma produced considerable property damage; it is still much too early to provide an estimate of the monetary value of the damage. This damage was seen throughout most of the peninsula but was severe in areas in the southwest and devastating in portions of the Keys. At the peak of the storm, 60 percent of electric power customers statewide had no service. Much of the damage resulted from strong winds. Hurricane-force wind gusts were registered as far north as the First Coast. The highest wind gust that was recorded in the state was 142 mph at Naples Airport on the 10th. However, it should be noted that station-level peak wind-gust readings are often missed during storms of this magnitude because of instrument failure. Damage also resulted from storm-surge flooding along the Keys and the eastern coast. In fact, storm surge reached a record level at Jacksonville, eclipsing the level seen during Hurricane Dora in 1964. By contrast, a large expanse of negative storm surge was seen along much of the western coast. Rainfall was seen throughout all the state except the extreme western panhandle. The greatest rainfall totals, 15-25”, were observed in the extreme south of the peninsula and in the upper and middle Keys. Throughout the remainder of the peninsula, 11-15” of rain were common along and east of the path of the storm center. Totals tapered gradually with westward distance from that path. Major to record flooding occurred on many streams, ostensibly because of the storm’s wide expanse. Seventeen tornadoes have been confirmed in Florida on account of Irma. All of these occurred east of the center path and were most numerous from the middle of the peninsula northward. At this time, it is believed that seventy-two persons perished in Florida as a result of Irma, mainly by drowning.
Table 4: Breakdown of storm reports submitted in Florida during the month of September (Compiled from Iowa State University/Iowa Environmental Mesonet.)
Drought-Related Impacts.
At the end of August, a small area of abnormally dry (D0) conditions had appeared over the northern portions of Gadsden and Leon Counties, affecting about half of a percent of the state’s area. By the first week of September the D0 conditions were eliminated and the entire state became drought-free, and remained drought-free for the rest of the month.
At the end of the month, Lake Okeechobee water levels were at 16.43 ft., which is well above average for this time of the year. The US Army Corps of Engineers, which is responsible for managing of Lake Okeechobee flows, has been doing regular dam safety inspections and releasing as much water as possible while trying to ensure there is no flooding downstream. These needed discharges from the lake have resulted in a large plume of turbid nutrient-rich fresh water entering the Gulf and are causing some concern about hypoxia and potential for algal blooms.
Agriculture-Related Impacts.
Throughout the month soil moisture were at mostly adequate to surplus levels, with the proportion of surplus values increasing following the passage of Irma.
Hurricane Irma passed on the western side of the citrus growing area, bringing heavy winds and excessive precipitation to the entire region. Normal grove operations were suspended for a number of days in the aftermath, as groves and access roads were flooded or washed out. Growers were pumping standing water out of groves, attempting to get canals and ditches back to normal levels, repairing potholes, and surveying grove and fruit damage.
Fall vegetable growers delayed planting in advance of Irma. In fields that had already been planted, significant losses were reported in Bradford, Collier, Glades, Hendry, Hillsborough, Lee, and Saint Lucie Counties. Losses affected plantings of strawberries, peppers, okra, cabbage, collards and peas, as well as laid plastic. In the following weeks, growers were pumping water out of flooded areas, laying new plastic and replanting crops that were destroyed.
Pasture and cattle conditions across the state have been mostly in good condition, although many pastures were flooded. Herds were reported very thin in Brevard and Indian River Counties. Some milk losses were reported in Lafayette County due to power outages. A large herd in St. Lucie County was reported standing in knee-deep water, and had to be moved to higher ground. In multiple counties there is still standing water reported in low-lying pastures, and mosquito populations have increased significantly.
Peanut and hay producers stepped up harvesting as much as possible in the few days ahead of the hurricane. Significant damage to cotton has been reported in Jackson, Holmes, Lafayette, and Madison Counties. Damage to peanuts was reported in Dixie, Gilchrist, Jackson and Levy Counties, and to corn – in Columbia County. Extended delays in peanut harvest due to excess moisture are being reported in Dixie, Gilchrist, Holmes, Jackson, Lafayette, and Levy Counties. Almost all sugarcane was flooded and blown down in Glades, Hendry and Palm Beach Counties, but is beginning to stand up.
Appendix 1: Additional September departures from normal data for Florida locations.
Appendix 2: Select daily maximum and minimum temperature records (° F) broken during September (compiled from NOAA, NWS).
Prepared by Lydia Stefanova, Daniel J. Brouillette, and David F. Zierden.
Florida Climate Center
The Florida State University
Tallahassee, FL
Average temperatures in October were above normal for most of the state. The departures from average temperatures in October 2017 were above normal across most of the state, ranging from -1.0˚F in Fort Lauderdale to 3.9˚F in Pensacola (Table 1 and Appendix 1). Despite the above-normal average temperatures, a strong cold front on the 28th and 29th of the month brought significantly lower temperatures, with overnight lows in some locations in the panhandle as well as some interior locations in the northern part of the peninsula dipping into the mid-30s. October 2017 was the 5th warmest on record in Miami, and 8th warmest in Tampa. A number of temperature records were tied or broken across the state (Appendix 2).
Table 1: October average temperatures and departures from normal (˚F) for selected cities.
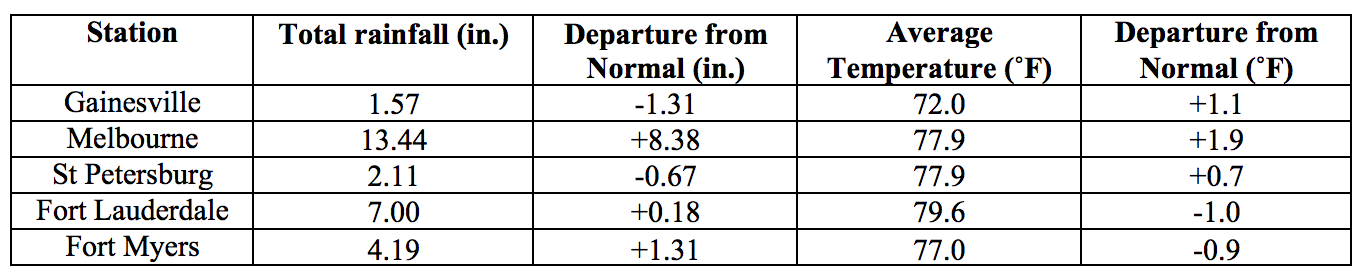
Rainfall totals in October were mixed across the state. Rainfall totals in October 2017 were above normal in the eastern part of the Florida Peninsula and in the extreme western part of the Panhandle, and below normal in the remainder of the state (Figure 1). Departures from normal roughly ranged from -1.31” in Gainesville to 8.38” in Melbourne (Table 2 and Appendix 1), though localized parts of the state saw rainfall totals that were as much as 3.00” below normal to more than 8.00” above normal (Figure 1). Significant rainfall amounts in South Florida were associated with tropical storm Philippe near the end of the month, with localized daily totals exceeding 8 inches reported in several locations in Palm Beach County. A small number of 24-hour precipitation records broken for the month (Table 3).
Table 2: October precipitation totals and departures from normal (inches) for select cities.
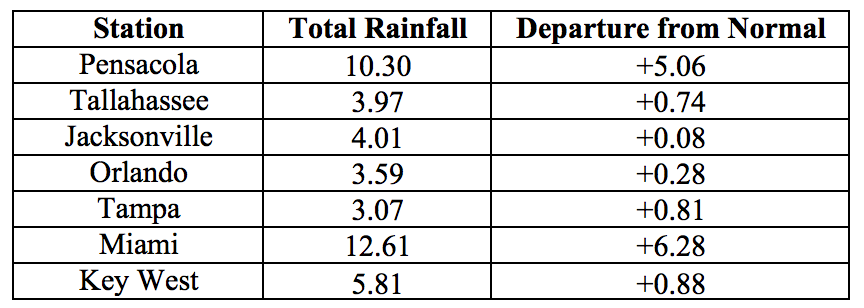
Table 3: Select daily rainfall records (inches) broken during October. (Compiled from NOAA, NWS).
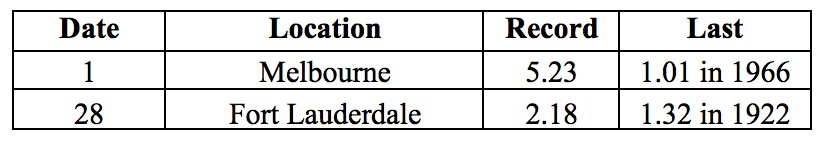
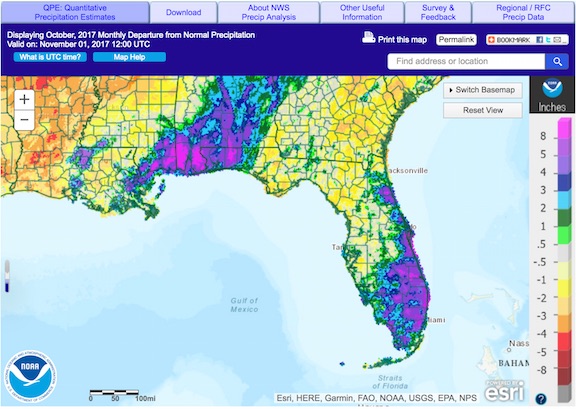
Figure 1: A graphical depiction of the monthly rainfall departure from normal (inches) for October is given in the figure below (courtesy of NOAA, NWS)
ENSO-Neutral Conditions are Present in the Pacific.
Based on current data and forecast models, the Climate Prediction Center (CPC) the ENSO alert system status is set to La Niña Watch. ENSO-neutral conditions are currently present, with sea surface temperatures (SST) near- to below-average across the central and eastern Pacific Ocean. Forecast models favor the development of La Niña conditions during the fall and winter of 2017-2018. Taking into account the ENSO forecast and long-term trends, the CPC seasonal outlook favors above-normal temperatures and below-normal precipitation for Florida through January 2018.
Hazardous Weather Events in October.
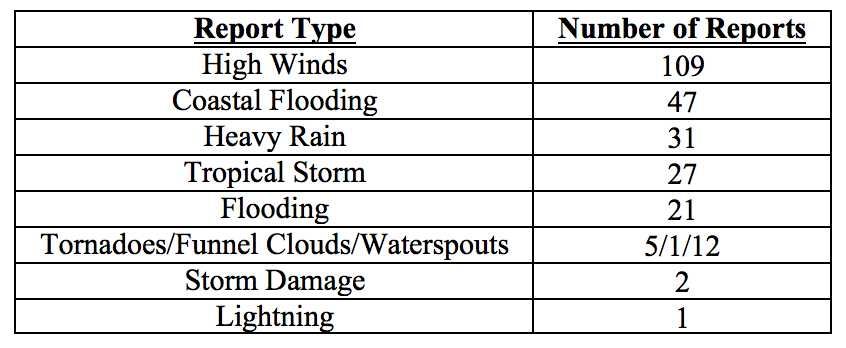
There were a total of 256 hazardous weather reports issued in Florida in October 2017. Most of these were reports of high winds, mainly in South Florida between the 3rd and 5th of the month, and between the 28th and 29th. High tides and coastal flooding were observed between the 1st and 7th of the month in Brevard, Broward, Collier, Duval, Flagler, Miami-Dade, Monroe, Palm Beach, Pinellas, and St. Johns Counties. On October 8, as tropical storm Nate made landfall near Biloxi, MS, tropical storm winds and damage to trees and powerlines were reported in Bay, Escambia, Holmes, Okaloosa, Santa Rosa, Walton, and Washington Counties. Storm surge and coastal flooding on that day were seen in Escambia, Gulf, Santa Rosa, and Walton Counties. Tropical storm winds were also reported on October 29th From Key Largo and Miami-Dade. There were four tornadoes observed on that day, one in Miami-Dade and three in Palm Beach County, with some reports of damage to roofs, awnings, and mobile homes.
Table 4: Breakdown of storm reports submitted in Florida during the month of October (Compiled from Iowa State University/Iowa Environmental Mesonet.)
Drought-Related Impacts.
The state has remained drought-free since the previous month. At the end of the month, Lake Okeechobee water levels were very high, at 17.01 ft., requiring continuing heavy discharges. As the end of October typically marks the beginning of the dry season, it is expected that water levels in the lake will not peak further.
Agriculture-Related Impacts.
Throughout the month topsoil moisture levels were at mainly adequate to surplus, although a few short values were also reported.
The citrus growing area started the month with continued hurricane cleanup and repairs, and was gradually resuming normal grove operations. Early harvest of oranges, tangerines, and grapefruit for the fresh market has begun. Canals and ditches have sufficient water for irrigation, and irrigation was being run in areas with below-average rainfall. Cattle and started the month in mostly good to fair condition, and have improved as the month went on. Excess moisture has been a problem for fields in the southern portion of the state. With some pastures underwater for a prolonged duration, some producers in Okeechobee County have begun feeding supplements early. Winter pastures are being planted in Jackson County. Hay cutting was reported in Dixie, Jackson, Osceola and Walton Counties. Heavy rains temporarily delayed sugarcane harvest in Glades, Hendry, and Palm Beach Counties, but the harvest was resumed in the drier parts. Wet conditions have prevented hay cutting in Volusia County, raising concern of potential shortages if conditions fail to improve. Peanut yield and quality has been negatively impacted in Lafayette County by low moisture conditions, and in Dixie, Jackson, Gilchrist, Holmes, Suwannee and Washington Counties by excess moisture Jackson County is reporting low cotton yields and cotton damage from heavy wind and rain was reported in Washington County.
Appendix 1: Additional October departures from normal data for Florida locations.
Appendix 2: Select daily maximum and minimum temperature records (° F) broken during October (compiled from NOAA, NWS).
Prepared by Lydia Stefanova, Daniel J. Brouillette, and David F. Zierden.
Florida Climate Center
The Florida State University
Tallahassee, FL
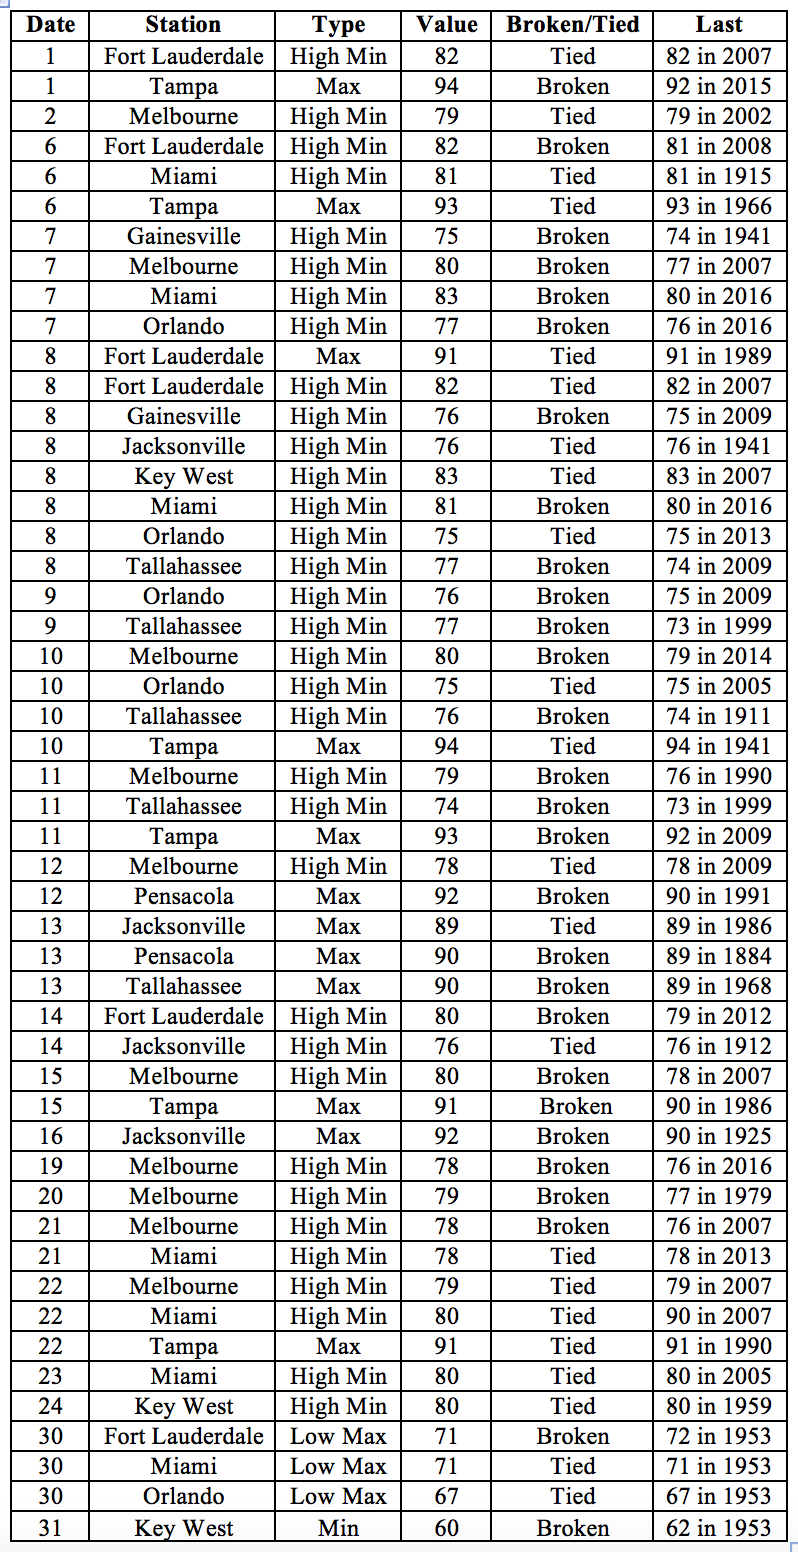
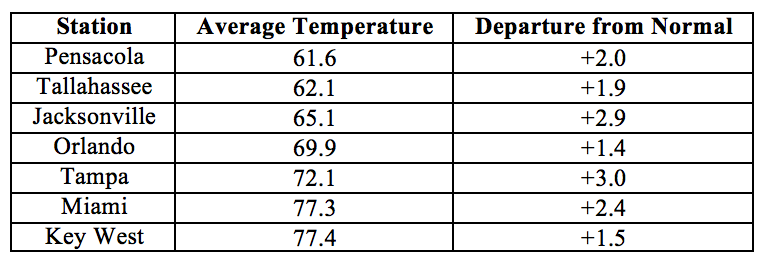
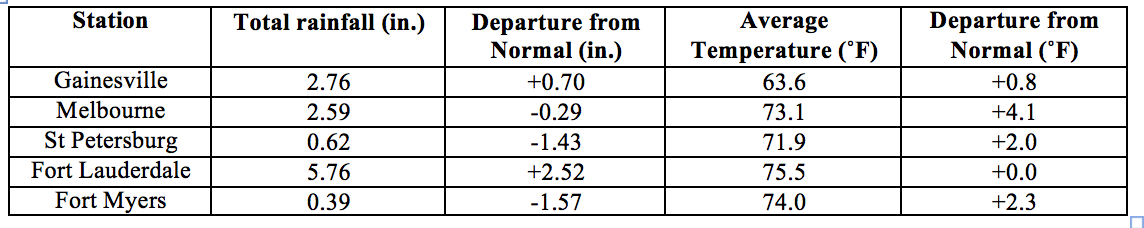
Average temperatures in November were above normal for most of the state. The departures from average temperatures in November 2017 were above normal for most of the state, ranging from 0˚F in Fort Lauderdale to +4.1˚F in Melbourne (Table 1 and Appendix 1). November 2017 was the warmest on record in Jacksonville, 3rd warmest in Miami and Orlando, 7th warmest in Fort Myers, and 9th warmest in Tampa. The fall season (September through November) for Miami tied the warmest average temperature record set back in 1986. The average fall (September through November) season temperatures in Miami were 81.0F, tying the record set back in 1986. (Official records at Miami have been kept since 1895.) A few high temperature records were tied across the state for the month (Appendix 2).
Table 1: November average temperatures and departures from normal (˚F) for selected cities.
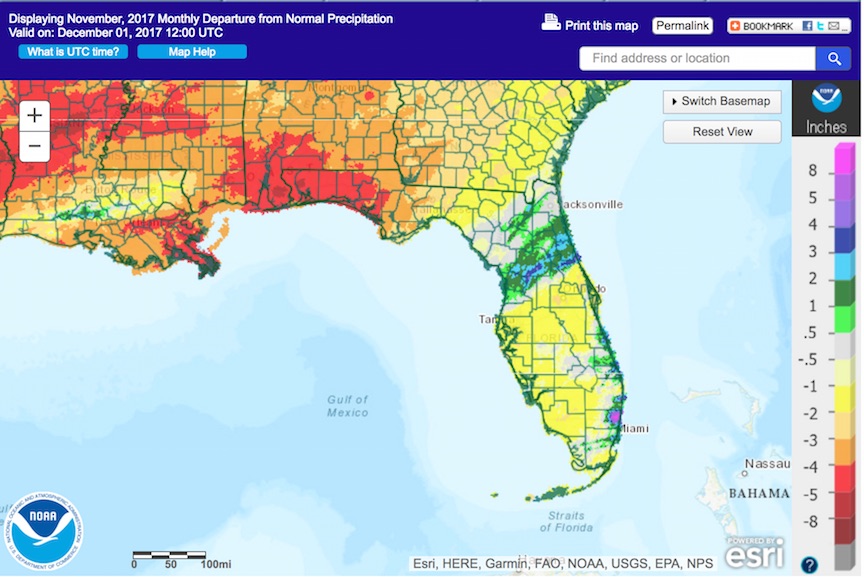
Rainfall totals in November were mixed across the state. Rainfall totals in November 2017 were below normal for the Panhandle and most of Peninsular Florida (Figure 1), although some areas in the northern portion of the Peninsula and along the Atlantic coast were above normal. Departures from normal roughly ranged from -4.65” in Pensacola to +2.52” in Fort Lauderdale (Table 2 and Appendix 1), although localized parts of the state saw rainfall totals that were 5.00” or more below normal to 8.00” or more above normal (Figure 1). November 2017 was the driest on record for Pensacola and 10th driest for Orlando and Tampa. Melbourne had the wettest fall season on record, with 36.97’’ of total rainfall measured at the Melbourne international airport, beating the previous record of 32.95’’ set in 1999. Melbourne’s fall season rainfall was a whopping 21.39’’ above normal. (Official records at Melbourne have been kept since 1937.) A few 24-hour precipitation records were broken across the state for the month (Table 3).
Table 2: November precipitation totals and departures from normal (inches) for select cities.
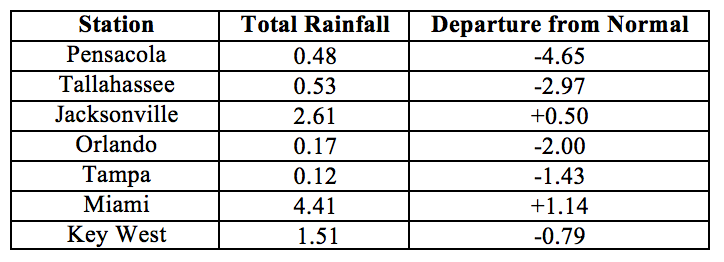
Table 3: Select daily rainfall records (inches) broken during November. (Compiled from NOAA, NWS).
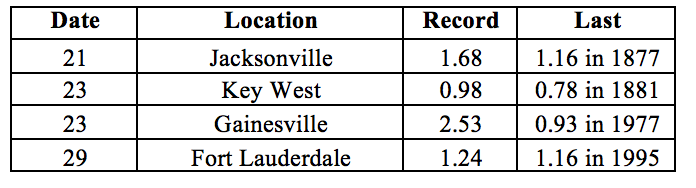
Figure 1: A graphical depiction of the monthly rainfall departure from normal (inches) for November is given in the figure below (courtesy of NOAA, NWS)
La Niña Conditions are Present in the Pacific.
Based on current data and forecast models, the Climate Prediction Center (CPC) the ENSO alert system status is set to La Niña Advisory. La Niña conditions are currently present, with sea surface temperatures below-average across the central and eastern equatorial Pacific Ocean. Forecast models predict that La Niña conditions will continue at least through the winter of 2017-2018. Taking into account the ENSO forecast and long-term trends, the CPC seasonal outlook favors above-normal temperatures and below-normal precipitation for Florida through February 2018.
Hazardous Weather Events in November.
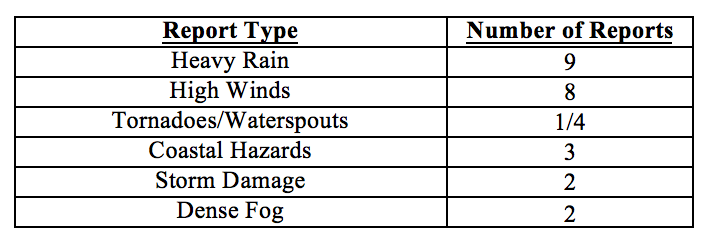
November 2017 was relatively quiet, with only 29 hazardous weather events recorded by the National Weather Service Local Storms Report Database for the entire month across the state (see Table 4 for breakdown by event type). Minor street flooding due to high astronomical tides was seen on the 5th of the month in Broward, Miami-Dade and Palm Beach Counties. Rainfall amounts (exceeding 3-4’’ in 24 hours) were reported in Martin County on the 13th. Several instances of marine thunderstorm wind gusts of 40-45 mph were reported in Walton, Bay and Franklin County on the 19th. A possible tornado was observed in Collier County on the 22nd. Some heavy rains associated with a frontal passage were reported in Brevard and Volusia Counties on the 23rd, along with isolated reports of strong winds and storm damage. Dense fog was reported on the last day of the month in parts of Leon and Walton Counties.
Table 4: Breakdown of storm reports submitted in Florida during the month of November (Compiled from Iowa State University/Iowa Environmental Mesonet.)
Drought-Related Impacts.
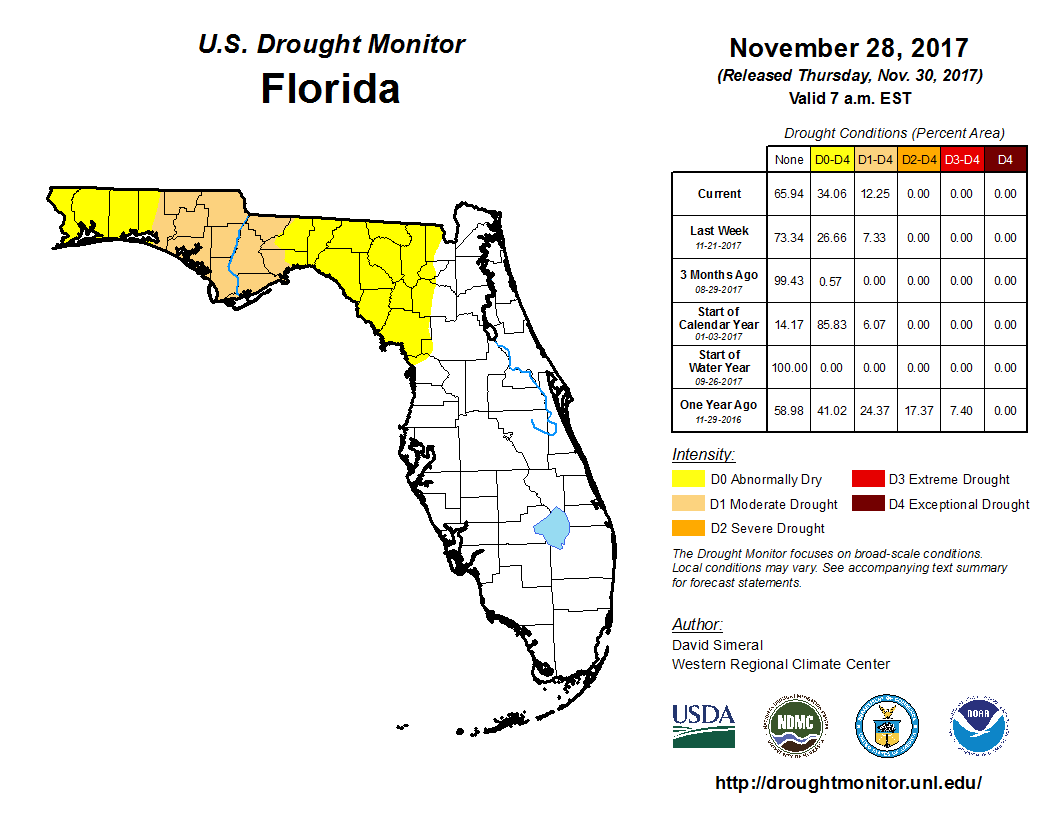
At the end of October the entire state was drought-free. As the month progressed, abnormally dry (D0) to moderate drought (D1) conditions gradually developed over the Panhandle, from Escambia County on the west to Baker, Union, Alachua, and Levy County on the east. As of the latest U.S. Drought Monitor Report, issued on the 28th, about 22% of the state is experiencing D0 conditions, and about 12% of the state (including Bay, Calhoun, Gadsden, Gulf, Holmes, Jackson, Franklin, Liberty, Washington, and parts of Leon, Walton, Wakulla Counties) is experiencing D1 conditions. Based on census data, roughly 450,000 Florida citizens are currently impacted by drought.
At the end of the month, Lake Okeechobee water levels were at 16.08 ft., which is above normal for this time of the year. The high Lake elevations since hurricane Irma in September have necessitated continuing discharge of large volumes of water into the St. Lucie River, which has resulted in a large plume of low-salinity turbid nutrient-rich water extending into the Gulf. These discharges are expected to be reduced soon, as the dry season progresses and lake levels continue to go down.
Figure 2: Latest U. S. Drought Monitor Map for Florida (from http://droughtmonitor.unl.edu/)
Agriculture-Related Impacts.
At the end of October, topsoil moisture levels across the state were at predominantly adequate (52%) to surplus (37%) levels, although some short values (11%) were also observed. As the month progressed and abnormally dry to moderate drought conditions settled in over the Florida Peninsula, the proportion of surplus values decreased, and that of short values increased somewhat.
The citrus growing area has remained drought-free. Post-hurricane cleanup finally drew to a close for even the most damaged areas, and caretakers have resumed normal grove maintenance. Harvesting for the fresh market is underway for a number of orange, grapefruit and tangerine varieties.
Cattle across the state were in mostly good condition. Pasture quality across the state was mostly good to fair, and seasonally declining with cooler temperature and drier conditions. Supplemental feed is expected to be needed soon in Hernando and Sumter Counties. Winter pasture planting has been reported in Bradford, Jackson, Lafayette, Osceola, and Walton Counties.
Peanut harvesting has been wrapped up for the season, and cotton harvesting is about 75% completed. The peanut yield and quality was reported better than expected in Jackson County, but other counties have suffered some losses due to bad weather conditions in the past few months. Hay harvesting has been reported in Bradford, Gilchrist, Jackson, Okeechobee, Osceola, Polk, Suwannee, Volusia, and Taylor Counties. Producers in Taylor County have been reportedly cutting as much hay as possible due to a supply shortage. Sugarcane planting and harvesting has been ongoing in Glades, Hendry and Palm Beach Counties.
Appendix 1: Additional November departures from normal data for Florida locations.
Appendix 2: Select daily maximum and minimum temperature records (° F) broken during November (compiled from NOAA, NWS).
Building A, Suite 292
Tallahassee, FL 32306-2741
Phone: (850) 644-3417 | (850) 644-0719
climate@coaps.fsu.edu