Prepared by Lydia Stefanova, Daniel J. Brouillette, and David F. Zierden.
Florida Climate Center
The Florida State University
Tallahassee, FL

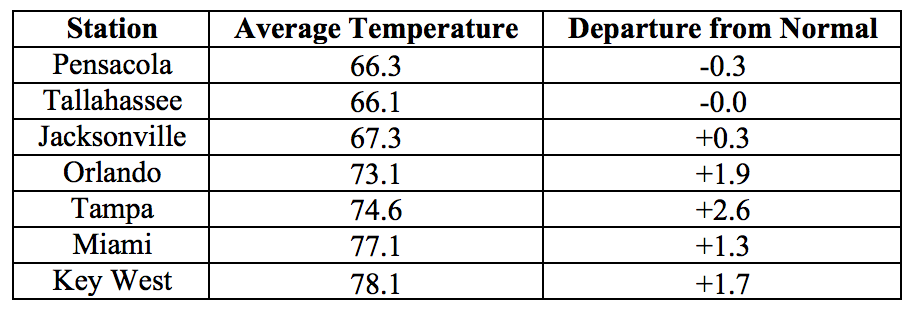
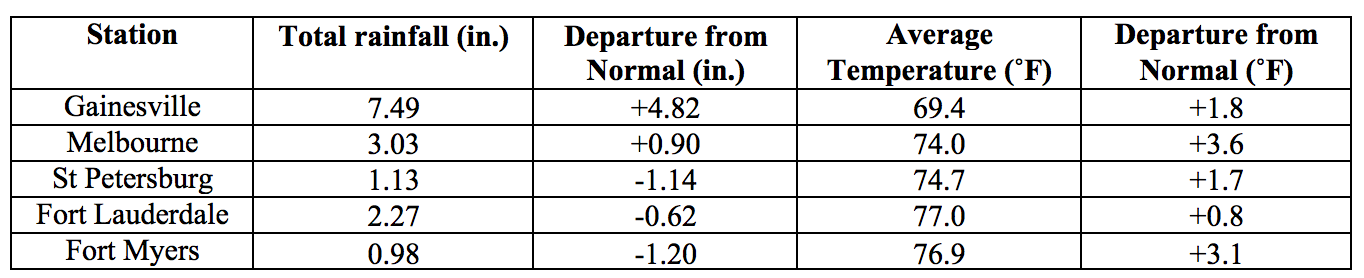
Average temperatures in April were above normal across most of the state. The departures from average temperatures in April 2018 were near- to above-normal across the state, ranging from -0.3˚F in Pensacola to +3.6˚F in Melbourne (Table 1 and Appendix 1). Daily maximum temperatures at or above 90˚F were seen on at least one day at most stations from Orlando southward. April 2018 was the 7th warmest in Fort Myers. Across the state, only one high temperature record was tied and none were broken (Appendix 2).
Table 1: April average temperatures and departures from normal (˚F) for selected cities.
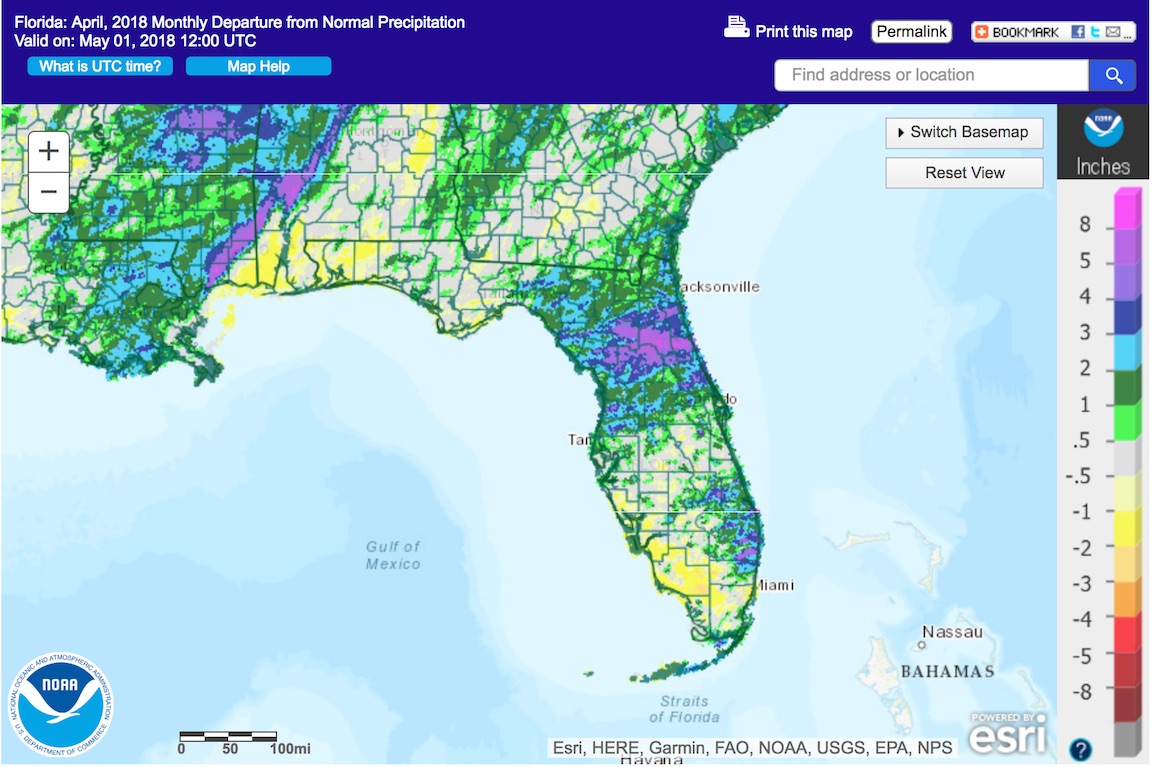
Rainfall totals in April were mixed across the state. Rainfall totals in April 2018 were mixed across the state, with below-normal values in the western Panhandle and southwestern Florida, and above-normal values in most other locations (Figure 1). Departures from normal at major reporting stations ranged from -1.84” in Key West to +4.82” in Gainesville (Table 2 and Appendix 1), although localized parts of the state saw rainfall totals that were as much as 3.00” below normal to 8.00” above normal (Figure 1). One daily precipitation record was broken (Table 3).
Table 2: April precipitation totals and departures from normal (inches) for select cities.
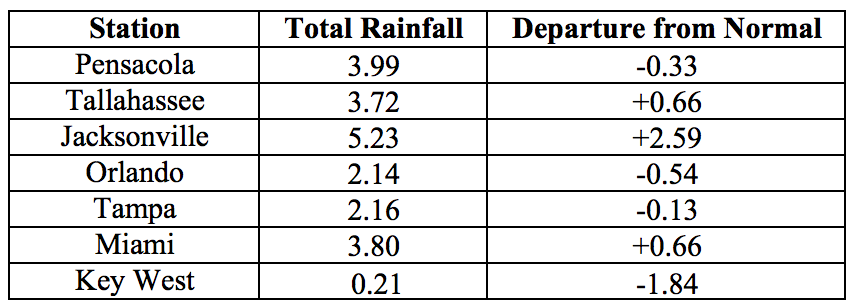
Table 3: Select daily rainfall records (inches) broken during April. (Compiled from NOAA, NWS).
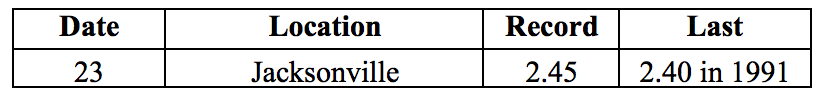
Figure 1: A graphical depiction of the monthly rainfall departure from normal (inches) for March is given in the figure below (courtesy of NOAA, NWS)
La Niña Conditions are Present in the Pacific.
Based on current data and forecast models, the Climate Prediction Center (CPC) ENSO Alert System is still set to a La Niña Advisory. La Niña conditions are currently present, with sea surface temperatures (SST) near- to below- normal across the east-central and eastern equatorial Pacific Ocean. Based on forecast model predictions, a transition to ENSO-neutral conditions is favored sometime during April-May of 2018. The CPC seasonal outlook favors above-normal temperatures for Florida through July 2018.
Hazardous Weather Events in April.
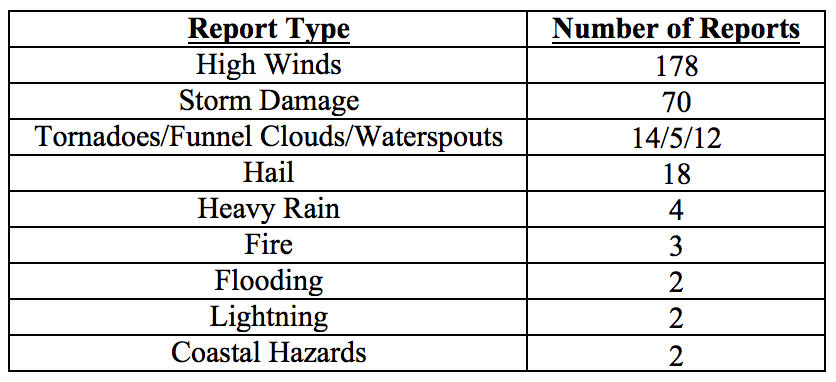
There were a total of 310 hazardous weather events logged to the National Weather Service Local Storm Reports Database for the state during April 2018. The majority of the hazardous weather events involved high winds and storm damage (see Table 4 for a breakdown).
Over half of the hazardous weather reports came in on April 15th and into the early hours of the 16th, as an intense cold front swept through the region. This front produced strong winds across the state, with gusts exceeding 60 mph reported in Brevard, Flagler, Indian River, and Sarasota Counties, and over the waters near Miami and the Florida Keys, and wind gust of 74 mph recorded by a USAF weather station in Brevard County. A trained spotter in Marion County recorded 1.50” of rain over a period of just 45 minutes. Fallen limbs, trees and damaged powerlines were seen in Bay, Brevard, Calhoun, Clay, Duval, Flagler, Hamilton, Jefferson, Lafayette, Lake, Leon, Madison, Marion, Orange, St. Johns, Suwannee, Taylor, Wakulla, and Walton Counties. This weather system produced two waterspouts near Tampa, a funnel cloud in Flagler County, and tornadoes in Bay, Monroe, and Pinellas Counties.
During April there were several hazardous weather-related injuries and two fatalities in Florida. Several swimmers were caught in rip currents near Jupiter in Palm Beach County on the 2nd of the month, and one person was drowned and another injured by rip currents near Daytona Beach, Volusia County on the 27th. A lightning on the 7th struck several people sheltering from the storm near a trailer in Hamilton County, killing one victim and injuring four. One person was injured by a lightning strike on a beach in Hillsborough County. Two people were injured when a waterspout moved ashore in Fort Walton Beach, Okaloosa county as an EF-1 tornado. One person was injured when a large tree fell on a trailer home in Jacksonville on the 15th.
There were several tornado reports during the month, in Bay, Broward, Escambia, Hillsborough, Monroe, Okaloosa, Palm Beach, and Pinellas Counties. Waterspouts were spotted on various dates in the vicinities of Palm Beach, Miami Beach, and the Florida Keys. Hail with diameter of up to 3” was seen in St. Johns County on the 10th. Smaller hail was also seen on that day in Brevard, Broward, Hardee, and Orange Counties. On the 24th, there was hail reported in Martin, Palm Beach, and St. Lucie Counties. Wildfires were reported in Brevard, Collier and Palm Beach Counties. Temporary burn bans are in effect in Charlotte, Glades, Hendry, Osceola, and Sarasota Counties.
Table 4: Breakdown of storm reports submitted in Florida during the month of March (Compiled from Iowa State University/Iowa Environmental Mesonet.)
Drought-Related Impacts.
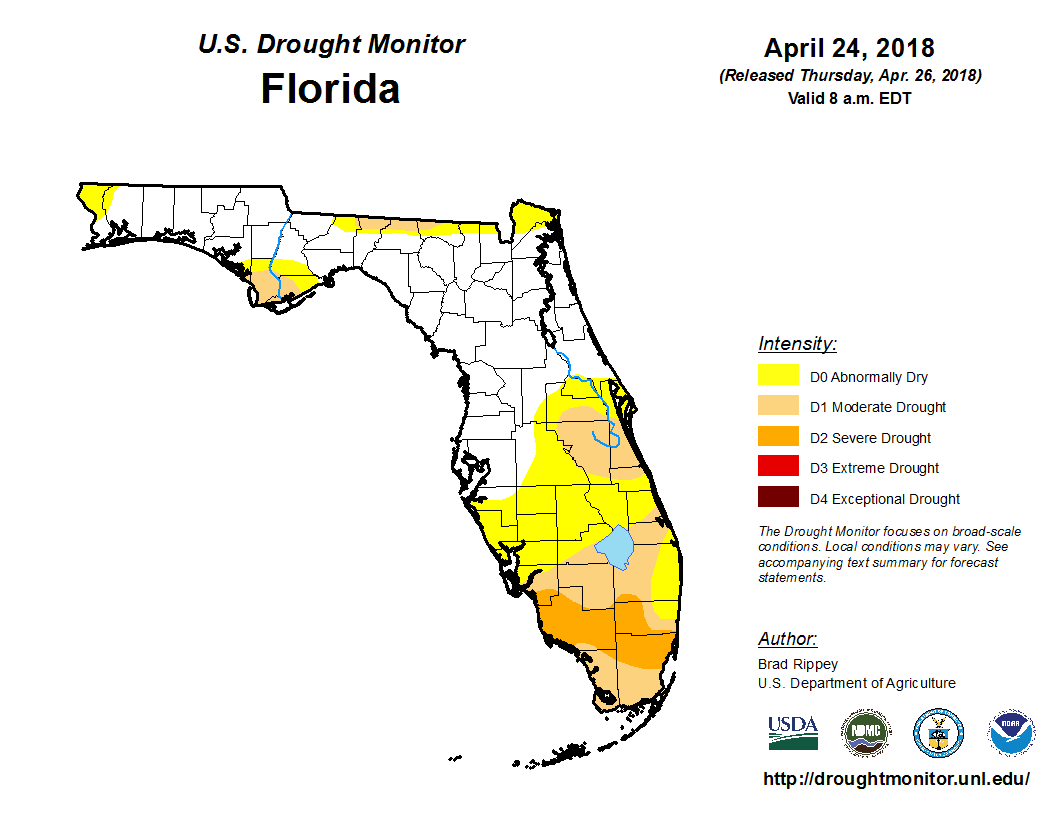
At the end of March, approximately 40% of the state was drought-free, 41% is experiencing D0 conditions, and 19% is under D1 conditions. The D1 conditions are affecting Gulf, Franklin, Jefferson, Madison, Hamilton, Columbia, Baker, Nassau, Seminole, Orange, Osceola, Hendry, Palm Beach, Broward, Collier, Monroe, and Miami-Dade Counties. As the month progressed, some of the D0 conditions were alleviated, particularly in the northern and central portions of the state, but severe drought (D2) conditions appeared in southern Florida. As of the latest US drought monitor report, dated April 24, about 51% of the state is drought-free, 24% is experiencing D0 conditions, 18% - D1 conditions. D2 conditions affect about 7% of the state’s area, including small portions of Lee, Monroe, and Palm Beach Counties, large portions of Broward and Dade Counties, and most of Collier County. In all, about 6.7 million Florida citizens are residing in drought-affected areas.
Lake Okeechobee water levels at the end of April were at 13.16 ft., which is slightly below the normal value for this time of the year.
Figure 2: Latest U. S. Drought Monitor Map for Florida (from http://droughtmonitor.unl.edu/)
Agriculture-Related Impacts.
At the beginning of April, topsoil moisture levels were at mainly (42%) adequate, but there was a significant proportion of short (34%) or very short (24%) values. Soil moisture levels improved over the course of the month, ending at predominantly (60%) adequate, 35% short, and only 3% very short values.
Most of the citrus growing area was affected by either abnormally dry conditions or moderate to severe drought. Irrigation was regularly used to maintain sufficient moisture in the groves, and canals and ditches in many areas were dry. Harvesting of this season’s citrus crop is virtually complete for most citrus. Numerous fruit and vegetable crops are being planted and harvested. Some crops, including watermelons, tomatoes, peppers, and eggplant were harmed by strong winds and low temperatures early in the month. Some potato crops were negatively affected by disease as a result of heavy rains. Producers in the Panhandle have been in varying stages of field preparation and planting of corn, tobacco and peanuts. Suwannee County peanut planting has been delayed due to low soil temperatures. Sugarcane producers have been actively harvesting and planting. Cattle have been holding at mostly good to fair condition, while pastures have remained mostly fair. Most livestock producers have continued to provide supplemental feed, although areas that received sufficient rainfall have seen improvement in pasture conditions.
Appendix 1: Additional April departures from normal data for Florida locations.
Appendix 2: Select daily maximum and minimum temperature records (° F) broken or tied during April (compiled from NOAA, NWS). Asterisk indicates an all-time record for any day in February.