Prepared by Lydia Stefanova, Daniel J. Brouillette, and David F. Zierden.
Florida Climate Center
The Florida State University
Tallahassee, FL
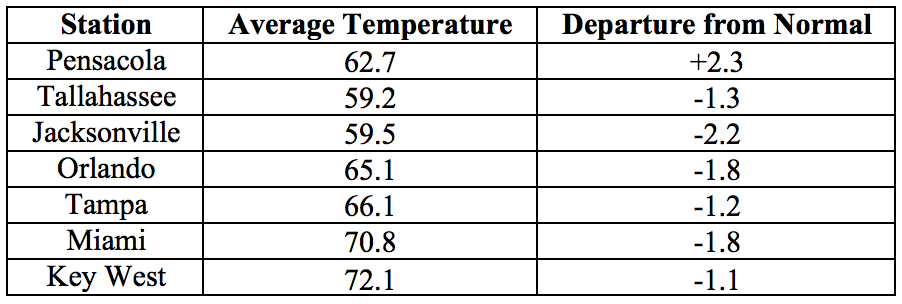
Average temperatures in March were below normal across most of the state. The departures from average temperatures in March 2018 were below normal across the entire state, with the exception of the extreme western Panhandle, ranging from -2.7˚F in Fort Lauderdale to +2.3˚F in Pensacola (Table 1 and Appendix 1). Minimum temperatures at or below freezing were recorded on three nights in Tallahassee, two in Jacksonville, and one in Gainesville. A few temperature records were tied or broken across the state (Appendix 2).
Table 1: March average temperatures and departures from normal (˚F) for selected cities.
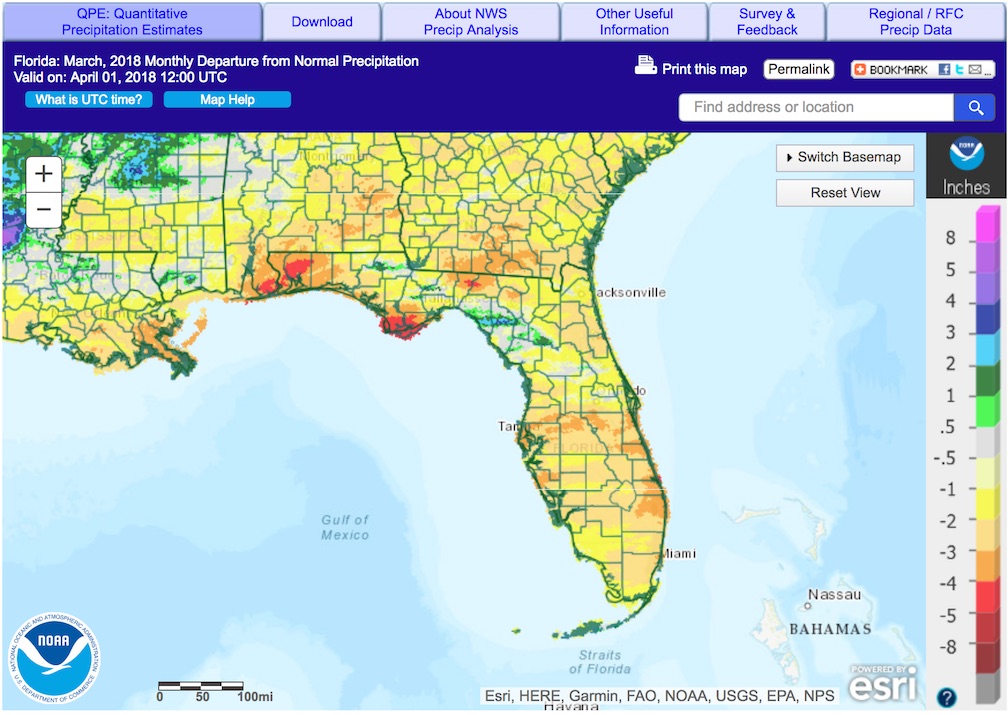
Rainfall totals in March were below normal for most of the state. Rainfall totals in March 2018 were below everywhere in the state except for the Florida Keys (Figure 1). Departures from normal roughly ranged from -3.97” in Pensacola to +0.91” in Tallahassee (Table 2 and Appendix 1), although localized parts of the state saw rainfall totals that were as much as 5.00” below normal to 3.00” above normal (Figure 1). A few 24-hour precipitation records broken for the month (Table 3).
Table 2: March precipitation totals and departures from normal (inches) for select cities.
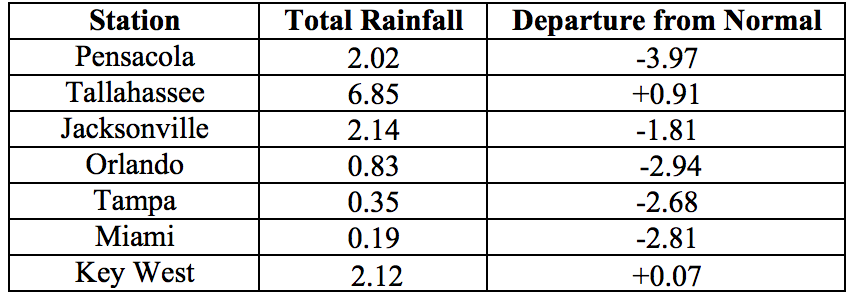
Table 3: Select daily rainfall records (inches) broken during March. (Compiled from NOAA, NWS).

Figure 1: A graphical depiction of the monthly rainfall departure from normal (inches) for March is given in the figure below (courtesy of NOAA, NWS)
La Niña Conditions are Present in the Pacific.
Based on current data and forecast models, the Climate Prediction Center (CPC) ENSO Alert System is still set to a La Niña Advisory. La Niña conditions are currently present, with sea surface temperatures (SST) below average across the central and eastern equatorial Pacific Ocean. Based on forecast model predictions, a transition to ENSO-neutral conditions is favored sometime during the spring of 2018. The CPC seasonal outlook favors above-normal temperatures for Florida through June 2018.
Hazardous Weather Events in March.
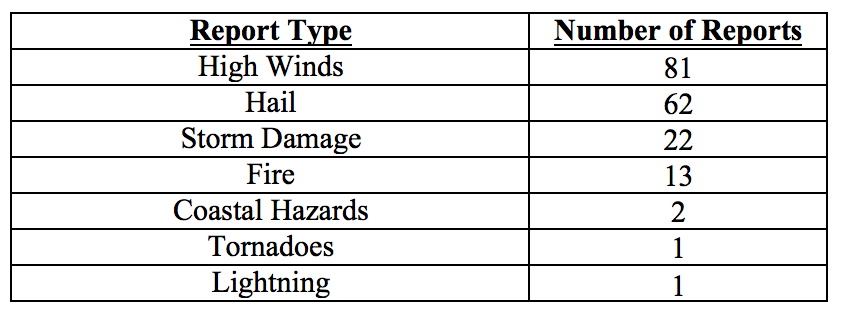
There were a total of 182 hazardous weather events logged to the National Weather Service Local Storm Reports Database for the state during March 2018. The majority of the hazardous weather events involved high winds, hail or storm damage (see Table 4 for a breakdown).
Over 2/3 of all events occurred on a single day, the 20th of the month when a strong cold front swept through the state. Wind gusts over 60 and up to 77 mph were recorded across Brevard County. Gusts between 40 and 60 mph were felt in Brevard, Duval, Franklin, Gadsden, Highlands, Hillsborough, Lake, Leon, and Marion Counties. Wind damage (fallen trees, branches, and power outages) was reported in Franklin, Gadsden, Hardee, Highlands, Jefferson, Lafayette, Pinellas, Taylor and Wakulla Counties. Hail with diameter up to 2” was reported in Daytona Beach (Volusia County), and golf-ball size (1.75”) was seen in Duval, Orange, Seminole, and Volusia Counties. Hail of various sizes affected parts of Baker, Brevard, Citrus, Dixie, Duval, Flagler, Levy, Marion, Nassau, Okeechobee, Orange, Pinellas, Seminole, Sumter and Volusia Counties.
There were several wildfires during the month in various parts of Collier, Gulf, Hendry, Miami-Dade, and Nassau Counties. Temporary burn bans are currently in effect in Charlotte, Hendry, and Osceola Counties. No significant damage of structures has been reported.
A brief F-0 tornado touchdown was recorded on camera on the 21st near Belle Glade, but caused no damage as it was in an empty field.
Rip currents claimed the life of a man attempting to rescue two children stranded in rough surf on Navarre Beach (Santa Rosa County), and high surf was responsible for two injuries on Riviera Beach (Palm Beach County).
Table 4: Breakdown of storm reports submitted in Florida during the month of March (Compiled from Iowa State University/Iowa Environmental Mesonet.)
Drought-Related Impacts.
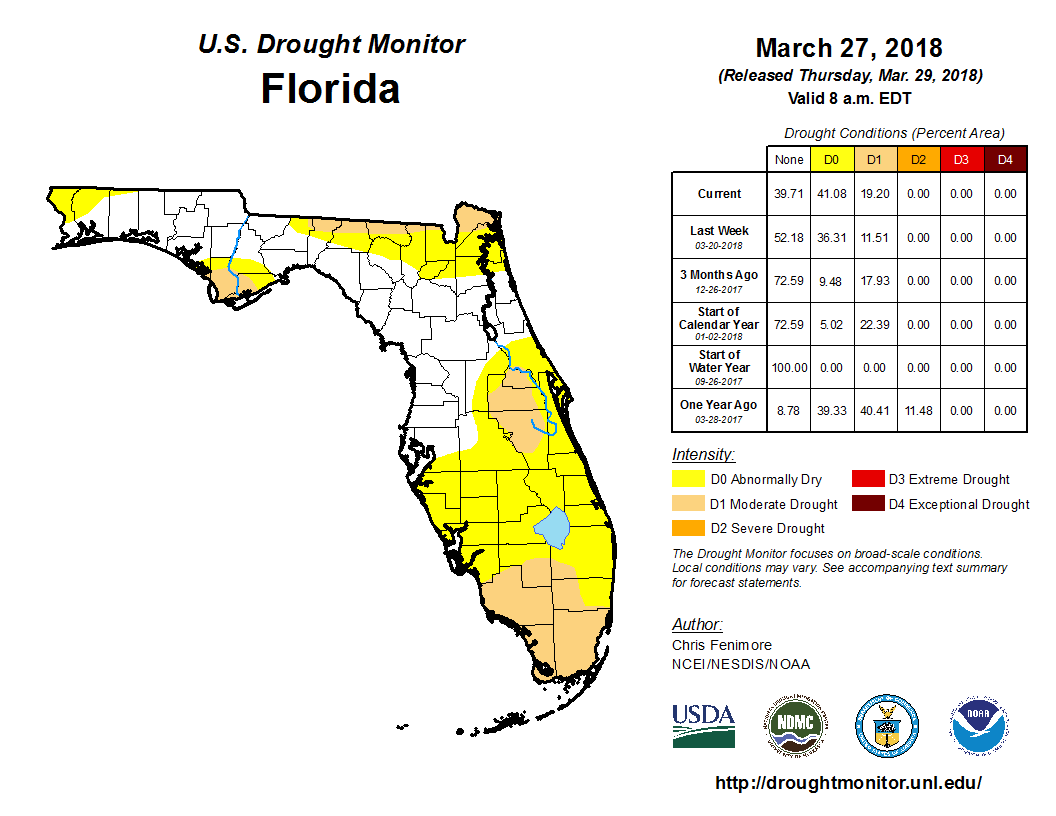
At the end of February, approximately 68% of the state was unaffected by drought. About a quarter of the state (most of South Florida, and parts of Central Florida and the Panhandle) was experiencing abnormally dry (D0) conditions, and the Western Panhandle was under moderate drought (D1). As the month progressed, the D1 conditions in the Western Panhandle initially spread out, but were largely cleared by the end of the month. The D0 conditions in South and Central Florida expanded, and some deepened into D1. As of the last US Drought Monitor report dated March 27, approximately 40% of the state was drought-free, 41% is experiencing D0 conditions, and 19% is under D1 conditions. The D1 conditions are affecting Gulf, Franklin, Jefferson, Madison, Hamilton, Columbia, Baker, Nassau, Seminole, Orange, Osceola, Hendry, Palm Beach, Broward, Collier, Monroe, and Miami-Dade Counties. Water levels in Lake Okeechobee at the end of the month were at 13.84 ft., which is slightly below normal for this time of the year.
Figure 2: Latest U. S. Drought Monitor Map for Florida (from http://droughtmonitor.unl.edu/)
Agriculture-Related Impacts.
At the beginning of March, topsoil moisture levels were at mainly adequate (47%) to short (37%), although some 14% of values were in the very short category. As the month progressed, there was a gradual shift towards drier conditions, ending at 38% adequate, 36% short, and 26% very short levels. Citrus growers in most groves have been irrigating daily, and canals and ditches were low because of insufficient rainfall. Many vegetable producers have also been using irrigation. Watermelon fields in Dixie County had to be replanted several times following damage on several occasions from frost, flooding, hail or wind. Pasture conditions have been declining following frost in the northern counties and general lack of rain. Cattle condition across the state has been trending downwards from mostly good to mostly fair. Most cattle have been receiving supplemental feed and water. Some potato plantings in Suwannee County were severely damaged by frost, and frost concerns delayed corn planting in northern and central counties.
Appendix 1: Additional March departures from normal data for Florida locations.

Appendix 2: Select daily maximum and minimum temperature records (° F) broken or tied during March (compiled from NOAA, NWS). Asterisk indicates an all-time record for any day in February.


