


The Florida Climate Center serves as the primary resource for climate data, information, and services in the state of Florida.

The Florida Climate Center achieves its mission by providing climate monitoring, research, and expertise to be applied by the people, institutions, and businesses of Florida and the surrounding region.
We provide direct service by fulfilling requests for climate and weather data and information in a variety of formats.
We perform research that advances the understanding of the climate variability and changes of Florida and the surrounding region.
We provide outreach in presentations and at events aimed at a variety of groups, interests, and ages.
- Anticipating Heavy Rain in Florida by Morton D. Winsberg
- Florida's Hot Season by Morton D. Winsberg
- Climate of Florida (PDF) by Morton D. Winsberg
The Florida Climate Center and the Center for Ocean-Atmospheric Prediction Studies (COAPS) have been leaders in the research of climate variability in North America, particularly as related to the El Niño - Southern Oscillation (ENSO). Given that wildfire activity is intimately linked with temperature and precipitation patterns, it naturally follows that ENSO would also have an impact on annual wildfire occurrences. This relationship holds especially true for Florida and the Southeast United States, where there is a strong connection between ENSO and climate during the winter and spring months which overlaps the traditional wildfire season in this region.
COAPS first cooperated with the Florida Division of Forestry in a research project identifying the connection between ENSO and wildfire burn acreage in Florida. COAPS has since extended that research and developed a prototype wildfire risk forecast system for Florida and the Southeast under research grants from the Florida Division of Forestry and the USDA Forest Service.
The wildfire risk forecast is based on ENSO phase and the Keetch-Byram Drought Index (KBDI). The KBDI was developed by foresters in the Southeast and represents water available in the upper layers of the soil. The KBDI is used extensively in forestry and wildfire applications. The wildfire risk forecast gives monthly probabilities of the KBDI reaching critical values from January through July, coinciding with the traditional wildfire season in the Southeast. The forecast is released in January each year, and updated throughout the season. Results are available on www.agroclimate.org and are presented each year at the National Seasonal Assessment Workshop, sponsored by the National Interagency Coordination Center. Ongoing support for this project comes from the NOAA RISA program and USDA Risk Management Agency.
Related Resources
|
Related Research |
Contact David Zierden at
|
|
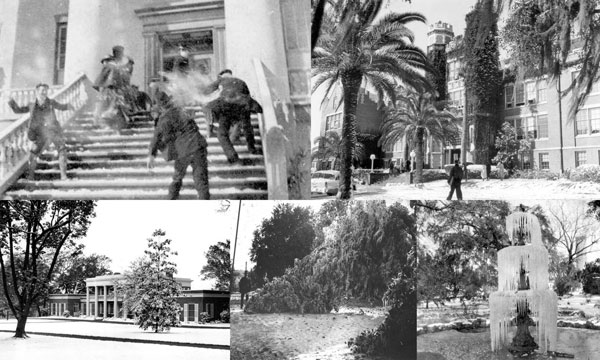
Images of snow and freeze events in Florida. Courtesy of Florida Memory.
Although many people head south to escape the cold in the winter, it isn't always warmer in Florida. When an intense low pressure system is followed by a strong high pressure system, particularly powerful invasions of cold air may occur in Florida. These cold air outbreaks can produce below-freezing temperatures and are usually accompanied by strong winds that can produce bitterly cold wind chills.
Over the past 150 years, numerous severe cold outbreaks have affected Florida. In February 1899, a cold wave that became known as the Great Arctic Outbreak pushed frigid Canadian arctic air into the state. During this event, the lowest temperature ever recorded in Florida (-2°F) occurred on February 13, 1899. Since this outbreak, a number of "impact freezes" have influenced the retreat of the famous Florida orange groves from areas around Jacksonville and St. Augustine to their current locations in south Florida.
| SIGNIFICANT FLORIDA IMPACT FREEZES | |||
| Freeze Event | Tallahassee | Avon Park | Fort Myers |
| December 1894 | 15°F | 24°F | 28°F |
| February 1899 | -2°F | N/A | N/A |
| December 1934 | 20°F | 21°F | 29°F |
| January 1940 | 15°F | 26°F | 29°F |
| December 1962 | 20°F | 24°F | 28°F |
| January 1977 | 16°F | 21°F | 30°F |
| January 1981 | 8°F | 18°F | 28°F |
| January 1982 | 14°F | 19°F | 29°F |
| December 1983 | 14°F | 23°F | 33°F |
| January 1985 | 6°F | 21°F | 30°F |
| December 1989 | 13°F | 20°F | 27°F |
| January 1997 | 18°F | 24°F | N/A |
Contrary to popular belief, it does snow in Florida. The first documented account of snow in Florida was reported in 1774. During the Great Arctic Outbreak, which was responsible for one of the biggest widespread snow events in the state, snow measured up to 3 inches deep in numerous Panhandle communities, and snow flurries were reported as far south as Fort Myers. Since 1886, there have been more than 80 months in which at least a trace of snow has been reported somewhere in the state.
| EXAMPLES OF FLORIDA SNOW EVENTS SINCE 1950 | |
| Date | Description |
| February 2, 1951 | Two inches were reported in St. Augustine and Crescent City. |
| March 6, 1954 | Four inches were reported at the Milton Experimental Station; this total holds as the 24-hour state snowfall record. |
| February 13,1958 | Rain changed to snow; 1.5 inches were reported in Jacksonville, and 2.8 inches reported in Tallahassee. |
| January 17-19, 1977 | Snow started falling in Pensacola on the 17th. On the 19th, flurries were reported as far south as Homestead. Areas along I-4 (Tampa/Orlando) reported 1 to 2 inches of snow. |
| December 23, 1989 | Rain changed to snow in Jacksonville, and totals of several inches were reported in some locations; the city had its first White Christmas. |
| March 12, 1993 | The '93 Superstorm produced up to 4 inches of snow along the Florida Panhandle. |
| November 21, 2006 | A dusting of snow fell over portions of central Florida, the first November snow in the state since 1912. |
| January 8-9, 2010 | A light dusting of snow was seen in Jacksonville. Light snow fell in parts of central Florida with sleet/snow reported in Orlando, Tampa, and Melbourne. Flurries are reported in West Palm Beach and Kendall. |
| December 26, 2010 | A mix of snow and sleet was reported in Jacksonville, with a freezing fog event around midnight. Tallahassee, Gainesville, and other locations in the northern peninsula reported flurries during the day. |
|
|
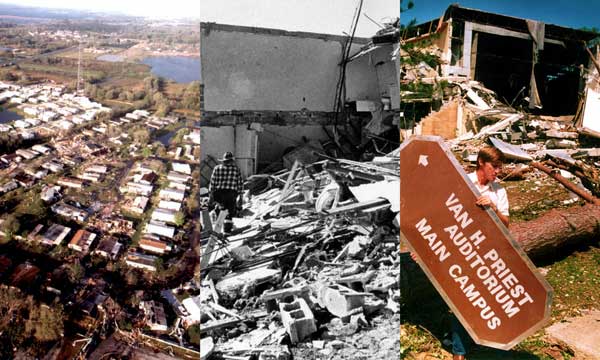
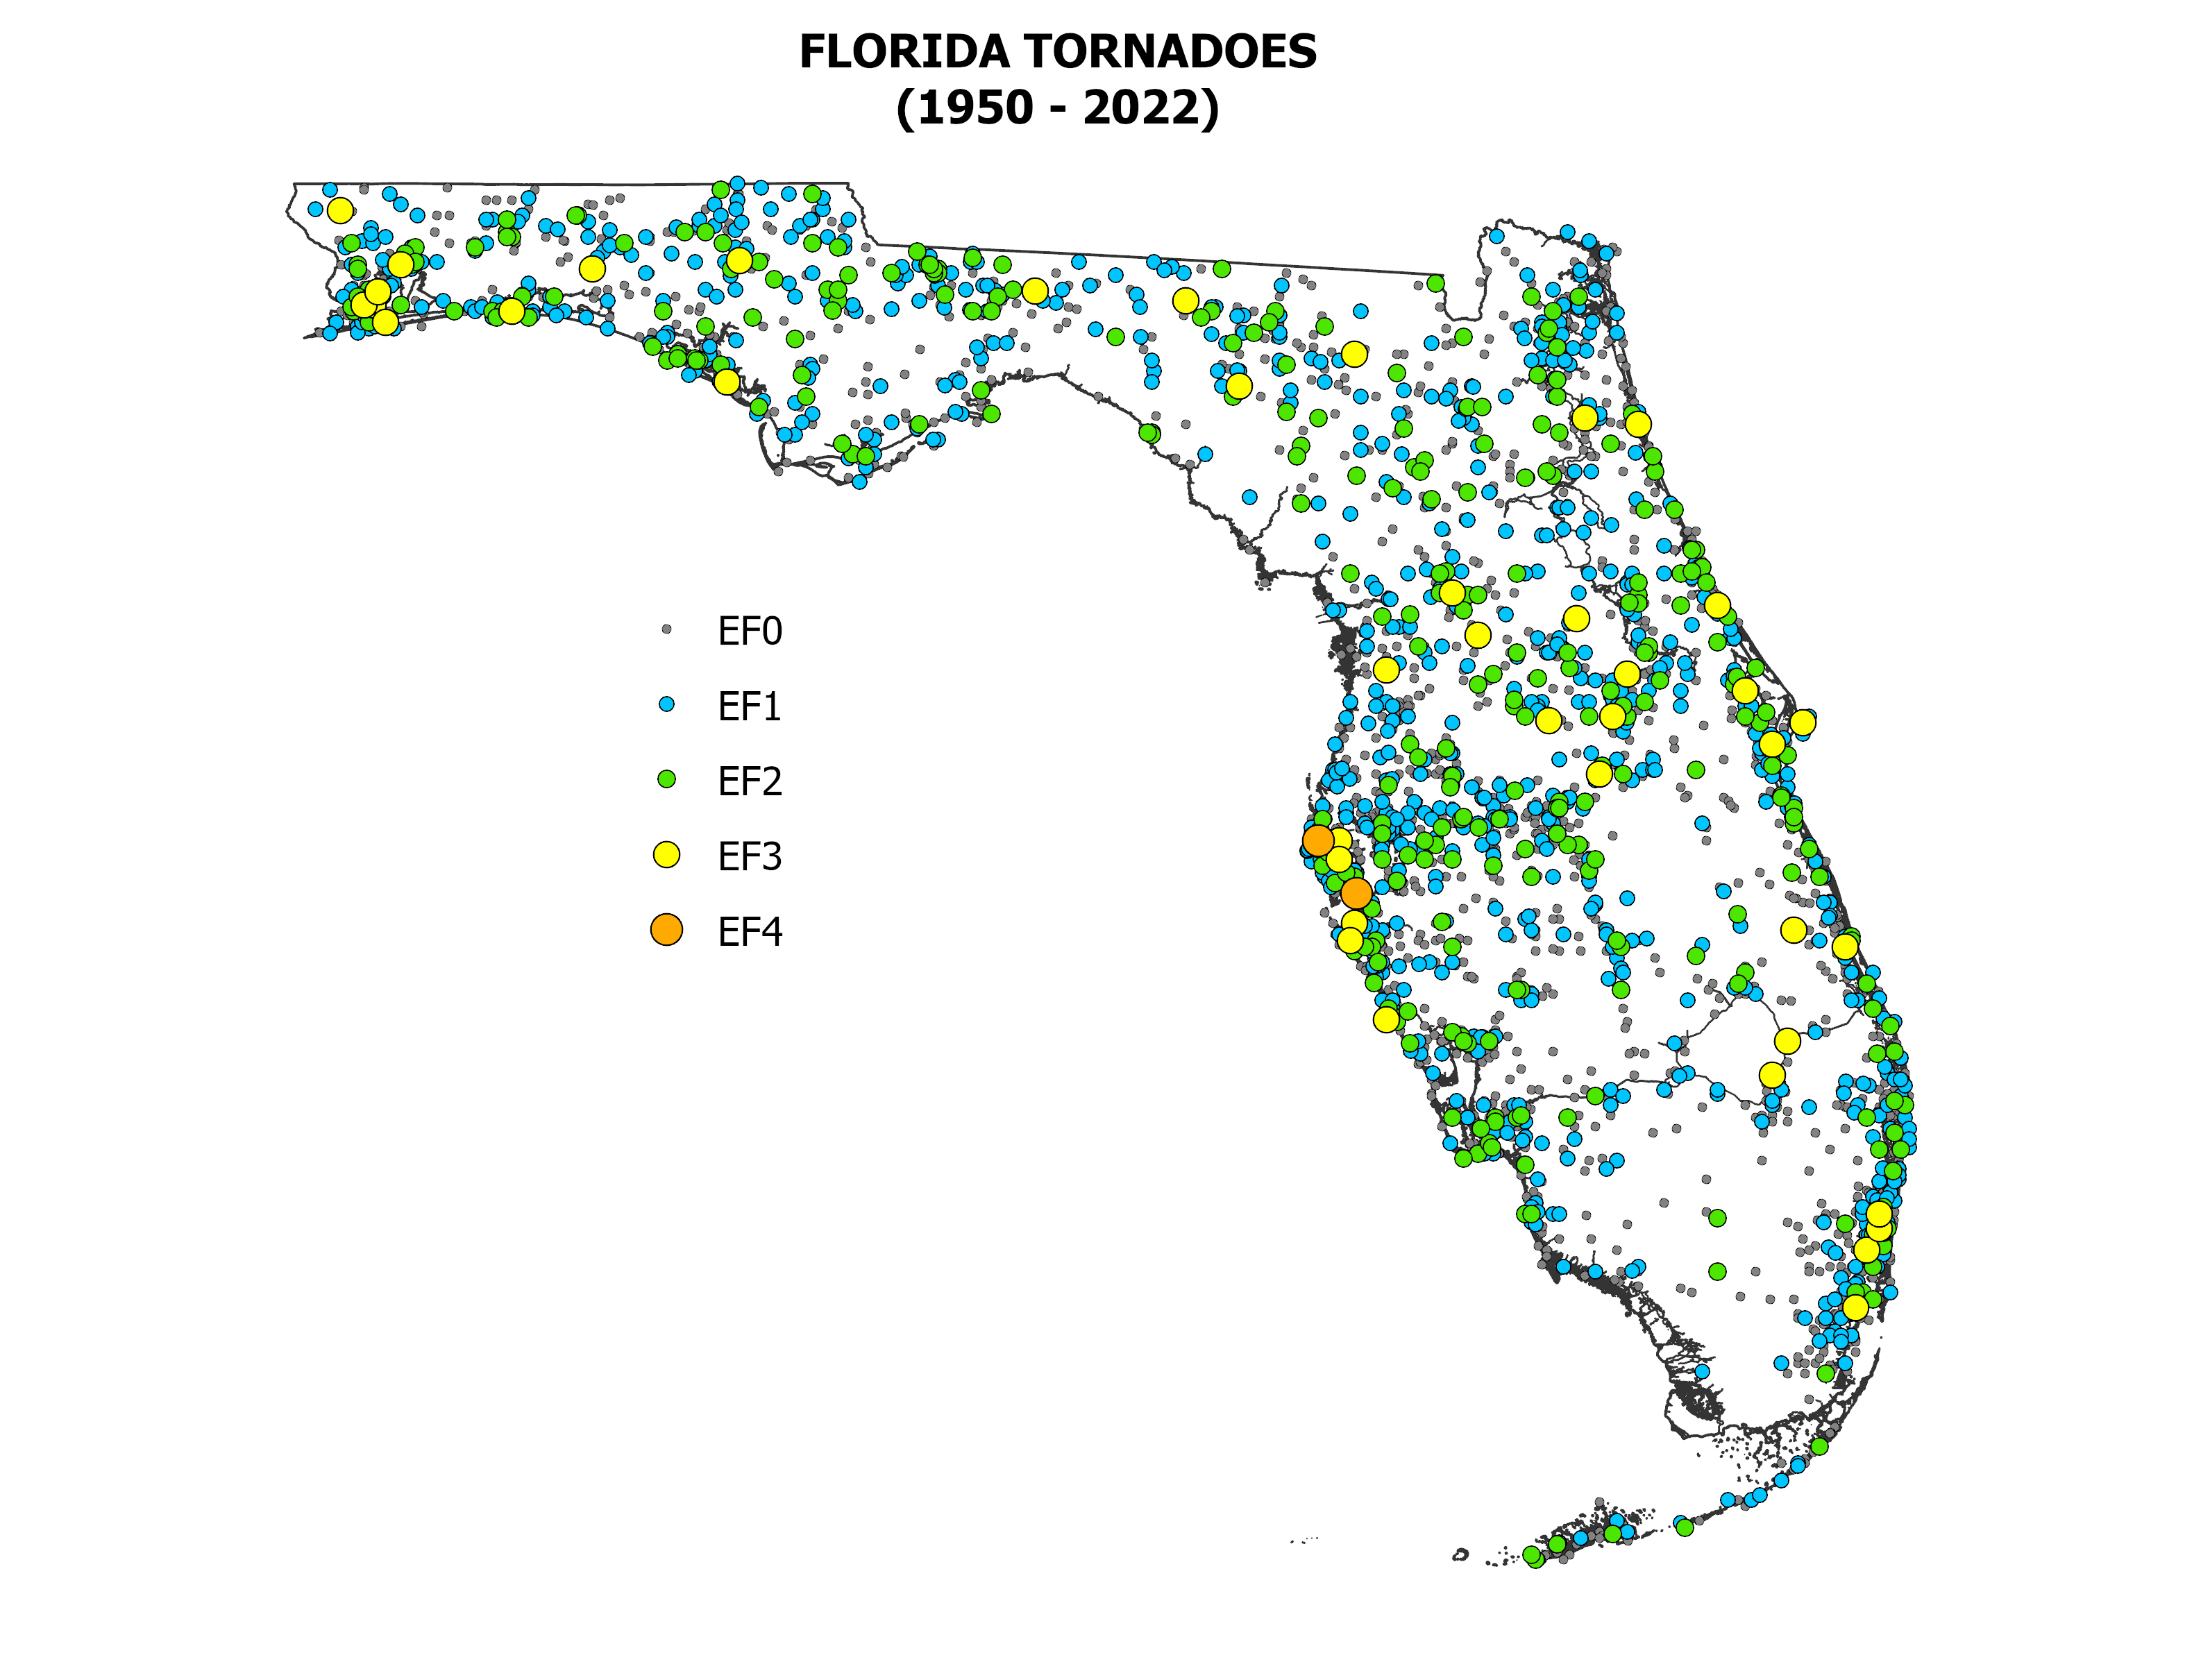
Images of tornado damage in Florida. Courtesy of Florida Memory.
Truly destructive tornadoes are most frequently reported in Florida during the spring and summer; the most powerful usually strike in spring. Florida has the dubious distinction of having a higher frequency of tornadoes per 10,000 square miles than any other state, including Oklahoma! In Florida, measured in frequency of tornadoes for every 10,000 square miles, the coast between Tampa Bay and Fort Myers has a particularly high incidence, as do the western panhandle and parts of the Atlantic Coast.
So, what is a tornado? Simply put, a tornado is a violently rotating column of air that is spawned by a severe thunderstorm. It connects from the thunderstorm to the ground and often appears to have a funnel or column shape. A tornado, one of nature's most violent storms, can develop suddenly, and have winds in excess of 250 mph.
Generally, tornadoes in Florida form
- along a squall line ahead of an advancing spring cold front from the North,
- along the squall lines in areas where masses of warm air converge,
- from isolated local summer thunderstorms, and/or
- within a hurricane.
What triggers a tornado is still not altogether clear. Tornadoes spawn inside clouds when there is great turbulence and winds of various speeds and velocities come in contact with one another. Although there is uncertainty about the triggers, meteorologists are able to identify atmospheric conditions conducive to tornadic activity.
The intensity of a tornado can be determined only after the event when survey teams from the National Weather Service can examine structural damage. After the survey is complete, the tornado is given a value from the Fujita Scale. The Fujita Scale was developed by Dr. T. Theodore Fujita and categorizes tornadoes on the basis of their intensity and area. The scale relates a tornado's damage to the fastest quarter-mile wind speed at the height of the damaged structure to determine its intensity. Over the years, problems with the initial Fujita Scale had arisen and in 2007 the new Enhanced Fujita (EF) Scale was adopted. The EF Scale helps determine the intensity of a tornado when there is no structural damage (as can happen when, for example, a tornado passes through a corn field).
| ENHANCED FUJITA (EF) SCALE | ||
| EF Number | Estimated 3-Second Gust (mph) | Damage |
| 0 (Gale) | 65-85 | Some damage to chimneys; branches brooken off trees; shallow-rooted trees pushed over; damaged sign boards. |
| 1 (Weak) | 86-110 | Surfaces peeled off roofs; mobile homes pushed off foundations or overturned; moving autos pushed off roads. |
| 2 (Strong) | 111-135 | Considerable damage. Roofs torn off frame houses; mobile homes demolished; boxcars pushed over; large trees snapped or uprooted; light object missiles generated. |
| 3 (Severe) | 136-165 | Roof and some walls torn off well constructed houses; trains overturned; most trees in forests uprooted Well-constructed houses leveled; structures with weak foundations blown off some distance; cars thrown and large missiles generated. |
| 4 (Devastating) | 166-200 | Well-constructed houses leveled; structures with weak foundations blown off some distance; cars thrown and large missiles generated. |
| 5 (Incredible) | 200+ | Strong frame houses lifted off foundations and carried considerable distances to disintegrate; automobile sized missiles fly through the air in excess of 100 meters; trees debarked; steel reinforced concrete structures badly damaged. |
*Chart summarized from information supplied by the Storm Prediction Center.
|
|
| SIGNIFICANT TORNADOES | ||||
| Date | Fujita | Killed | Injuries | Information |
| 2/22/1998 | 3 | 25 | 150 | The deadliest tornado of the outbreak was a category F3, that touched down initially 1 mile south of Intercession City. The tornado moved northeast at 45 mph and ripped through the town of Kissimmee killing 25 people. The hardest hit areas were the Morningside Acres mobile home community and the Ponderosa Recreational Vehicle Park. In all 8 people were killed in recreational vehicles, 15 in mobile homes, and 1 in an automobile. The tornado continued northeast and moved into Orange County 6 miles north of St. Cloud. One hundred and fifty people were injured and over 1000 structures were damaged or destroyed |
| 3/31/1962 | 3 | 17 | 100 | Shortly after 9 a.m. on the 31st, a tornado carved an 8-mile path through Santa Rosa County. The hardest hit area was Milton, where 130 homes were demolished in a six-block area, and extensive damage occurred at a mobile home park. |
| 2/22/1998 | 3 | 13 | 36 | The tornado initially set down near Longwood and moved northeast at 45 mph. The tornado passed through several neighborhoods in the southeast portion of Sanford, killing 12 people in mobile homes and injuring 70. It continued northeast and crossed into Volusia County 5 miles east of Sanford. The near 200 mph winds of the tornado damaged or destroyed 625 structures. |
| 2/2/2007 | 3 | 13 | 51 | The storm that produced the Lady Lake tornado re-intensified and produced a second F3 tornado in a rural area to the west-southwest of Paisley. The tornado moved east-northeast at over 50 mph toward the Lake Mack area just west of the St. Johns river. The tornado produced a ¼-mile-wide track across the Lake Mack area, destroying 86 residences and damaging 144. Many mobile homes were completely destroyed. Thirteen people died in mobile homes. |
| 4/4/1966 | 4 | 11 | 530 | A tornado began near Clearwater, moved across North Tampa Bay, through Carrollwood, and Temple Terrace,and then headed east-northeast to Gibsonia, Loughman, Campbell City, and Merritt Island. There is strong evidence that this tornado was on the ground from the Gulf of Mexico to the Atlantic Ocean. The greatest damage was reported from Carrollwood to Gibsonia, where numerous houses and businesses were either damaged or destroyed. |
| 2/2/2007 | 3 | 8 | 25 | The tornado first touched down near the southeast corner of The Villages south of Lake Miona and moved rapidly to the east-northeast at 55 mph into Lake County. A FEMA report to Sumter County emergency management officials detailed damage to 1,145 homes, with 200 destroyed during the 6 minutes the tornado was on the ground. Then, the tornado that moved out of Sumter County and crossed into Lake County just west of Lady Lake. The ¼-mile-wide F3 tornado moved across the Lady Lake area, killing 8 people and injuring 10. The tornado damaged 180 residences and destroyed 101. All of the fatalities occurred in mobile homes. Moving east-northeast at 50 MPH, the tornado lifted near Emerald Marsh Lake. |
| 4/19/1988 | 3 | 4 | 18 | A tornado moved from just southwest of Madison to 11 miles east-northeast of Madison. Seventeen homes were destroyed and more than 30 homes were damaged. Some commercial buildings were either destroyed or damaged. At North Florida Junior College, 3 buildings were destroyed and 9 were damaged. |
| 5/4/1978 | 3 | 3 | 94 | A tornado struck the High Point section of northeastern Pinellas County; destroying 6 rooms of High Point Elementary and damaging many others. Teachers and students were buried under the debris. The 3 deaths and most of the injured from this tornado were from the elementary school. A trailer park across the street from the school also sustained damage and injuries were reported. |
| 2/7/1971 | 3 | 0 | 112 | A pre-dawn waterspout/tornado destroyed an expensive apartment complex in Gulf Breeze. |
| 6/17/1959 | 3 | 0 | 74 | Around 9:50 P.M, a tornado touched down in Coral Gables, moved over the Miami business district and Biscayne Bay, and impacted the Sunny Isles area. Most of the injuries were from flying and broken glass. |
*Chart summarized from information supplied by the National Climatic Data Center.
|
|
|
The average number of thunderstorm days each year throughout the U.S. Courtesy of the National Weather Service. |
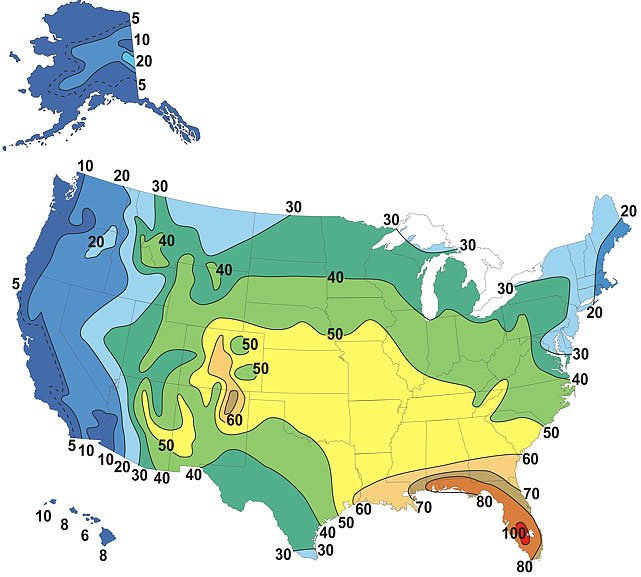
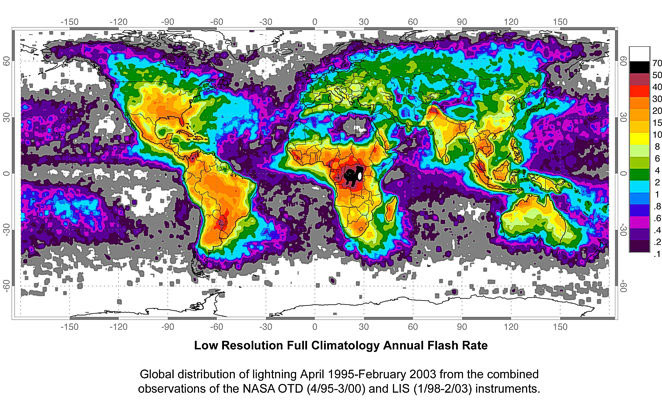
Virtually all summer rainstorms are accompanied by thunder and lighting. No other part of the nation has more thunderstorm activity than Florida. In the western half of the peninsula in a typical year, there are over 80 days with thunder and lightning. Central Florida's frequency of summer thunderstorms equals that of the world's maximum thunderstorm areas: Lake Victoria region of equatorial Africa and the middle of the Amazon basin. The Amazon and east African areas maintain their frequency of thunderstorm activity throughout most of the year, whereas the number of thunderstorms in Florida drops off sharply in the fall and does not pick back up until spring.
The simplest definition of a thunderstorm is a local storm that produces lightning and thunder. The storm itself can either be a single cumulonimbus cloud, a cluster of several thunderstorms, or a line of thunderstorms. In order for thunderstorms to form, there needs to be:
- Moisture - to form clouds and rain.
- Unstable air - warm air that can rise rapidly.
- Lift - cold or warm fronts, sea breezes, mountains or the sun's heat are capable of lifting air to help form thunderstorms.
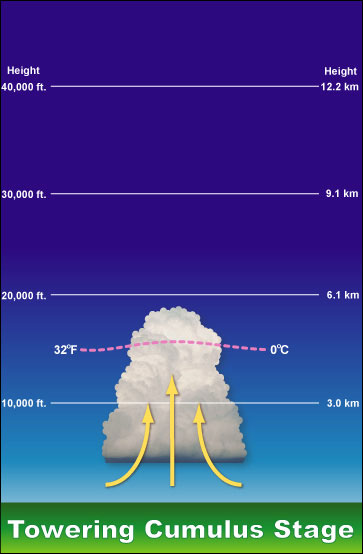
Once all of these components are brought together, the thunderstorm then goes through a 3-stage life cycle:
|
Development or Cumulus Stage: A cumulus cloud forms and begins to grow vertical, usually above 20,000 ft. Usually, little, if any, rain occurs during this stage. There might be occasional lightning. |
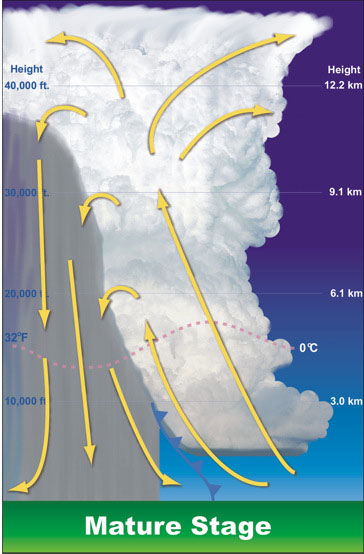
Mature Stage: The cloud has grown in considerable height, now in the range to 40,000 to 60,000 ft. Strong updrafts and downdrafts coexist within the storm. This is the most dangerous stage of the storm and is the most likely time for hail, heavy rain, lightning, strong winds and tornadoes. Storms occasionally have a black or dark green appearance. |
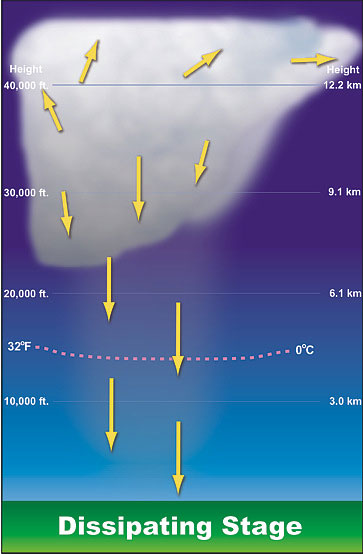
Dissipating Stage: The downdraft cuts off the updraft, which cuts off the supply of warm moist air to the storm and therefore, it dissipates. Rainfall decreases in intensity, along with winds, though strong gusts are still possible. Usually, the anvil top of the cloud is all that remains of the initial cumulus cloud. |
|||
|
|
|
Types of Thunderstorms
- Ordinary Cell: As the name implies, this is a thunderstorm with only one cell. It's commonly referred to a 'pulse' thunderstorm.
- Multi-cell Cluster: These are thunderstorms that are organized in clusters of 2-4 short-lived cells.
- Multi-cell Line: Some thunderstorms will form in a line which can extend laterally for hundreds or miles. These 'squall lines' can persist for hours and extend for hundreds of miles. Squall lines can be continuous or with breaks and include contiguous precipitation. Long-lived squall lines are known as "derechos" and can travel hundreds of miles, causing considerable damage along their path.
- Supercell Thunderstorms: These are potentially the most dangerous form of all thunderstorms types. Supercell thunderstorms have produced numerous long-lived strong and violent (EF2-EF5) tornaodes, along with damaging wind, hail and flash floods.
Thunderstorm Hazards
- Hail: Hail is a showery precipitation in the form of irregular pellets or balls of ice more than 5mm in diameter, falling from a cumulonimbus cloud. Hailstones are formed when updrafts carry raindrops up into the highest parts of the cloud and the super-cooled liquid droplets collide. Hail drops back down into the warmer part of the cloud and carried back up, until the internal up and downdrafts can no longer support the size of the hailstone, then it falls to the ground.
Hail size typically refers to the diameter of the hailstones. To make it easier to report, the following descriptions are often used:
Description Diameter (inches) Pea 0.25 Marble or Mothball 0.50 Penny or Dime 0.75 Nickel 0.88 Quarter 1.00 Half Dollar 1.25 Ping Pong Ball 1.50 Golfball 1.75 Hen's Egg 2.00 Tennis Ball 2.50 Baseball 2.75 Tea Cup 3.00 Grapefruit 4.00 Softball 4.50 So, why does Florida have so many thunderstorms, but not that many instances of hail? The freezing level in a Florida thunderstorm is so high; hail often melts before it reaches the ground. Even though hail is not common to the state, there have been about a dozen events of hail of over 3 inches being reported in Florida.
One event in 1996 in Lake Wales, hail as big as softballs was reported. Damage to the area was done to windows, roves and cars totaling $24 million. In 2007, the area of Kendrick (North of Ocala) reported hailstones ranging in size from 2 to 4 inches.
- Wind: Damaging winds are more likely to be associated with thunderstorms than tornadoes. In fact, many confuse damage produced by "straight-line" winds and often erroneously attribute it to tornadoes. The source of the damaging winds is the downdraft within the thunderstorm. A downdraft is a column of cool air that rapidly sinks to the ground that is usually accompanied by precipitation in a thunderstorm.
Downdrafts can cause downburst, which can be further classified as either microbursts or macro bursts.
A downburst is a strong downdraft current of air from a cumulonimbus clouds and is often associated with intense thunderstorms.
- Microburst: A downdraft that can affect an area of less than 2½ miles wide with peak winds lasting less than 5 minutes.
- Macroburst: A downdraft that can affect an area of at least 2½ miles wide and with peak winds lasting between 5 and 20 minutes. Intense macrobursts may cause tornado-force damage of up to F3 intensity.
- Tornadoes: See the Florida tornadoes section.
- Flash Floods: Except for heat related fatalities, more deaths occur due to flooding than from any other hazard. The main reason is because people underestimate the power and force of water. The effects of flooding can be felt on local, state and even regional scales. In Florida, flooding occurs frequently, but most of the floods are minor. However, Floridians must be careful because even minor floods can cause many deaths.
Floods are caused by rain, but flooding is more about how much rain falls, how fast it falls, and what happens to the rain after it hits the ground. The most common type of flood that happens during a thunderstorm is a flash flood. Most flash floods are caused be slow moving thunderstorms, thunderstorms that repeatedly move over the same area, or heavy rains from a tropical storm or hurricane. These floods can develop quickly depending on the intensity and duration of the storm, the topography of the area, soil conditions and ground cover.
- Lightning: Lightning is the most lethal component of the thunderstorm. While the conditions needed to produce lightning are understood, how lightning forms has never been verified. Forecasters may never able to forecast when and where a lightning strike will take place.
Florida is the lightning capital of the country, mainly due to our geography. The very elements that make our state a great place for outdoor activities -- warm temperatures and plenty of water -- also make the environment primed for the production of thunderstorms, which generate lightning.
|
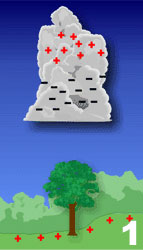
Lightning develops during the violent circulation of air within the cumulonimbus cloud. The friction causes the positive and negative charges within the storm to separate. In addition, an electrical field develops between the base of the cloud and the ground. However, the electrical field in the cloud is stronger and most of the lightning (~75%) is contained within the cloud.
|
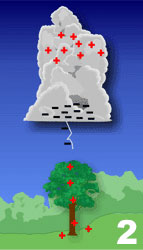
As the difference in the charge continues to increase, positively charged particles will rise up in taller objects, such as trees, telephone poles, and even buildings. A channel of negative charge, called a stepped ladder, will descend from the bottom of the storm cloud toward the ground. This is invisible to the human eye.
|
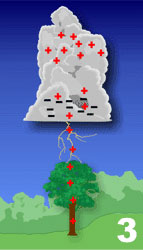
The positive charge that has collected in the tall object on the ground 'reaches' out to the approaching negative charge with its own channel, called a streamer. When these channels connect, the resulting electrical transfer is what we see as lightning. If enough of the charger is leftover, additional strokes will use the same channel and give the bolt the appearance of flickering. Lightning heats up the air to 50,000 degrees Fahrenheit, and this rapid heating of the air produces a shockwave that results in thunder.
|
Lightning has both negative and positive polarities. Most lightning forms at the bottom of the cloud, though less than 5% of all lightning occurs from the top of the anvil, making it a positive lightning strike. Positive lightning is very dangerous for several reasons. Since it comes from the top of the anvil cloud, the electric field is much stronger than a negative strike (almost ten times greater!). Some positive strikes can strike the ground beneath the cloud; however, most positive strikes occur near the edge of the cloud or can strike more than 10 miles away. Positive lightning is often responsible for the phenomenon commonly referred to as a "bolt from the blue". Positive strikes are more lethal and cause greater damage than negative lightning.
|
|
|
The global average annual occurrence of lightning, April 1995-February 2003. Courtesy of the National Weather Service. |
Subcategories
Building A, Suite 292
Tallahassee, FL 32306-2741
Phone: (850) 644-3417 | (850) 644-0719
climate@coaps.fsu.edu