- Climate Versus Weather
- Climate Change Versus Global Warming
- What are El Niño and La Niña?
- El Niño Climate Variation Animations
- El Niño/La Niña Impacts Across the Southeast U.S.
- Greenhouse Gases and Climate Change
- What are the Climate Projections for the Southeast USA?
Climate Versus Weather
Climate is the long-term (monthly or longer) pattern of weather conditions in a region. Climate is not the same as weather.
Weather deals with the short-term movement and development of individual weather systems (fronts, cyclones, air masses).
The earth's climate is a dynamic system, with regional variations on many different time scales from seasonal, to year-to-year, up to decades and even longer.
Climate Change Versus Global Warming
“Climate change” refers to the variation in the Earth's global or regional climates over time. It describes changes in the atmosphere over time scales ranging from weeks to decades to millions of years. These changes can be caused by natural processes internal to the Earth, such as continental drift, which affects ocean currents, external forces, such as variations in sunlight intensity, or human activities. “Global warming” has come to refer to an increase in average global temperatures as influenced by increased greenhouse gas concentrations without regard to other factors that may cause climate to change
Natural, long-term changes occur in response to fluctuations in the amount of solar energy reaching the Earth, changing ocean currents, formation or loss of ice sheets, and many other causes. Global climates also vary naturally in response to shorter-term events, such as volcanoes, which send sun-blocking particles into the stratosphere to cool the Earth, or the Pacific Ocean event known as El Niño, which affects global wind patterns, rainfall, temperatures, and other climate features thousands of miles away.
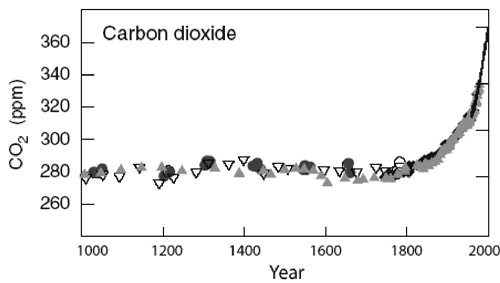
In addition to these natural causes of climate variability, human activities influence climate in many ways. Land use changes, such as irrigation of historically semi-arid areas for farmland, paving and development of sprawling urban areas, draining of wetlands, and emissions of greenhouse gases or aerosols into the atmosphere are all human activities that can affect the Earth’s climate system. Perhaps the most significant human influence today is the increasing levels of greenhouse gases in the atmosphere, including carbon dioxide (CO2), methane (CH4), and nitrous oxides (NOx), which contribute to a general warming of our planet (Figure 1).
What are El Niño and La Niña?
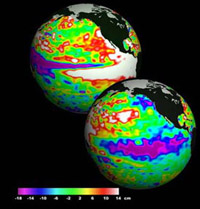
El Niño is a warming of the ocean surface along the equator in the Pacific. During a strong El Niño, surface temperatures can rise as much as 15°F above normal from the coast of Peru across the central Pacific. The heat and humidity from El Niño changes global atmospheric circulation and disrupts weather and climate patterns in many regions around the world.
During a La Niña, the same region of the Pacific Ocean cools. Though the temperature change is usually not as drastic, La Niña occurs just as frequently as the better-known El Niño.
Neutral is the term used when neither El Niño nor La Niña is present in the Pacific. About half of all years are classified as neutral years.
El Niño and La Niña events tend to repeat roughly every four to seven years, although one is not always followed by the other.
This image shows the unusual warming of the tropical Pacific during the 1997 El Niño (top left) and abnormal cooling during the last La Niña (bottom right),courtesy of NASA.
El Niño Climate Variation Animations
A series of animations are available below from AgroClimate, highlighting the impacts of El Niño and La Niña on precipitation and maximum and minimum temperatures across the United States.
Example diagram from the movies detailing differences in temperature associated with an El Niño winter.
El Niño/La Niña Impacts Across the Southeast U.S.
The following table provides a summary of the effects on temperature and precipitation across the Southeast:
| Phase | Region | Oct-Dec | Jan- Mar | Apr-Jun | Jul-Sep |
|---|---|---|---|---|---|
| El Nino | Peninsular Florida | Wet & cool | Very Wet & cool | Slightly dry | Slightly dry to no impact |
| Tri-State Region | Wet | Wet | Slightly wet | No impact | |
| Western Panhandle | No impact | Wet | Slightly Dry | No impact | |
| Central and North Ala. & Ga. | No impact | No impact | No impact | Slightly Dry | |
| La Niña | Peninsular Florida | Dry & slightly warm | Very dry & warm | Slightly wet | Slightly cool |
| Tri-State Region | Slighly dry | Dry | Dry | No impact | |
| Western Panhandle | Slightly dry | Dry | Dry | No impact | |
| Central and North Ala. & Ga. | Dry | Dry in the south, wet in NW Ala. | No impact | Wet in NW Ala. | |
| Neutral | All Regions | No impact | No impact | No impact | No impact |
An important addition not highlighted in the table, however, is the probability of a debilitating freeze across the region during each of these three phases. During a neutral phase, the likelihood of a severe freeze is much greater than during either an El Niño or a La Niña event. Appropriate precautions should be taken to minimize potential losses in the event of a severe freeze during one of these years. For more information on freezes see the AgroClimate Freeze Forecast.
Greenhouse Gases and Climate Change
Much of the CO2 that we release to the atmosphere is a by-product of energy use, whether through burning fuels for transportation, generation of electricity, or other purposes. Burning fossil fuels releases carbon dioxide into the atmosphere, increasing atmospheric carbon and altering the pre-existing balance of greenhouse gases.
Greenhouse gases, including CO2, have the property of allowing the atmosphere to retain more heat energy as their concentration in the atmosphere increases. Water vapor is the Earth’s most important greenhouse gas. Water vapor and clouds cause most of the Earth’s greenhouse effect, accounting for about 90% of the total heat-retaining capacity of the atmosphere. Two bases for the conclusion that human activity has contributed to recent trends in climate change are: 1) observations that atmospheric CO2 concentrations have increased from about 280 parts per million (ppm) to nearly 400 ppm over past 150 years while global average temperatures have warmed about 1.25° degrees Fahrenheit (°F), though the temperature vs. CO2 correlation is not perfect, and 2) scientific theories of atmospheric physics and heat transfer. This rise in global average temperature has tracked increases in CO2 emissions from burning fossil fuels, deforestation, and other sources, which supports the hypothesis formulated by physical scientist Guy Stewart Callendar in 1930 that CO2 emissions could enhance the greenhouse effect.
|
|
|
Figure 2. Atmospheric CO2 concentrations as measured from ice cores and direct measurements. Source: Fourth Assessment of the Intergovernmental Panel on Climate Change (IPCC). What are the Climate Projections for the Southeast USAForecasting weather and climate is not an exact science. Projections of climate change are based on climate models, which are complex computer programs that attempt to describe how the atmosphere will behave through time in response to the forces that act upon it. The computer models try to mimic how climate variables might respond to greenhouse gases and other projected results of human activities over the next 100 years. According to the 2007 report of the Intergovernmental Panel on Climate Change (IPCC), these models indicate that global average surface temperatures may rise anywhere from 3°F to 7°F by the year 2099. History has shown that global increases in temperature are not evenly distributed. For this reason, one cannot simply add 3°F to 7°F to existing temperatures in the Southeast for an idea of future climate. More importantly, a changing climate will likely not affect just the average temperature, but also the occurrence of extreme events and the variability of temperature over time and space. We do know, however, that droughts, floods, heat waves, and storms are likely to become more frequent and/or severe. Another impact of climate change is on the height of the sea level. As average global ocean temperatures increase, ocean water expands and sea levels rise. The Intergovernmental Panel on Climate Change estimates that global sea levels will rise from 8 to 23 inches by 2099. In the Southeast, sea level has risen steadily over the last 100 years at a rate of 8.5 inches per century with no apparent acceleration. To summarize, the climate of the Southeast is already changing and is very likely to continue changing over the coming decades. While the extent of these changes is still uncertain and will depend in part on human actions, we need to prepare for the challenges posed by climate change by becoming a more efficient society, reducing greenhouse gas emissions, identifying vulnerable sectors of society, and developing adaptation strategies. For more information about how climate change is expected to impact the Southeast U.S., read the latest National Climate Assessment, released in 2018. |