


The Florida Climate Center serves as the primary resource for climate data, information, and services in the state of Florida.

The Florida Climate Center achieves its mission by providing climate monitoring, research, and expertise to be applied by the people, institutions, and businesses of Florida and the surrounding region.
We provide direct service by fulfilling requests for climate and weather data and information in a variety of formats.
We perform research that advances the understanding of the climate variability and changes of Florida and the surrounding region.
We provide outreach in presentations and at events aimed at a variety of groups, interests, and ages.
Prepared by David F. Zierden and Melissa Griffin
Florida Climate Center
The Florida State University
Tallahassee, FL
Temperatures moderate as spring arrives. The month of March began with the last surge of winter as a fairly strong cold front brought temperatures well below normal for March 2nd through the 4th. Coldest temperatures were recorded on the mornings of March 4th with readings in the upper 20's or low 30's in north Florida and lower 40's across central Florida. This would turn out to be the last significant cold snap of the month. The remainder of March brought an extended warming spell where afternoon high temperatures reached the 70's or low 80's just about every day in north Florida and higher in central and south Florida. Persistent ridging across the southeast U.S. brought warm southerly winds and moderate temperatures until the last week of the month. Averaged over the whole month of march, temperatures ranged from around 2 degrees warmer than normal in the western Panhandle to near normal across the rest of the State.
| Station | Average Temperature | Departure from Normal |
| Pensacola | 62.5 | 2.3 |
| Tallahassee | 61.5 | 0.4 |
| Jacksonville | 62.0 | 0.4 |
| Orlando | 65.7 | 1.0 |
| Tampa | 69.2 | 1.8 |
| Miami | 72.7 | 0.3 |
| Key West | 73.0 | -0.8 |
Table 1: March average temperatures and departures from normal for selected cities (degrees F.).
Last week of March brings heavy rains to the Panhandle, dryness elsewhere. The last week of March brought a shift in the large-scale weather patterns across the Southeast U.S., characterized by an active pattern with frequent low pressure systems moving across the northern Gulf Coast. These systems were accompanied by classic pre-frontal squall lines that dumped heavy rain across the Panhandle and north Florida on March 26-28th and again on the 31st. The slow-moving nature of these systems resulted in widespread heavy rainfall across the entire area, with weekly accumulations of nearly 20 inches north of Pensacola, decreasing to 5-6 inches near Tallahassee as you move eastward. This active weather pattern continued into the first week of April with even more heavy rainfall events for North Florida, Alabama, and Georgia. We will not detail the nature of these events in this summary for March, but will address the major flooding issue that the combined totals produced.
Unfortunately, these torrential rains failed to progress down the peninsula where the driest areas of the State are located. South of a diagonal line from Gainesville to St. Augustine, the peninsula received only 1-2 inches during the month of March and continued the string of months with below-normal rainfall. The one exception is the area around Pompano Beach, where a localized heavy storm produced 6.05 inches on March 18. CoCoRaHS observers in the area also reported totals over 6 inches.
| Station | Total Rainfall | Departure from Normal |
| Pensacola | 12.34 | 5.14 |
| Tallahassee | 5.29 | -1.18 |
| Jacksonville | 4.79 | -0.86 |
| Orlando | 1.39 | -2.45 |
| Tampa | 0.98 | -1.86 |
| Miami | 1.78 | -0.78 |
| Key West | 0.72 | -1.14 |
Table 2: March precipitation totals and departures from normal for selected cities (inches).
Pacific Ocean impacts on the climate. La Niña, a condition of colder than normal sea surface temperatures in the equatorial Pacific Ocean, began to break up in the month of March. La Niña is known to bring warm and dry winters to Florida and the Southeast. Ocean temperatures have warmed to near-normal in the past month near the Pacific equator and the atmosphere over the region is now behaving more like neutral conditions. A return to Neutral conditions in the Pacific Ocean means that the remainder of spring and early summer will have no predisposition towards either wetter, drier, warmer, or colder than normal climate patterns.
Major flooding on north Florida rivers. The progression weather systems in late March/early April producing heavy rainfall across north Florida, Alabama, and Georgia has resulted in major flooding in low-lying areas and record or near record heights on area rivers. Below are some of the recorded or forecast river crests from the NWS Southeast River Forecast Center:
Pinetta Florida on the Withlacoochee River - Record Flood
- Pinetta is forecast to crest at a new record near 88.00 feet. The old record was 85.05 on April 5th 1948.
Ellaville Florida on the Suwannee River - Major Flood
- Ellaville is forecast to crest next weekend at a level that would be the 2nd highest on record. Florida Department of Transportation may be required to close a portion of Interstate 10 near the Suwannee River.
Three Rivers Estates on the Suwannee River - Major Flood
- Three Rivers Estates is forecast to rise above major flood level towards mid week.
Havana Florida on the Ochlockonee River - Major Flood
- Havanna crest at 33.45 feet, a major flood, and just under the 2nd highest flood on record. The 2nd highest flood on record was 33.71 feet.
Altha Florida on the Chipola River - Major Flood
- Altha crest at 30.66 feet with was the 4th highest level on record.
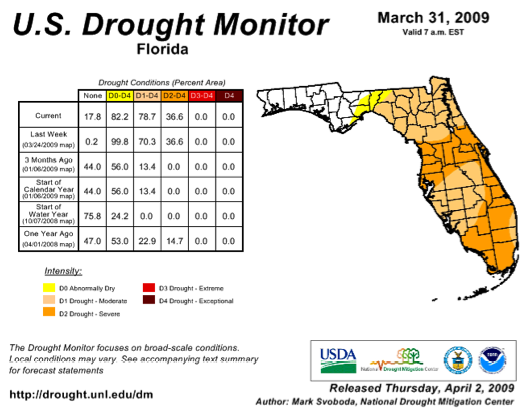
Drought impacts. As stated above, the heavy rains of late March/early April failed to penetrate down the peninsula south of Gainesville. With winter rainfall deficits from 5 to 10 inches, drought continues to worsen across central and south Florida. According to the U. S. Drought Monitor, most of the peninsula is now classified as being in moderate or severe drought. Fortunately, Lake Okeechobee levels are higher this year (due to tropical storm Faye) heading into the critical spring period than they were during the last drought years of 2007 and 2008. The big lake is a critical resource for municipal and agricultural water supply in south Florida.
The Southwest Florida Water Management district has restricted watering of lawns to once per week across the entire district with stricter restriction in Pinellas, Pasco, and Hillsborough counties. The South Florida Water Management District is proposing year-round watering restriction to help mitigate recurring water shortages.
Severe weather. The series of storms across north Florida on the last week of March brought some reports of sever weather, though no significant damage. Wind damage and a possible tornado were reported in Santa Rosa and Walton counties on the 26th. Hail, wind damage, and possible tornadoes were reported in half a dozen Panhandle counties on March 27th. Trees and power lines were reported down in north central Florida Counties on the 28th. More reports of wind damage, hail, and possible tornadoes across north Florida and Central Florida on March 31st.
Impacts on agriculture and forestry. The heavy rains across north Florida have delayed field work for row crops such as corn and peanuts. Fields prepared for planting were flooded and some reported soil erosion. Some pastures in north Florida are waterlogged. Elsewhere, warm temperatures have pastures greening up and winter forages have reached maturity.
The dry weather superimposed on the peninsula's typical dry winter season has forests and fuels dangerously dry for wildfire potential. The Florida Division of Forestry reports that portions of central and south Florida have Keetch-Byram Drought Index (KBDI) values over 700 corresponding to a severe threat. Also, recent freezes have browned up smaller fuels and vegetation which will only add to the threat.
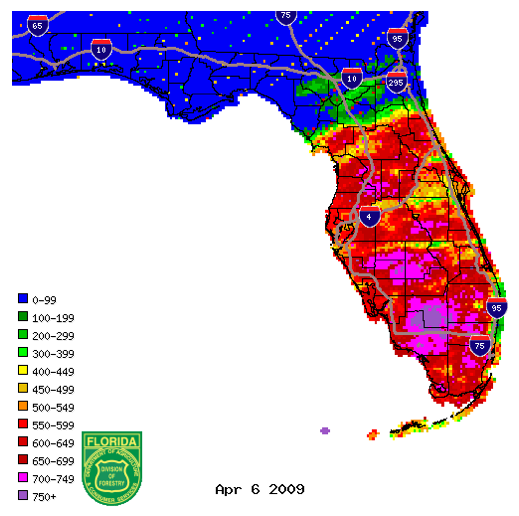
Figure 1: KBDI values from radar-derived precipitation estimates (Courtesy of FL DOF).
Prepared by David F. Zierden and Melissa Griffin
Florida Climate Center
The Florida State University
Tallahassee, FL
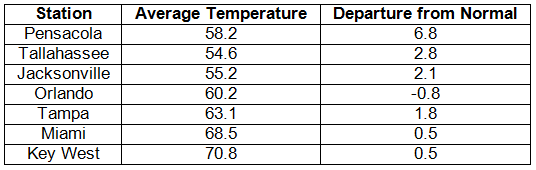
Winter maintains its cold grasp during February. The winter of 2008-2009 will be remembered as a fairly cold one in the state of Florida. February temperatures averaged generally below normal across all of the state with the exception of the far western Panhandle. Average monthly temperature ranged from nearly from nearly 4 degrees below normal in the Tallahassee area to around 1 degree below normal in central and south Florida.
| Station | Average Temperature | Departure from Normal |
| Pensacola | 54.5 | 1.0 |
| Tallahassee | 51.1 | -3.7 |
| Jacksonville | 53.0 | -2.8 |
| Orlando | 59.2 | -1.7 |
| Tampa | 61.8 | -0.9 |
| Miami | 68.0 | -1.1 |
| Key West | 67.8 | -3.0 |
Table 1: February average temperatures and departures from normal for selected cities (degrees F.).
February brought two significant cold spells, the first on February 3rd through the 7th. The coldest night of this event occurred on the evening of February 4th/morning of the 5th where freezing temperatures once again extended all the way to south Florida. The coldest temperature was recorded in Tallahassee at 14 degrees, but freezing temperatures were recorded as far south as Sarasota and Palm Beach counties. Traditionally colder areas such as inland depressions and sandy soils were several degrees colder. This event marked the third time this winter that freezing temperatures covered much of the State.
The second cold spell lasted from February 20th-24th, but did not bring widespread freezing temperatures. The month did not experience any extended stretch of unseasonably warm weather.
Dry February worsens drought conditions. February continued the trend of a drier than normal winter across all of Florida. Rainfall deficits for the month generally ran 1 to 2 inches. This deficit does not sound like much, but considering that the peninsula of Florida is generally quite dry during the winter (only averaging 2-3 inches per month), these deficits are significant and represent a high percentage of normal rainfall. South Florida has been hit the hardest, where some weather stations recorded the dries winter (Dec. through Feb.) on record. Both Miami International Airport and Fort Lauderdale International set new records with only 0.74 inches and 0.39 inches, respectively. Palm Beach International Airport and Naples Regional Airport both ranked second, with 2.01 and 1.07 inches, respectively.
| Station | Total Rainfall | Departure from Normal |
| Pensacola | 3.81 | -1.29 |
| Tallahassee | 2.50 | -2.13 |
| Jacksonville | 0.98 | -2.17 |
| Orlando | 0.80 | -1.83 |
| Tampa | 0.71 | -1.96 |
| Miami | 0.35 | -1.54 |
| Key West | 0.65 | -0.86 |
Table 2: February precipitation totals and departures from normal for selected cities (inches).
Other weather and climate impacts. La Niña, a condition of colder than normal sea surface temperatures in the equatorial Pacific Ocean, continued to exert its influence on the State's climate. La Niña is known to bring warm and dry winters to Florida and the Southeast and our lack of rainfall is in line with past events. On the other hand, temperature patterns have not been typical of La Niña recently. The dramatic swings between warm and cold, along with the outbreaks of cold arctic air are more reminiscent of winters during the neutral phase.
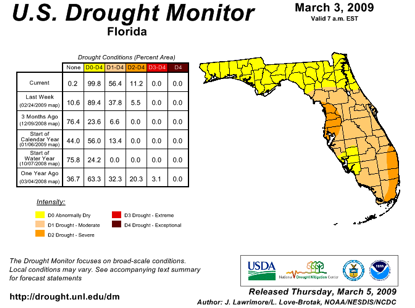
With the lack of winter rainfall, drought has developed and spread across much of the state. According to the U. S. Drought Monitor, most of the peninsula is now classified as being in moderate drought, with the coastal areas of southeast Florida and the big bend north of Tampa classified as severe. North Florida and the Panhandle have faired a little better and are considered abnormally dry. Fortunately, Lake Okeechobee levels are higher this year (due to tropical storm Faye) heading into the critical spring period than they were during the last drought years of 2007 and 2008. The big lake is a critical resource for municipal and agricultural water supply in south Florida.
North Florida was hit with a couple rounds of severe weather in the month of February. The first major weather maker area was a long-lived supercell thunderstorm that developed in southwest Alabama east of Mobile and traversed the Florida Panhandle and much of South Georgia on the afternoon of February 18th. The supercell produced baseball-sized hail and 70-80mph wind gusts in Walton and Holmes Counties before eventually becoming tornadic over South Georgia.
On Saturday, February 28, 2009, a vigorous upper-air disturbance was approaching the southeast U.S. from the northwest. A surface low developed on the frontal boundary in Georgia, which began to push the front southward into southern Alabama and the Florida Big Bend on Saturday evening. Out ahead of the cold front, moist, unstable air, coupled with increased vertical wind shear, produced several severe thunderstorms across the Tallahassee area. Straight-line wind damage was reported in the eastern Florida Panhandle. Golfball-sized hail was also reported in Holmes County, Florida, north of Interstate 10 near New Hope. Four fishermen were reported missing off the coast of Clearwater on the 28th when their boat capsized due to rough seas that built to 10-14 feet behind the front. One of the men was later rescued clinging to the overturned hull, but the other three remain missing and the search has been suspended.
Impacts on agriculture and forestry. The freezing temperatures in the first week of February had some impact on agriculture, but nothing overly damaging. In anticipation of the freezing weather, weight restrictions on citrus trucks were relaxed by the State of Florida allowing the pre-freeze harvest and movement of fruit. Otherwise, trees were acclimated to the cold from the January freezes and sustained little damage. Various levels of damage were reported to sugar cane south of Lake Okeechobee. Strawberry harvesting reached its peak in February with good supply and demand. In north and central Florida, the cold and dry conditions have limited the growth of winter pasture and rye grasses. Ranchers are needing to supplement feed with hay.
The dry weather superimposed on the peninsula's typical dry winter season has forests and fuels dangerously dry for wildfire potential. The Florida Division of Forestry reports that portions of central and south Florida have Keetch-Byram Drought Index (KBDI) values over 700 corresponding to a severe threat. Also, recent freezes have browned up smaller fuels and vegetation which will only add to the threat.
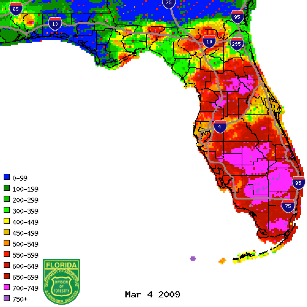
Figure 1: KBDI values from radar-derived precipitation estimates (Courtesy of FL DOF).
Prepared by David F. Zierden and Melissa Griffin
Florida Climate Center
The Florida State University
Tallahassee, FL
Winter cold returns in January after a warm December. The roller-coaster ride of unseasonably warm periods followed by chilling cold temperatures continued over Florida this past month, which is typical of the winter season in this state. Temperatures during the first two weeks of January ran generally normal to above normal, with several days of afternoon highs in the high 70's to low 80's during the first week. No significant cold fronts passed through during this time. Beginning on January 14, a large-scale pattern set up with high pressure ridging in the western United States and deep troughing over the eastern U. S. This pattern brought a series of cold fronts and arctic air masses to the area that kept temperatures well below normal over the next 10-12 days.
The coldest temperatures of the year occurred during this time coinciding with an unusually strong arctic air mass that settled over the region on January 20-23. Strong northerly winds on the night of January 20 brought freezing temperatures as far south as Fort Pierce and Okeechobee that night and early the next morning. Florida Automated Weather Network (FAWN) stations at Immokalee, Palmdale, and Belle Glade recorded temperatures of 30, 31, and 32 degrees respectively. On the next night (January 21-22), the very dry high pressure center settled over the state calming winds and setting the stage for a classic radiational freeze event. Radiational freezes can be very damaging, as temperatures drop quickly after sunset leading to extended periods of freezing temperatures. This evening/early morning brought the coldest temperatures since 1997 to some parts of the state and since 2001 to others. Temperatures in the teens to low 20's covered most of inland Florida as far south as Polk County. Elsewhere in south Florida, freezing temperatures were recorded across many locations and as far south as Dade County, with the coldest pockets occurring in lower elevations and over sandy soils. Curiously, no official records for daily low temperatures were broken during this event.
Warm temperatures returned again in the last week of January, with several locations in central and south Florida recording record daytime high temperatures on January 29th and 30th.
| Station | Average Temperature | Departure from Normal |
| Pensacola | 52.4 | 2.3 |
| Tallahassee | 52.1 | 0.3 |
| Jacksonville | 52.9 | -0.2 |
| Orlando | 59.2 | -1.7 |
| Tampa | 61.1 | -0.2 |
| Miami | 67.5 | -0.6 |
| Key West | 68.5 | -1.8 |
Table 1: January average temperatures and departures from normal for selected cities (degrees F.).
January generally drier than normal. Generally drier than normal conditions persisted across Florida in January. Rainfall deficits for the month ranged from over 4 inches in Tallahassee to around 1.5 inches in south Florida. The driest areas right now are around the southeast coast of Florida, where rainfall totals for the month of January were less than half an inch. The West Palm Beach area had perhaps the driest January on record, only record 0.11 inches of rainfall. The only significant widespread rainfall event was on January 29-30, where much of central and north Florida saw 1-2 inches prior to the passage of a cold front.
| Station | Total Rainfall | Departure from Normal |
| Pensacola | 3.54 | -2.21 |
| Tallahassee | 1.27 | -4.09 |
| Jacksonville | 3.01 | -0.68 |
| Orlando | 2.08 | -0.35 |
| Tampa | 2.38 | 0.11 |
| Miami | 0.35 | -1.54 |
| Key West | 0.81 | -1.41 |
Table 2: January precipitation totals and departures from normal for selected cities (inches).
Other weather and climate impacts. In a broader scope, it appears that the tropical Pacific Ocean has fallen back into the La Ni%ntilde;a phase (colder than normal waters along the equator in the eastern and central Pacific). La Ni%ntilde;a is known to bring warm and dry winters to Florida and the Southeast and is likely responsible for the relatively dry weather thus far this winter. On the other hand, temperature patterns have not been typical of La Ni%ntilde;a recently. The dramatic swings between warm and cold, along with the outbreaks of cold arctic air are more reminiscent of winters during the neutral phase.
Florida was relatively free of any severe weather in the past month.
Impacts on agriculture and forestry. The freezing temperatures of January 21st and 22nd have had the largest impact on agriculture this month. The citrus regions relied heavily on the use of irrigation for cold protection of fruit and vegetation. Strawberry growers around Plant City and Dover also tried to protect fruit and plants with irrigation and coverings, but some damage was reported to fruits and to blooms. Some fields may lose a harvest cycle due to flower damage. Other vegetable growers reported significant damage, especially to sensitive crops like bell peppers and tomatoes. The tropical fish industry, centered around the Tampa and Lakeland area, suffered losses up to 20% to 30% in uncovered ponds.
The dry weather superimposed on the peninsula's typical dry winter season has forests and fuels dangerously dry for wildfire potential. The Florida Division of Forestry reports that portions of central and south Florida have Keetch-Byram Drought Index (KBDI) values over 700 corresponding to a severe threat. Also, recent freezes have browned up smaller fuels and vegetation which will only add to the threat.
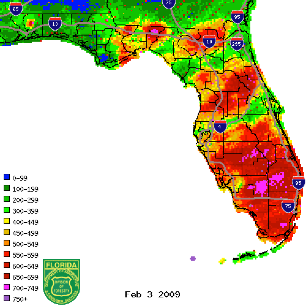
Figure 1: KBDI values from radar-derived precipitation estimates (Courtesy of FL DOF).
Prepared by David F. Zierden and Melissa Griffin
Florida Climate Center
The Florida State University
Tallahassee, FL
December warms after a cold fall season. After a cold beginning to the fall season, where temperatures from late October through November averaged around 5 degrees below normal, a warm pattern set in for the month of December. Average temperatures ranged from 1 to 2 degrees above normal in central and south Florida to 3-4 degrees above normal over north Florida. The coldest temperatures of the month occurred after a fairly vigorous cold front passage on December 2nd and 3rd, with freezing temperatures reported as far south as Ocala on the morning of the 2nd. The second half of December was quite warm for the entire state with only one notable cold front passage on or around December 22. With the exception of this date, almost all other days in the second half of December have seen daily temperatures warmer than normal, up to 10 to 12 degrees warmer in most cases. A record low temperature for the date was set at Sarasota-Bradenton with a recording of 39 degrees on the morning of December 3. Numerous record high temperatures were set or tied across north Florida between December 19th and 25th.
| Station | Average Temperature | Departure from Normal |
| Pensacola | 57.1 | 3.0 |
| Tallahassee | 56.6 | 2.9 |
| Jacksonville | 59.0 | 4.0 |
| Orlando | 64.5 | 1.5 |
| Tampa | 66.1 | 2.8 |
| Miami | 71.7 | 1.8 |
| Key West | 71.3 | -0.7 |
Table 1: December average temperatures and departures from normal for selected cities (degrees F.).
December generally drier than normal. Nearly all locations in Florida recorded below normal rainfall during the month of December. Departures from normal ranged from 1 to 3 inches for the month. The state experienced one major rain event on December 10th and 11th from a low pressure system that developed in the northern Gulf of Mexico and moved slowly inland across the Panhandle. Precipitation totals from this system were heaviest at Okaloosa County where totals from 4 to 6 inches were reported and in Jackson and Holmes counties, where totals reached 6 to 8 inches. The remainder of the state generally saw totals between half and inch to one inch. One daily record for rainfall was set at Fort Myers with 1.83 inches accumulating on December 11.
| Station | Total Rainfall | Departure from Normal |
| Pensacola | 3.27 | -0.70 |
| Tallahassee | 1.39 | -2.71 |
| Jacksonville | 0.59 | -2.05 |
| Orlando | 0.93 | -1.78 |
| Tampa | 1.23 | -1.07 |
| Miami | 1.28 | -1.90 |
| Key West | 0.89 | -1.25 |
Table 2: December precipitation totals and departures from normal for selected cities (inches).
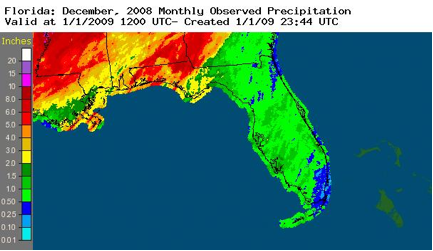
Figure 1: Radar-derived rainfall totals for the month of December (inches)
Other weather and climate impacts. Much of December was free from any severe or high impact weather events, with a few minor exceptions. The heavy rain event mentioned above did result is some minor flooding of small rivers and streams in areas around Tallahassee and the western Panhandle. The same system was also responsible for scattered reports of wind damage across north Florida and Pinellas County. Otherwise, the freezing temperatures seen across north Florida on December 2nd and 3rd were not overly damaging and well within the range of expected weather for this time of year.
In a broader scope, it appears that the tropical Pacific Ocean has fallen back into the La Niña phase (colder than normal waters along the equator in the eastern and central Pacific). La Niña is known to bring warm and dry winters to Florida and the Southeast and is likely responsible for the warming (and drier) trend seen in the second half of the month.
Impacts on agriculture. The unseasonably warm second half of December has slowed chill accumulations over much of the area. Chill accumulation over the winter is important to flowering fruit crops such as blueberries, peaches, and strawberries and promotes proper fruit setting. Chill accumulation was ahead of normal during the colder period of late October through the first week of December, but has slowed considerably during the recent warm spell. The warmer temperatures have enhanced development of other crops, namely winter vegetables and winter wheat. Winter forages for cattle were doing well with the warm temperatures in areas of north Florida that have received adequate rain. Dry and warm conditions in the citrus belt have producers irrigating more.
Prepared by Melissa Griffin, Preston Leftwich, and David F. Zierden
Florida Climate Center
The Florida State University
Tallahassee, FL

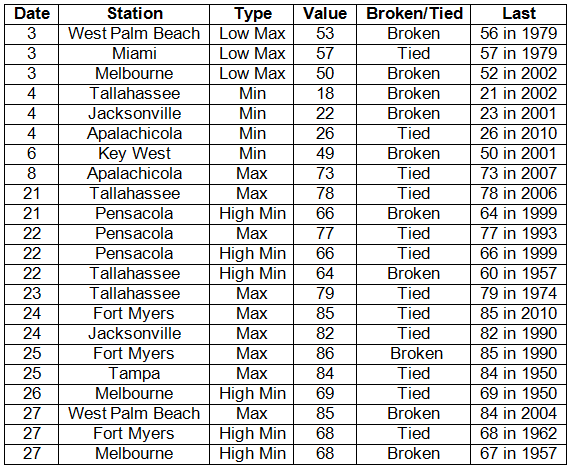
Average temperatures were mainly above normal in January. Average temperatures were above normal for most of the state, with the exception of Orlando (Table 1). Departures from normal ranged from -0.8°F at Orlando to a staggering 6.8°F at Pensacola. The warmer temperatures have the public and some media outlets calling this "The Year Without a Winter." Unlike the Januarys of 2010 and 2011, there was very little cold air that made it into Florida. There were two strong cold fronts that passed through the state at the beginning of the month, leading to record low temperatures being tied and broken on the 3rd and 4th (Appendix). For the rest of the month, most of the state experienced warmer than normal temperatures that are typically reported with La Niña conditions, and various record high temperatures were tied and broken at the end of the month (Appendix).
Table 1: January average temperatures and departures from normal (° F) for selected cities.
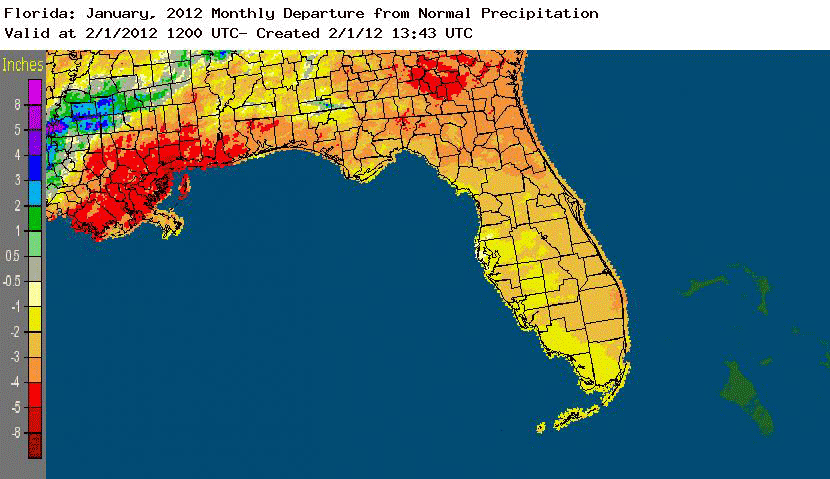
Rainfall totals below normal statewide in January. Rainfall totals were below normal statewide in January (Table 2). North Florida and the Panhandle had 2 inches or more below typical rainfall amounts for the month, which compounded the drought problems that have been lingering since October 2010. The month was the driest on record at Orlando and was the 4th driest on record at Jacksonville. Though rainfall was scarce across the state, there were a few daily precipitation records that were broken during January (Table 3). Areal patterns of monthly rainfall relative to normal are depicted in Figure 1.
Table 2: January precipitation totals and departures from normal (inches) for selected cities.
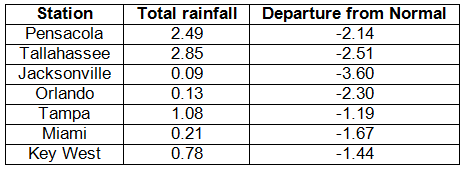
Table 3: Daily rainfall records (inches) broken during January (compiled from NOAA, NWS).
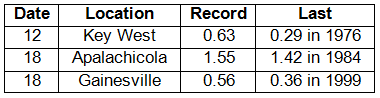
Figure 1: A graphical depiction of the monthly rainfall departure from normal (inches) for January is given in the figure below (courtesy of NOAA, NWS).
La Niña continued during January. La Niña conditions continue to be present across the equatorial Pacific, with sea surface temperatures (SST) at least 0.5°C below average for the region. The atmospheric circulation anomalies and winds are consistent with La Nintilde;a. The current La Nintilde;a is forecasted to continue through the winter of 2011/2012 into the spring, with the possibility of a return to neutral conditions by the summer. The Climate Prediction Center continues to predict warmer than normal temperatures and below normal precipitation through May.
Hazardous weather. A variety of hazardous weather events took place in January. Portions of northern Florida were impacted by high winds from a passing cold front at the beginning of the month. Dense fog was reported in the Panhandle on the 7th and 8th, with visibilities below 0.25 miles. Another passing cold front brought high winds to most of the state with wind gusts of at least 40 mph reported from locations near Pensacola, Jacksonville, and Tampa; while a 58 mph wind gust was recorded near Key West. Storm damage was reported with a vigorous squall line that moved through portions of the Panhandle on the 26th. Reports of trees being felled were received from both Walton and Leon Counties. An EF-1 tornado passed through Port Charlotte on the 27th, damaging a few homes and an apartment complex along its 0.75 mile path.
January also marks the beginning of the wildfire season in Florida, though there have been fires actively burning since fall 2011. Smoke from the Olive Fire, which has burned about 1,000 acres in Putnam County since Thanksgiving 2011, combined with fog to cause visibility problems and accidents at the beginning of the month. Towards the end of the month, the Payne's Prairie wildfire reduced visibilities along portions of US 441 and Interstate 75 and may have been the cause of a deadly accident that took 10 lives in the early morning hours of the 29th. On the 30th, another wildfire in Baker County was reported, causing travel headaches for motorists travelling on Interstate 10 just west of Jacksonville.
Agricultural and other impacts. Freezing temperatures on the 4th-5th caused damage to crops in the interior portions of the state. Fruit and vegetable growers reported freeze damage to snap beans and flowering squash plants. Green beans in Palm Beach County suffered significant damage, with about half of the crop destroyed. Another cold snap the following week led to the use of sprinklers in order to protect the strawberry crop, while the sugarcane crop was assessed for damage. The continued dryness across the state compounded the effects of existing low soil moisture levels.
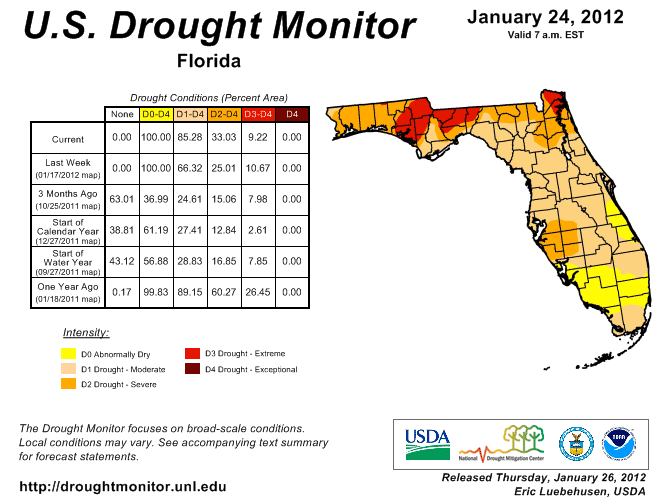
At the beginning of January, about 91% of the state had designated drought conditions; by the end of the month, every part of the state was experiencing drought, with about 86% of the state in moderate drought. The Panhandle continues to be plagued with extreme drought, with some of the areas that had seen improvements in December drying out once again. Manatee, Sarasota, De Soto, and Hardee Counties went from abnormally dry to severe drought during January. Continued La Niña conditions through the remainder of winter and into spring will mean decreased precipitation, and water restrictions remain in place in South Florida (the water level of Lake Okeechobee is now 13.31 ft) and restrictions in other areas could go into effect.
Figure 2: Drought conditions in Florida as of January 24, 2012 (courtesy of U.S. Drought Monitor).
Appendix: Daily maximum and minimum temperature records (° F) tied or broken during January (compiled from NOAA, NWS).
Building A, Suite 292
Tallahassee, FL 32306-2741
Phone: (850) 644-3417 | (850) 644-0719
climate@coaps.fsu.edu