


The Florida Climate Center serves as the primary resource for climate data, information, and services in the state of Florida.

The Florida Climate Center achieves its mission by providing climate monitoring, research, and expertise to be applied by the people, institutions, and businesses of Florida and the surrounding region.
We provide direct service by fulfilling requests for climate and weather data and information in a variety of formats.
We perform research that advances the understanding of the climate variability and changes of Florida and the surrounding region.
We provide outreach in presentations and at events aimed at a variety of groups, interests, and ages.
Prepared by Preston Leftwich, David F. Zierden, and Melissa Griffin
Florida Climate Center
The Florida State University
Tallahassee, FL

Temperatures above normal for October. Monthly average temperatures in October were above normal throughout the state. Jacksonville, Miami and Tallahassee were more than three degrees above normal. The monthly average temperature of 82.4 degrees F at Miami (Table 1) was the warmest on record, breaking a previous record of 82.05 degrees F set in 2002. Record high temperatures were set in all parts of the state. Clewiston recorded 97 degrees F on the 6th. Later, Orlando (8th), Tampa ( 9th and 10th) and Lakeland (29th) later reached 95 degrees F. Also, stations in Central and South Florida recorded 10 or more days with maximum temperatures of 90 degrees F or above. In contrast, numerous low temperature records were set or tied across the state after a strong cold front moved down the peninsula during the middle of the month. The coldest was 36 degrees F at Tallahassee on the 19th, which tied the minimum record for that date. Another cold front moved through the north and central parts of the state on the 28th. The minimum temperature of 38 degrees F at Lakeland on the 29th was the coldest temperature ever recorded during October in Polk County.
Table 1: October average temperatures and departures from normal (degrees F) for selected cities.
| Station | Average Temperature | Departure from Normal |
| Pensacola | 70.6 | 1.1 |
| Tallahassee | 72.2 | 3.1 |
| Jacksonville | 72.9 | 3.5 |
| Orlando | 77.4 | 2.1 |
| Tampa | 78.0 | 2.2 |
| Miami | 82.4 | 3.6 |
| Key West | 84.7 | 2.5 |
October rainfall totals generally near or below normal. A ridge of high pressure kept most of Florida in dry and warm conditions for most of the month. While heavier amounts were observed near the mid-month cold front, particularly in North Florida, most rainfall fell as scattered showers or thundershowers. Rainfall totals for October were mostly near normal in North and Central Florida, but well below normal in South Florida. Fort Lauderdale recorded its all-time driest October (0.73 in), breaking the previous record of 0.94 inches recorded in 1977. While many stations had below normal rainfall, Pensacola recorded a monthly total of 11.28 inches, more than seven inches above normal (Table 2).
Table 2: October precipitation totals and departures from normal (inches) for selected cities.
| Station | Total Rainfall | Departure from Normal |
| Pensacola | 11.28 | 7.15 |
| Tallahassee | 3.37 | 0.12 |
| Jacksonville | 2.02 | -1.84 |
| Orlando | 2.85 | 0.12 |
| Tampa | 2.24 | -0.05 |
| Miami | 2.62 | -3.57 |
| Key West | 1.11 | -3.25 |
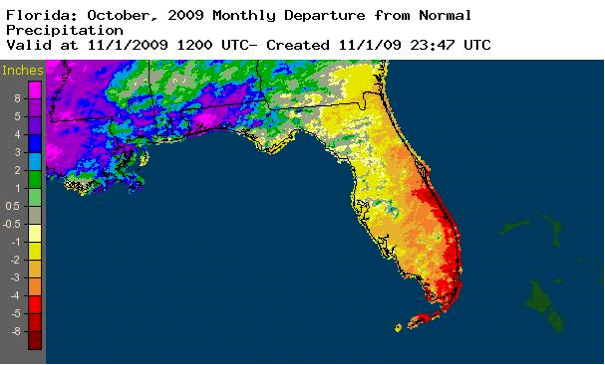
A graphical depiction of the monthly rainfall departure from normal for October is given in the figure below. (courtesy of NOAA NWS). Departures range from over eight inches above normal in the Northwest to more than five inches below normal at some locations near the Southeast coast and Keys.
El Niño continues to build in the Pacific Ocean. Sea surface temperatures in the equatorial Pacific Ocean continued to warm and remain above the 0.5 C threshold designating El Niño conditions. As has been the case this year, Atlantic tropical cyclone activity is known to be suppressed during El Niño conditions.
Hazardous weather. No tropical systems directly affected Florida during October. Two named storms, neither of which became hurricanes, remained far out in the Atlantic Ocean. As a strong cold front entered the state on October 15, golf ball hail and winds of 58 miles per hour were observed southwest of Tallahassee. Several homes were damaged by thunderstorm winds in Woodville. On October 16, thunderstorm winds blew down a small barn in St. Johns County.
Agricultural and other impacts. After some delays to the peanut and cotton harvests due to locally heavy rain in the North, drier weather late in the month allowed the harvests to resume. Some vegetables were damaged by frost and/or cold temperatures. In contrast, some crops in the South suffered heat stress from the abnormally high temperatures. Pastures in some Central and South areas are in poor condition due to the continued below normal rainfall.
Prepared by David F. Zierden and Melissa Griffin
Florida Climate Center
The Florida State University
Tallahassee, FL
Temperatures near normal for September. Monthly average temperatures in September were near normal or slightly warmer than normal for the most part, averaging less than a degree above normal over Central and North Florida to around one and half degrees above normal over South Florida and the Pensacola area. Daily temperatures were very consistently in the normal range for most of the month, running slightly cool to normal in the first half of September and running 2 to 4 degrees warmer than normal during most of the second half. The very end of September brought the first cold front of the year to North and Central Florida. Overnight temperatures fell to the mid 60s over the Panhandle on the night of September 29. By the night of the 30th, the front extended down into south-central Florida. Overnight lows on this night ranged from the upper-forties to mid fifties in the Panhandle, and reached the mid sixties over much of Central Florida. The front did not penetrate south of a Fort Myers to Vero Beach line.
| Station | Average Temperature | Departure from Normal |
| Pensacola | 79.0 | 1.8 |
| Tallahassee | 79.3 | 0.4 |
| Jacksonville | 78.2 | 0.4 |
| Orlando | 81.5 | 0.4 |
| Tampa | 82.5 | 0.9 |
| Miami | 83.9 | 1.5 |
| Key West | 84.7 | 1.2 |
Table 1: September average temperatures and departures from normal for selected cities (degrees F.).
September rainfall totals generally below normal. Rainfall this month was fairly ordinary, characterized by the scattered afternoon thundershowers that are a normal component of Florida's summer climate. Rainfall departures for the month ranged from around one and half inches over Central and North Florida to 2.5 inches at Tallahassee. Most rainfall came from the normal scattered to isolated thunderstorms with no widespread heavy rain events impacting the state this month (unlike our neighbors to the north in Alabama and North Georgia).
| Station | Total Rainfall | Departure from Normal |
| Pensacola | 6.69 | 0.68 |
| Tallahassee | 2.49 | -2.52 |
| Jacksonville | 6.48 | -1.42 |
| Orlando | 4.58 | -1.18 |
| Tampa | 5.24 | -1.30 |
| Miami | 6.83 | -1.55 |
| Key West | 5.31 | -0.14 |
Table 2: September precipitation totals and departures from normal for selected cities (inches).
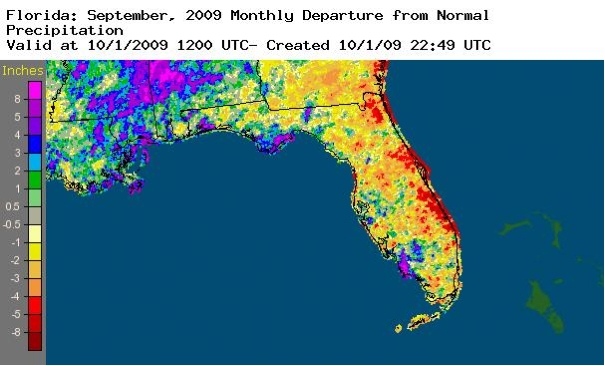
The east coast of Florida did receive less rainfall than the west side of the peninsula and the Panhandle, as seen in the radar-derived rainfall estimates shown below (courtesy of NOAA NWS).
El Niño in place in the Pacific Ocean. Ocean temperatures remain warmer than normal over the central Pacific Ocean and are well above the 0.5 C threshold that commonly designates El Niño conditions. El Niño refers to a periodic (every 2-7 years) of the tropical Pacific Ocean along the equator from the coast of South America to the central Pacific. Modeling centers around the world that predict El Niño/La Niña agree that waters will continue to warm and result in a moderate El Niño during the fall and winter months. Although El Niño impacts on Florida's climate are weak during the summer and early fall, we may have begun to see some influence. The activity of the hurricane season in the Atlantic Basin is known to be suppressed by El Niño, and this year has been no exception.
Hurricane season quiet thus far. One weather feature noticeably absent in September was tropical storm or hurricane activity. Florida did not receive direct influence from any tropical system in the month of September, which is usually the peak month for hurricane activity in the Atlantic Basin. It is likely that the relative inactivity is caused by El Niño, which is know to create and environment of unfavorable vertical shear over the hurricane formation regions of the Atlantic. On average, tropical activity is responsible for roughly 30% of late summer rainfall in Florida and its absence explains the rainfall deficits for the month.
Agricultural and other impacts. As the summer progresses, some farmers are facing the problem of too much moisture rather than not enough. While September rainfall totals were generally normal to below normal, the accumulation of precipitation from previous months combined with frequent lighter showers have kept fields and soils on the moist side. In north Florida, peanut harvest is being delayed by wet fields and cotton quality is beginning to suffer due to the wetness. Around the Hastings area planting of potatoes and vegetables is delayed due to wet soils. Hay quality is suffering due to being over mature.
Excessive rains in Central and Northern Georgia caused elevated river levels approaching flood stage on the Apalachicola River in late September.
Prepared by David F. Zierden and Melissa Griffin
Florida Climate Center
The Florida State University
Tallahassee, FL
Temperatures near normal for July. Most of Florida experienced near-normal summertime temperatures during the month of July. As a whole, north Florida ranged a few tenths to one degree cooler than normal while south Florida was one to two degrees above normal. In general, afternoon high temperatures ran in the upper 80's to low 90's, very typical of summer weather. Low temperatures ranged from the low 70's across north Florida to the high 70's or even 80 in south Florida. The month did begin with a hot spell on July 1-3, when temperatures across north Florida reached the upper 90's. North Florida also experienced a spell of unseasonably cool weather later in the month when overnight low temperatures dipped into the low 60's or even 59 over inland locations. Tallahassee recorded a morning low of 60 on July 21 and Crestview recorded record low July temperatures on the 20th and 21st of 60 and 58. Many daily records for low temperature were set across north Florida during the four day stretch of July 19 through 22.
| Station | Average Temperature | Departure from Normal |
| Pensacola | 82.1 | 0.6 |
| Tallahassee | 81.4 | -1.0 |
| Jacksonville | 81.2 | -0.4 |
| Orlando | 81.3 | -0.4 |
| Tampa | 83.2 | 0.7 |
| Miami | 84.9 | 1.2 |
| Key West | 86.3 | 1.8 |
Table 1: July average temperatures and departures from normal for selected cities (degrees F.).
July rainfall below normal across north Florida, near normal for south Florida. Rainfall this month was fairly ordinary, characterized by the frequent afternoon thundershowers that are a normal component of Florida's summer climate. Rainfall totals for the month ranged from 4 to 5 inches across north Florida and the panhandle (a little below normal), to 5 to 7 inches across the southern portion of the state and over 10 inches in the Tampa area. Coverage was fairly widely distributed, given the spotty nature of the usual afternoon showers. One precipitation event of note did bring very heavy rain to the Tampa area on July 1st. On that day, Tampa set a new record rainfall for that day of 4.72 inches. Tarpon Spring recorded 7.45 inches on that day.
| Station | Total Rainfall | Departure from Normal |
| Pensacola | 5.68 | -0.86 |
| Tallahassee | 4.45 | -3.59 |
| Jacksonville | 5.49 | -0.48 |
| Orlando | 5.19 | 0.02 |
| Tampa | 10.25 | 3.76 |
| Miami | 6.17 | 0.38 |
| Key West | 2.16 | -1.11 |
Table 2: July precipitation totals and departures from normal for selected cities (inches).
El Niño gains steam in the Pacific Ocean. Ocean temperatures in the past months have warmed rapidly in the eastern and central tropical Pacific Ocean and are now above the 0.5 C threshold that commonly designates El Niño conditions. This warming completes the transition from a weak La Niña in March of 2009 through several months of neutral conditions in April, May, and June, to El Niño for the remainder of 2009. El Niño refers to a periodic episode (every 2-7 years) of warming in the tropical Pacific Ocean along the equator from the coast of South America to the central Pacific. Modeling centers around the world that predict El Niño/La Niña agree that waters will continue to warm and result in a weak to moderate El Niño over the next 3-6 months. Although El Niño impacts on Florida's climate are weak during the summer, we may have begun to see some influence. The activity of the hurricane season in the Atlantic Basin is known to be suppressed by El Niño, and this year has been no exception. So far, there have been no named storms through the month of July, and tropical activity has not affected the state. El Niño can also bring slightly drier and warmer weather to the state in July.
Severe weather. Florida experienced only isolated bouts of severe weather in the month of July, mainly damage from wind and small tornadoes. Hail and damaging downbusts were reported near downtown Tallahassee on the afternoon of July 2nd. Small tornadoes (EF0) were reported in Collier County on July 2nd and Orange County on July 15th, and a damaging tornado was reported in Volusia County on July 24th.
Agricultural and other impacts. On July 23rd the U.S. Army Corps of Engineers began making phased releases from Lake Okeechobee to the St. Lucie Inlet and Caloosahatchee River. Lake Okeechobee levels have risen to over 13 feet and the releases were necessary to prevent larger releases later in the summer. Fresh water released into these sensitive estuaries can greatly affect the ecosystems there. Agriculture has had no major disruptions due to weather this month. Timely rainfall has rangeland and pastures generally in good to excellent condition.
Prepared by David F. Zierden and Melissa Griffin
Florida Climate Center
The Florida State University
Tallahassee, FL
Temperatures slightly above normal for May. Most of Florida experienced near-normal to slightly warmer temperatures during the month of May, with most locations averaging 1-2 degrees warmer than normal. No significant cold fronts impacted the State in May, but an unusual May storm brought record low afternoon maximum temperatures to Central and Northeast Florida on May 19th and 20th. Afternoon temperatures struggled to reach 70 across most of Central and North Florida on these days, and many locations set records for lowest maximum temperature. Gainesville was the coldest location, recording maximum temperatures of 61 on May 19th and 66 on May 20th.
| Station | Average Temperature | Departure from Normal |
| Pensacola | 75.8 | 1.2 |
| Tallahassee | 75.5 | 1.1 |
| Jacksonville | 75.2 | 1.8 |
| Orlando | 76.7 | 1.9 |
| Tampa | 78.7 | 1.1 |
| Miami | 80.5 | 0.9 |
| Key West | 80.7 | 0.0 |
Table 1: May average temperatures and departures from normal for selected cities (degrees F.).
This May could end up one of the wettest on record. An unusual May storm system brought widespread heavy rainfall to nearly all areas of the State with the coastal areas of Northeast Florida once again the epicenter. Virtually all locations, with the exception of the Western Panhandle, received at least 2 inches of rain from this system, with most locations seeing significantly more. Volusia and Flagler counties reported storm totals of over 20 inches, measured by CoCoRaHS volunteer observers (25.49 inches at Ormond Beach) and the Flagler County Fairgrounds (23.75 inches). This May now ranks as the wettest on record (since 1923) at Daytona Beach and the second wettest of any month in Daytona with a total of 22.23 inches. The map below shows rainfall amounts for the second half of May from volunteer CoCoRaHS observers. The South Florida Water Management District is unofficially reporting its wettest May on record (75 years) with an area average of 9.04 inches.

Rainfall total for late May from CoCoRaHS observations (volunteer observers).
| Station | Total Rainfall | Departure from Normal |
| Pensacola | 10.72 | 6.32 |
| Tallahassee | 6.55 | 1.60 |
| Jacksonville | 13.51 | 10.03 |
| Orlando | 22.33 | 19.07 |
| Tampa | 9.12 | 6.27 |
| Miami | 7.53 | 2.01 |
| Key West | 3.87 | 0.39 |
Table 2: May precipitation totals and departures from normal for selected cities (inches).
Rare May Storm impacts Florida. While the second half of May usually brings the beginning of Florida's summer rainy season, characterized by frequent afternoon thundershowers, it is also the month that brings the most stable weather patterns to the State. By late spring the jet stream over North America migrates northward, taking with it the support for strong cold fronts or mid-latitude low pressure systems that impact Florida in the winter and spring seasons. May is also too early in the season to support tropical development, so Floridians can usually count on fairly stable weather outside the threat of routine afternoon thundershowers.
On May 17th and 18th a late season cold front moved across North Florida before stalling across Central Florida with its soaking rains. A powerful upper-level and surface low pressure system then formed on this boundary over the southeast Gulf of Mexico. This powerful system was able to tap abundant tropical moisture and brought high winds and soaking rains to Northeast Florida over the next several days. This storm system detached from the primary jet stream shortly after formation, leaving no mechanism to move the system quickly from the area. The storm would be nearly stationary as it pounded the area for several days with high winds and heavy rainfall.
The storm brought unusually powerful winds and surf to Northeast Florida and the Northern Gulf Coast. Persistent easterly winds prompted gale and high surf warnings for the Atlantic Coast and the Northern Gulf of Mexico. Wind-driven waves resulted in tides 2-3 feet above normal and water backing up in the St. Johns River and Intracoastal Waterway, where elevated water levels were exacerbated by heavy storm water runoff. Gusts of 51 mph were measured in Daytona Beach and 60 mph at Ponce Inlet. Over 10,000 homes lost power at some point on May 19th or 20th across Central Florida.
Damage from the system included down power lines across Central Florida, urban flooding in Volusia and Flagler counties, and minor beach erosion. The hardest hit industry was potato farming in Volusia, Putnam, and Flagler counties. Crops were in the middle of the harvest season and many fields were left under water. Crop damage in the three-county area is estimated at $45 million (source: Orlando Sentinel)
Drought Impacts. The unusual May storm system was not without benefits, however. Prior to the storm, South Florida had experienced one of its driest 'dry seasons' on record (Nov. 1 - April 30). The South Florida Water Management district reported the driest 6-month period since they began keeping records in 1932. The recent rains have eased short-term drought conditions there and Lake Okeechobee is on the rise again at a level of 11.36 ft. West-Central Florida was also gripped in drought and has enacted some of the tightest water restrictions in recent memory. Flows on the Hillsborough and Alafia rivers, which help supply Tampa and St. Petersburg's drinking water, are now on the rise after experiencing record low flows for this time of year. Fire danger, which had been extremely high across Central and South Florida with Keetch-Byram Drought Index values from 600 to over 700 (corresponding to extreme dryness), is now greatly diminished. Current KBDI values have dropped to 300 or less across South Florida and soils are completely saturated across North and Central Florida. The widespread rainfall has sufficiently moistened soils and greened up vegetation, and combined with the onset of Florida's summer rainy season, effectively ends the active wildfire season.
Prepared by David F. Zierden and Melissa Griffin
Florida Climate Center
The Florida State University
Tallahassee, FL
Temperatures near normal for April. Most of Florida experience near-normal temperatures during the month of April, with the exception of South Florida and West-Central Florida, which were 1-2 degrees warmer than normal. Only one significant cold front impacted the state, bring much colder than normal temperatures during the five day stretch of April 5th through the 10th from North Florida and the Panhandle all the way down to extreme South Florida. The coldest temperatures were recorded early morning on April 8th with weather stations at Cross City, Perry, and Tallahassee recording the low temperature of 31 degrees. From April 11th through the remainder of the month, daily temperatures generally ranged from near normal to slightly above normal as high pressure and southerly winds dominated our weather patterns.
| Station | Average Temperature | Departure from Normal |
| Pensacola | 66.1 | 0.0 |
| Tallahassee | 67.1 | 0.7 |
| Jacksonville | 66.6 | 0.0 |
| Orlando | 71.5 | 0.0 |
| Tampa | 73.8 | 2.2 |
| Miami | 77.0 | 1.3 |
| Key West | 76.9 | -0.1 |
Table 1: April average temperatures and departures from normal for selected cities (degrees F.).
Unusually active weather pattern brings frequent torrential rains to North Florida. The last week of March and first week of April brought a shift in the large-scale weather patterns across the Southeast U.S., characterized by an active pattern with frequent low pressure systems moving across the northern Gulf Coast. Several of these systems were slow-moving, allowing soaking rains and thunderstorms to dump heavy accumulations of rain over the two-week period across most of Georgia, Alabama, and North Florida. A large swath of the Florida Panhandle, South Alabama, and South Georgia received over 12 inches during the last week of March and the first week of April with a greater area seeing 6-8 inches. The widespread nature of the heavy rainfall resulted in flooding of low-lying or poorly-drained areas and record or near-record floods on some Georgia and North Florida Rivers.
Rainfall total for late March/early April from CoCoRaHS observations (volunteer observers).
The State was hit by one final rain system on April 13th-14th that dumped another 2-4 inches across the Panhandle, but amounts generally one inch or less from Jacksonville down through the Tampa area.
Unfortunately, these torrential rains failed to progress down the peninsula where the driest areas of the State are located. South of a diagonal line from Gainesville to St. Augustine, the peninsula received only 1-2 inches during the month of April and continued the string of months with below-normal rainfall. The South Florida Water Management District reports the driest 6-month period on record (since 1932) for their management area from November through April.
| Station | Total Rainfall | Departure from Normal |
| Pensacola * | 1.73 | -3.33 |
| Tallahassee | 10.18 | 6.59 |
| Jacksonville | 5.90 | 2.76 |
| Orlando | 1.06 | -1.36 |
| Tampa | 1.22 | -0.58 |
| Miami | 1.17 | -2.19 |
| Key West | 0.70 | -1.36 |
Table 2: April precipitation totals and departures from normal for selected cities (inches).
* Pensacola totals are low because the rain event on April 1st missed the near coastal area (where the rain gauge is located) while dumping 6-8 inches just a few miles inland.Pacific Ocean impacts on the climate. La Niña, a condition of colder than normal sea surface temperatures in the equatorial Pacific Ocean, began to break up in the month of March and has since dissipated. La Niña is known to bring warm and dry winters to Florida and the Southeast. Ocean temperatures have warmed to near-normal in the past month near the Pacific equator and the atmosphere over the region is now behaving like neutral conditions. A return to Neutral conditions in the Pacific Ocean means that the remainder of spring and early summer will have no predisposition towards either wetter, drier, warmer, or colder than normal climate patterns.
Major flooding on north Florida rivers. The progression of weather systems in late March/early April producing heavy rainfall across north Florida, Alabama, and Georgia resulted in major flooding in low-lying areas and record or near record heights on area rivers. Below are some of the recorded river crests from the NWS Southeast River Forecast Center:
Pinetta Florida on the Withlacoochee River - Record Flood
- Pinetta crested at a new record of 88.51 feet on April 6. The old record was 85.05 on April 5th 1948.
Ellaville Florida on the Suwannee River - Major Flood
- Ellaville crested at a level of 63.8 feet on April 10th. Florida Department of Transportation was forced to close U.S. highways 84 and 90 and Interstate 10 was also threatened.
Havana Florida on the Ochlockonee River - Major Flood
- Havanna crested at 33.45 feet, a major flood, and just under the 2nd highest flood on record. The 2nd highest flood on record was 33.71 feet.
Altha Florida on the Chipola River - Major Flood
- Altha crested at 30.66 feet with the 4th highest level on record.
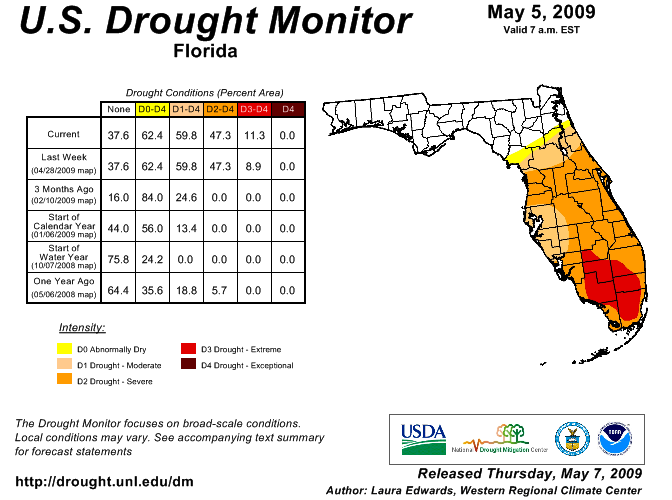
Drought impacts. As stated above, the heavy rains of late March/early April failed to penetrate down the peninsula south of Gainesville. With winter rainfall deficits from 5 to 10 inches, drought continues to worsen across central and south Florida. According to the U. S. Drought Monitor, most of the peninsula is now classified as being in moderate or severe drought, with interior Southwest Florida as extreme. Fortunately, Lake Okeechobee levels are higher this year (due to tropical storm Faye) heading into the critical spring period than they were during the last drought years of 2007 and 2008. The big lake is a critical resource for municipal and agricultural water supply in south Florida.
The Southwest Florida Water Management district has restricted watering of lawns to once per week across the entire district with stricter restriction in Pinellas, Pasco, and Hillsborough counties. Tampa Bay Water (serving 6 municipalities in the area) has exhausted the Bill Young reservoir and is not withdrawing from the Hillsborough or Alafia rivers due to record low flows. The South Florida Water Management District is proposing year-round watering restriction to help mitigate recurring water shortages.
Impacts on agriculture and forestry. The heavy rains across north Florida have delayed field work for row crops such as corn and peanuts. Fields prepared for planting were flooded and some reported soil erosion. The pasture condition was limited by cold and flooding in the Panhandle and northern counties and by drought in the central and southwest counties.
The dry weather superimposed on the peninsula's typical dry winter season has forests and fuels dangerously dry for wildfire potential. The Florida Division of Forestry reports that portions of central and south Florida have Keetch-Byram Drought Index (KBDI) values over 700 corresponding to a severe threat. Persistent brush fires in Southwest Florida have resulted in the nightly closing of I-75 due to reduced visibilities.
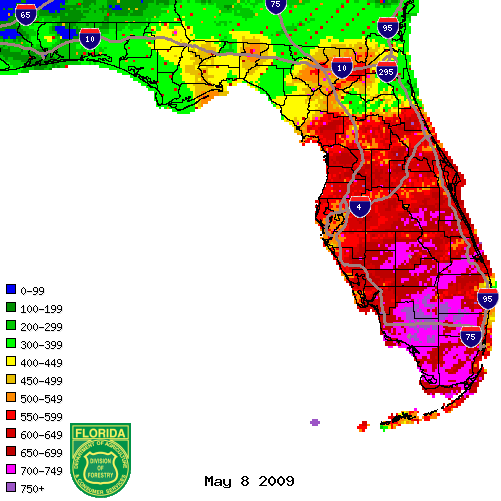
Figure 1: KBDI values from radar-derived precipitation estimates (Courtesy of FL DOF).
Building A, Suite 292
Tallahassee, FL 32306-2741
Phone: (850) 644-3417 | (850) 644-0719
climate@coaps.fsu.edu