


The Florida Climate Center serves as the primary resource for climate data, information, and services in the state of Florida.

The Florida Climate Center achieves its mission by providing climate monitoring, research, and expertise to be applied by the people, institutions, and businesses of Florida and the surrounding region.
We provide direct service by fulfilling requests for climate and weather data and information in a variety of formats.
We perform research that advances the understanding of the climate variability and changes of Florida and the surrounding region.
We provide outreach in presentations and at events aimed at a variety of groups, interests, and ages.
Prepared by Preston Leftwich, David F. Zierden, and Melissa Griffin
Florida Climate Center
The Florida State University
Tallahassee, FL

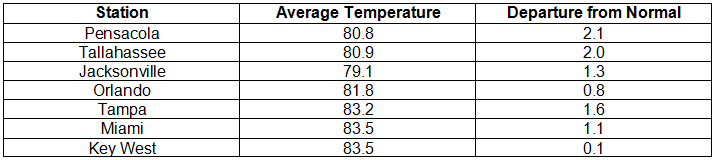
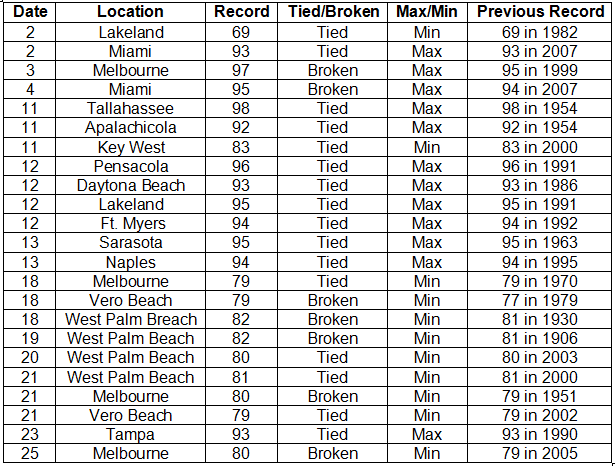
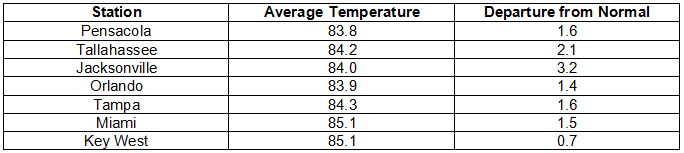
Average temperatures above normal for September. Persistent subtropical high pressure during the first three weeks of the month led to average temperatures remaining above normal for September (Table 1). The monthly mean of 84.1° F at West Palm Beach broke the record of 83.3° F recorded in 1951. Several maximum temperature records were tied or broken (Appendix). On the 11th, Apalachicola (92° F) and Tallahassee (98° F) tied daily maximum records in existence since 1954. For four consecutive days, the 18th through the 21st, West Palm Beach tied or broke daily records for highest minimum temperature, with 82o F on the 18th breaking a record in existence since 1930. The minimum temperature (80° F) at Melbourne on the 21st broke a record in existence since 1951.
Table 1: September average temperatures and departures from normal (° F) for selected cities.
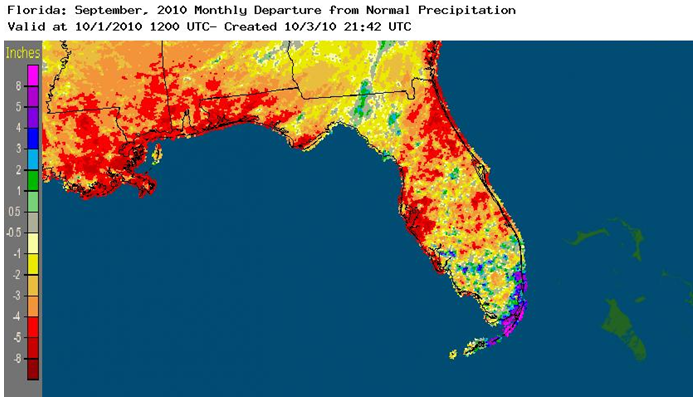
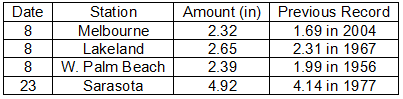
September rainfall totals vary around the state. Monthly rainfall in September was below normal in most areas except the south. Pensacola (0.62 in) and Tampa (1.13 in) were more than five inches below normal (Table 2). In contrast, Miami (15.89 in) was more than seven inches above normal. Localized heavy rain produced isolated record daily amounts (Table 3). Figure 1 provides an aerial depiction of both the well-below normal rainfall in northwest and north-central areas and the well-above normal rainfall in the extreme southeast.
Table 2: September precipitation totals and departures from normal (inches) for selected cities.
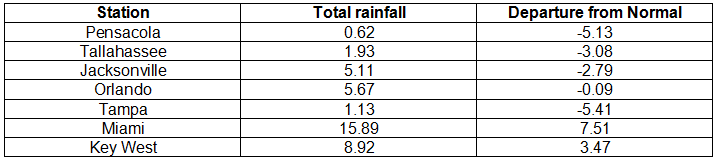
Table 3: Daily maximum rainfall records set in September
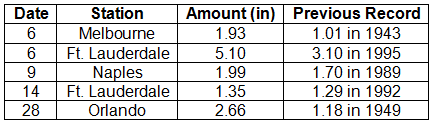
Figure 1: A graphical depiction of the monthly rainfall departure from normal (inches) for September is given in the figure below (courtesy of NOAA, NWS).
La Nina continues to strengthen during September. Sea surface temperatures in the equatorial Pacific Ocean continued below normal during September, clearly denoting a cold phase of ENSO, or La Nina. Increased tropical cyclone activity in the Atlantic basin, as seen during September, is associated with La Nina conditions. Also, the warm, dry conditions across most of the state are also associated with La Nina.
Hazardous weather. No tornadoes were observed during September. Thunderstorm winds produced only isolated damage in northern and central areas. On the 5th, thunderstorms produced wind gusts up to 69 mph near Cape Canaveral. As the remnants of Tropical Storm Nicole passed near southeastern coastal areas on the 29th, heavy rain was observed from Miami to Marathon.
Agricultural and other impacts. Dry conditions in western areas of the Panhandle have hindered peanut digging, stressed cotton and soybeans, and lowered hay yields. By the end of the month, areas in the western Panhandle along the border with Alabama reached severe drought conditions. Other areas in the northwest and along the northeast Atlantic coast have moderate drought conditions. Most northern areas have become abnormally dry. In contrast, growing conditions remained good in citrus areas throughout the month.
Appendix: Temperature Records (° F) Tied or Broken during September (compiled from NWS).
Prepared by Preston Leftwich, David F. Zierden, and Melissa Griffin
Florida Climate Center
The Florida State University
Tallahassee, FL
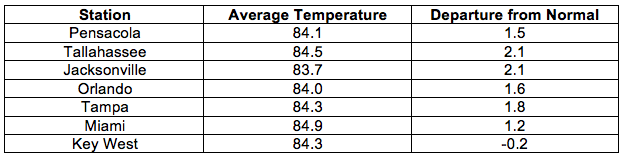
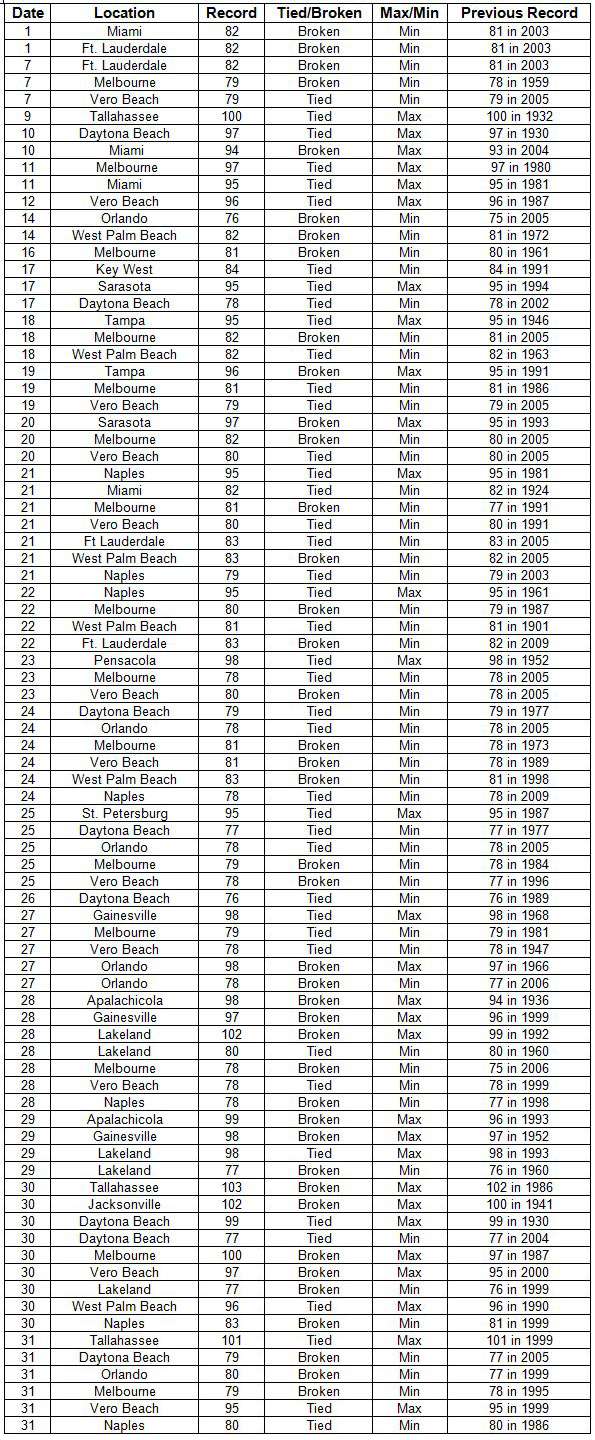
Average temperatures above normal for August. Continued high pressure at both the surface and aloft, high moisture in low levels, and above normal sea-surface temperatures led to above normal temperatures across all areas of the state (Table 1). The monthly mean temperature at Vero Beach (83.6°) was the warmest on record. Tallahassee (84.2o F) and Melbourne (83.8° F) tied the second warmest August on record. Nine daily maximum temperature records were tied or broken. The maximum temperature at Orlando (97° F) on the 1st tied a record in existence since 1961. Also, the maximum temperature at Miami (95° F) on the 24th broke a record in existence since 1958. In contrast, the maximum temperature of 82o F at Key West on the 10th broke the record (83° F in 1901) for lowest maximum temperature in August. There were 37 daily temperature records tied or broken during the month. Much of the persistent overall warmth during August resulted from above normal minimum temperatures. Daytona Beach (76.1° F) and Melbourne (76.5° F) had record-warm monthly mean minimum temperatures.
Table 1: August average temperatures and departures from normal (° F) for selected cities.
August rainfall totals vary around the state. Monthly rainfall in August was above normal in most areas around the state. Pensacola (11.87 in) was more than five inches above normal (Table 2). In contrast, Vero Beach (2.89 in) was more than three inches below normal. Localized heavy rain produced isolated record daily amounts (Table 3).
Table 2: August precipitation totals and departures from normal (inches) for selected cities.
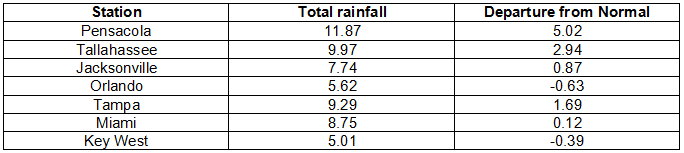
Table 3: Daily maximum rainfall records set in August
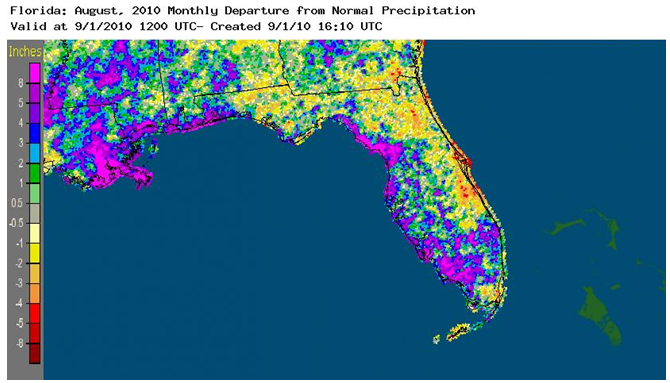
Further, the overall areal distribution of departures from normal rainfall during August is depicted in Figure 1. Departures from normal monthly totals range from much above normal in several areas near the Gulf coast and inland sections of the south to well below normal along the central east coast. A monthly total exceeding 20 inches was observed in coastal Levy County.
Figure 1: A graphical depiction of the monthly rainfall departure from normal (inches) for August is given in the figure below (courtesy of NOAA, NWS).
La Niña strengthens during August. Sea surface temperatures in the equatorial Pacific Ocean continued to cool during August and now clearly denote a cold phase of ENSO, or La Niña. The development of La Niña has little impact on climate in Florida during summer.
Hazardous weather. Thunderstorm winds produced only isolated reports of minor damage during August. Weak tornadoes caused minor damage near New Smyrna Beach and Boca Raton on the 7th and again at New Smyrna Beach on the 11th. Waterspouts caused minor damage when they moved ashore near Edgewater on the 11th and near Key Largo on the 30th. Tropical Depression 5 formed in the southeast Gulf of Mexico on the 10th. Rainfall along the Gulf coast was enhanced for the next two days as the depression drifted northwestward before dissipating.
Agricultural and other impacts. Hot, dry conditions early in the month stressed some field crops and pasture in the extreme northwest. Rainfall later in the month improved the condition of field crops in the northwest and forage in west-central areas. However, continued heavy rain in some areas of the northwest promoted white mold in some peanut fields toward the end of the month. Warm, humid conditions throughout the month provided excellent growing conditions for citrus and sugarcane in the south. Abnormally dry conditions persisted through the month near the borders with Alabama and southwest Georgia and along the east-central and northeast Atlantic coasts.
Appendix: Temperature Records (° F) Tied or Broken during August (compiled from NWS).
Prepared by Preston Leftwich, David F. Zierden, and Melissa Griffin
Florida Climate Center
The Florida State University
Tallahassee, FL
Average temperatures mostly above normal for July. Continued high pressure at both the surface and aloft led to widespread record-warm temperatures during July. Monthly average temperatures for July were above normal across all areas of the state except the Keys (Table 1).
Table 1: July average temperatures and departures from normal (° F) for selected cities.
There were 30 daily maximum records tied or broken at primary reporting stations during the month. Six of these records were temperatures of 100° F or higher. The maximum temperature at Lakeland on the 28th was the highest temperature recorded there during July. The extent of the warmth was evident again in July as more than 50 record high daily minimum temperatures occurred across central and southern parts of the state throughout the month. Temperatures of 83° F at West Palm Beach (21st and 24th) and Naples (30th) were record high minima for the month of July.
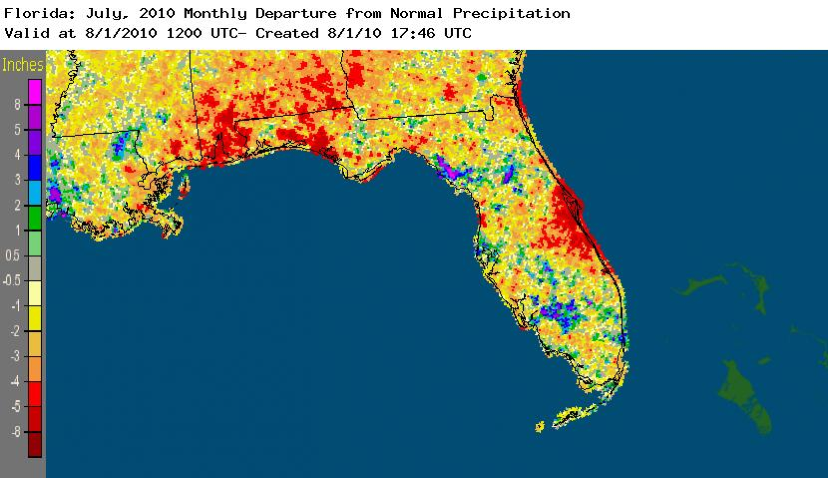
July rainfall below normal in most areas. Monthly rainfall in July was below normal in most areas around the state, except in the extreme southeast and the Keys. Pensacola (3.70 in) was more than four inches below normal (Table 2). However, localized heavy rain produced record daily amounts (Table 3). In particular, daily totals of 2.51" at Fort Lauderdale on the 4th and 4.03" at Apalachicola on the 5th broke records in existence since 1922 and 1940, respectively. The overall distribution of July rainfall departures from normal is depicted in Figure 1. Note that some areas in the Panhandle and east-central Florida experienced well below normal amounts of rainfall.
Table 2: July precipitation totals and departures from normal (inches) for selected cities.
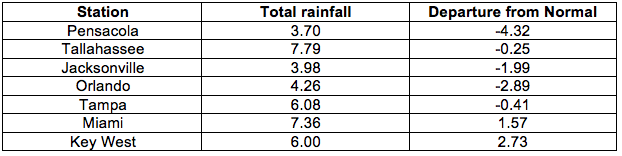
Table 3: Daily maximum rainfall records set in July
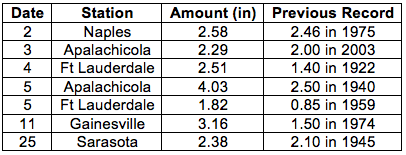
Figure 1: A graphical depiction of the monthly rainfall departure from normal (inches) for July is given in the figure below (courtesy of NOAA, NWS).
La Niña begins during July. Sea surface temperatures in the equatorial Pacific Ocean continued to cool during July and now denote a cold phase of ENSO, or La Niña. The development of La Niña has little impact on climate in Florida during summer.
Hazardous weather. Thunderstorm winds downed trees and/or power lines in several northern and central locations on the 15th. Also on the 15th, a building was damaged near Melbourne, and, as a line of thunderstorms moved off the southeast coast, wind gusts of 66 mph and 70 mph were recorded at Key Biscayne and Fowey Rocks. Minimal Tropical Storm Bonnie made landfall just south of Miami on the 23rd with maximum sustained winds around 40 mph. A gust of 52 mph was recorded along the coast at Fowey Rocks. Also on the 23rd, a weak tornado blew trees onto a house in Pensacola and thunderstorm winds caused roof damage at Crestview. On the 28th, 1" hail and 67 mph wind gusts were observed near Tampa.
Agricultural and other impacts. Beneficial rain for crops occurred early in the month in the Panhandle and southern portions of the state. On the other hand, these rains encouraged rapid weed growth in northwestern areas. Persistent hot temperatures produced heat stress on field crops and pastures without irrigation. By late in the month, some areas along the eastern coast reached mild drought conditions.
Appendix: Temperature Records (° F) Tied or Broken during July (compiled from NWS).
Prepared by Preston Leftwich, David F. Zierden, and Melissa Griffin
Florida Climate Center
The Florida State University
Tallahassee, FL
Average temperatures well above normal for June. Persistent high pressure at both the surface and aloft during June resulted in widespread record-warm temperatures. Monthly average temperatures for June were well above normal across the entire state (Table 1). The monthly average temperature at Miami (85.5° F) was a record for any calendar month. The monthly average temperature at Key West (85.9° F) broke a record in existence since 1886. Average monthly temperature records were also set at Jacksonville, Fort Lauderdale, Naples, Lakeland, and St. Petersburg. This was the second warmest June on record at Tallahassee and West Palm Beach. More than 25 daily maximum records were tied or broken during the month. In particular, a maximum of 92° F at Key West on the 7th tied a record in existence since 1956. Maxima of 100° F on the 12th and 101° F on the 13th tied daily records at Tallahassee. On the 15th, a maximum of 102° F tied the daily record at Jacksonville. Also on the 15th, the maximum of 99° F at Gainesville tied a daily record last observed in 1909. The extent of the warmth was notably evident in many record high minimum temperatures across central and southern parts of the state throughout the month.
Table 1: June average temperatures and departures from normal (° F) for selected cities.
| Station | Average Temperature | Departure from Normal |
| Pensacola | 82.4 | 1.8 |
| Tallahassee | 83.8 | 3.4 |
| Jacksonville | 82.8 | 3.7 |
| Orlando | 83.4 | 2.2 |
| Tampa | 84.8 | 3.3 |
| Miami | 85.5 | 3.1 |
| Key West | 85.9 | 2.5 |
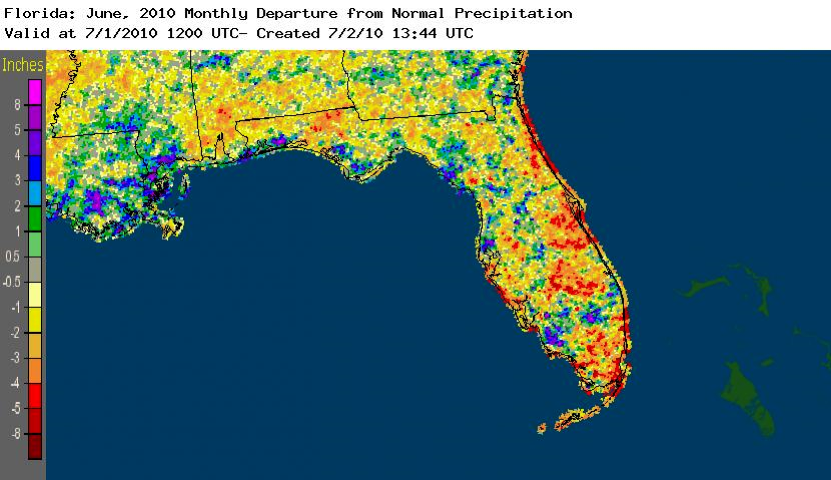
June rainfall below normal in most areas. Monthly rainfall in June was below normal in most areas around the state. Orlando (3.23 in) was more than four inches below normal (Table 2). However, localized heavy rain, which is typical of summer, produced above normal monthly totals in scattered areas of the state (Figure 1). There were no daily rainfall records observed during June.
Table 2: June precipitation totals and departures from normal (inches) for selected cities.
| Station | Total Rainfall | Departure from Normal |
| Pensacola | 7.55 | 1.16 |
| Tallahassee | 7.99 | 1.07 |
| Jacksonville | 3.73 | -1.64 |
| Orlando | 3.23 | -4.12 |
| Tampa | 4.63 | -0.87 |
| Miami | 7.20 | -1.34 |
| Key West | 2.08 | -2.49 |
Figure 1. A graphical depiction of the monthly rainfall departure from normal (inches) for June is given in the figure below (courtesy of NOAA, NWS).
ENSO reaches neutral phase. Sea surface temperatures in the equatorial Pacific Ocean continued to cool during June and now indicate a neutral phase of ENSO. Continued above normal temperatures and below normal rainfall observed in most areas during June are consistent with conditions expected in Florida as an El Niño episode ends.
Hazardous weather. On the 20th a weak tornado caused damage to the roof of a house at Cape Coral. Throughout the month thunderstorm winds downed trees and power lines power lines in isolated areas. On the 18th, trees fell on two houses near Lake City. One person was injured on the 20th when a tree was blown onto a mobile home near Goldenrod. Thunderstorm wind gusts reached 64 mph at Apalachicola and 74 mph at Miami Beach on the 4th. Later in the month, thunderstorms produced wind gusts up to 60 mph at Jacksonville Naval Air Station on the 16th, 64 mph at Wright on the 18th, and 70 mph at McDill Air Force Base on the 21st. There were only isolated reports of large hail. The largest observed hailstones were 1.25 inches in diameter at Azalea Beach on the 2nd and at Kendall on the 3rd.
Agricultural and other impacts. Early in the month heavy rains in northern areas slowed peanut planting. However, these heavy rains lessened the need for irrigation later. By mid-June there were nearly ideal growing conditions for corn, cotton, tobacco and peanuts. Also, the return of hot temperatures and higher humidity produced good growing conditions for citrus in central and southern areas. Sugarcane, corn and rice in southwestern parts of the state benefitted from frequent summer showers. As rainfall lessened toward the end of the month, parts of the Panhandle and northern peninsula reached minimal drought conditions. There was some crop damage from sunscald reported in north-central areas.
Prepared by Preston Leftwich, David F. Zierden, and Melissa Griffin
Florida Climate Center
The Florida State University
Tallahassee, FL
Average temperatures above normal for May. Monthly average temperatures for May were above normal across the entire state (Table 1). Daily maximum temperature records tied or set during May are in Table 2. The maximum temperature at Sarasota on the 2nd (92° F) broke a record in existence since 1943. The maximum temperature at Apalachicola on the 17th (94° F) tied a record previously set in 1950.
Table 1: May average temperatures and departures from normal (° F) for selected cities.
| Station | Average Temperature | Departure from Normal |
| Pensacola | 76.4 | 1.7 |
| Tallahassee | 77.9 | 3.5 |
| Jacksonville | 77.2 | 3.8 |
| Orlando | 79.1 | 1.9 |
| Tampa | 80.9 | 3.3 |
| Miami | 82.4 | 2.8 |
| Key West | 82.1 | 1.4 |
Table 2: Maximum temperature (° F) records tied or broken during May (compiled from NWS).
| Date | Station | Temperature | Previous Record |
| 2 | Sarasota | 92 | 91 in 1943 |
| 6 | Miami | 93 | 92 in 1955 |
| 8 | Miami | 93 | 92 in 1998 |
| 9 | Miami | 94 | 93 in 1967 |
| 17 | Apalachicola | 88 | ties 1991 |
| 21 | Naples | 93 | ties 2004 |
| 21 | St Petersburg | 94 | 92 in 1977 |
| 27 | Apalachicola | 94 | ties 1950 |
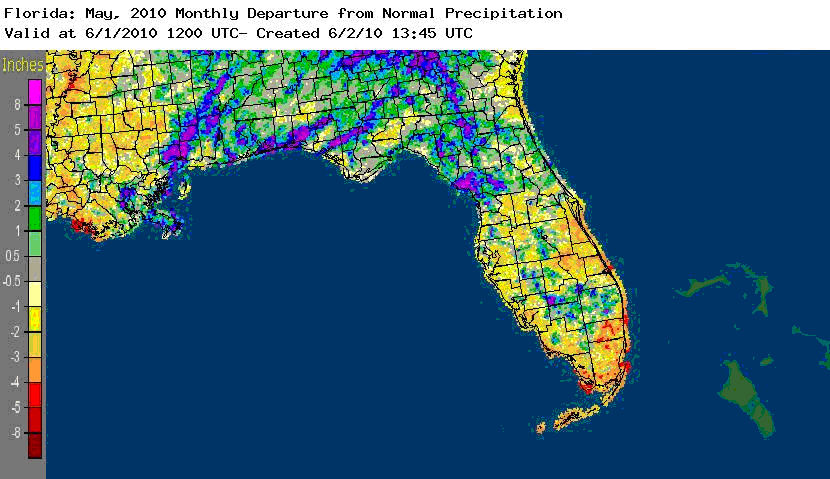
May rainfall below normal in most areas. Rainfall totals for May were below normal at most stations (Table 3). An exception is Pensacola where the monthly total of 7.98 inches was more than three and one half inches above normal. Daily rainfall records set during May are in Table 4. In particular, the daily amount of 2.69 inches at Pensacola on the 16th exceeded a record in existence since 1945. Further, Figure 1 depicts bands of above-normal monthly rainfall in northwestern and northern parts of the state. Areas of well-below normal monthly rainfall are evident in southern areas.
Table 3: May precipitation totals and departures from normal (inches) for selected cities.
| Station | Total Rainfall | Departure from Normal |
| Pensacola | 7.98 | 3.58 |
| Tallahassee | 2.95 | -2.00 |
| Jacksonville | 1.65 | -1.83 |
| Orlando | 3.00 | -0.74 |
| Tampa | 1.84 | -1.01 |
| Miami | 3.42 | -2.10 |
| Key West | 0.49 | -2.99 |
Table 4: Daily rainfall records (inches) set during May (compiled from NWS).
| Date | Station | Amount | Previous Record |
| 4 | Apalachicola | 2.52 | 0.88 in 1968 |
| 5 | Vero Beach | 2.11 | 1.69 in 1968 |
| 16 | Pensacola | 2.69 | 2.48 in 1945 |
| 17 | Daytona Beach | 1.59 | 0.65 in 1976 |
Figure 1. A graphical depiction of the monthly rainfall departure from normal (inches) for May is given in the figure below (courtesy of NOAA, NWS).
ENSO reaches neutral phase. Sea surface temperatures in the equatorial Pacific Ocean have cooled to be only 0.2° C above normal, designating a neutral phase of ENSO. Above normal temperatures and below normal rainfall observed in most areas are consistent with conditions expected in Florida as an El Niño episode ends.
Hazardous weather. . No tornadoes were observed in Florida during May. Thunderstorms caused minor wind damage and downed power lines and trees in isolated locations throughout the month. One-inch diameter hail was observed near Gainesville on the 21st, near Suwannee Valley on the 22nd, near Asbury Park on the 24th, and near Mossy Head on the 29th. Hail up to the size of golf balls (1.75 inch diameter) was observed in Tallahassee on the 28th.
Agricultural and other impacts. Early in the month, heavy rains delayed fieldwork and flooded pastures in the Panhandle. By mid-month, drier, warmer conditions allowed 90% of the northern pasture to return to fair or good conditions. Scattered rains maintained soil moisture and aided emergence of newly planted peanuts and cotton in the Panhandle and northern Peninsula. Growing conditions were good in citrus areas. A delayed watermelon harvest due to very cold weather during winter and early spring led to an overabundant supply during May.
Building A, Suite 292
Tallahassee, FL 32306-2741
Phone: (850) 644-3417 | (850) 644-0719
climate@coaps.fsu.edu