


The Florida Climate Center serves as the primary resource for climate data, information, and services in the state of Florida.

The Florida Climate Center achieves its mission by providing climate monitoring, research, and expertise to be applied by the people, institutions, and businesses of Florida and the surrounding region.
We provide direct service by fulfilling requests for climate and weather data and information in a variety of formats.
We perform research that advances the understanding of the climate variability and changes of Florida and the surrounding region.
We provide outreach in presentations and at events aimed at a variety of groups, interests, and ages.
Prepared by Preston Leftwich, David F. Zierden, and Melissa Griffin
Florida Climate Center
The Florida State University
Tallahassee, FL

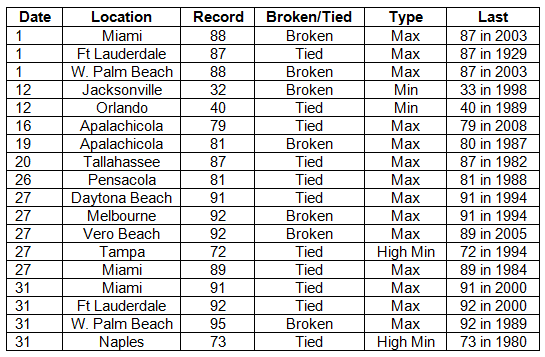
Average temperatures above normal in March. Average temperatures were above normal throughout the state in March (Table 1). At least 14 daily maximum temperature records were tied or broken (Table 2). The maximum of 87° F at Ft. Lauderdale on the 1st tied a record in existence since 1929. On the 31st, the maximum temperature reached 95° F at West Palm Beach. The minimum temperature at Jacksonville on the 12th reached 32° F, setting a record for the date.
Table 1: March average temperatures and departures from normal (° F) for selected cities.
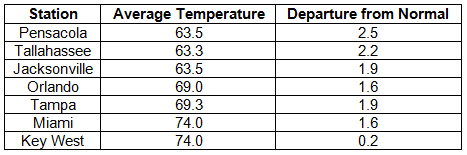
Table 2: Daily temperature records (° F) tied or broken during March. (Compiled from NOAA, NWS).
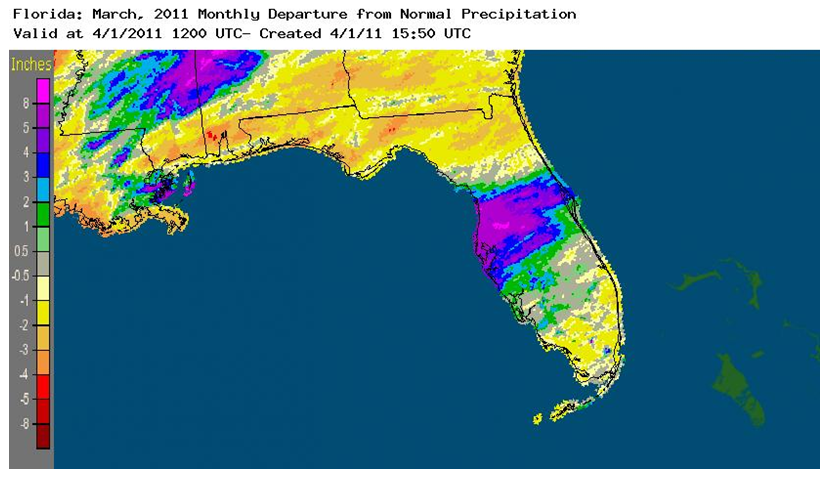
Rainfall totals below normal in the north and south, but above normal in central areas. Rainfall totals for March varied across the state. Below normal totals were observed in the north and south, while above normal totals were observed in central areas (Table 3). Tallahassee recorded a total more than three inches below normal. The monthly total at Tampa (9.79 in) was nearly seven inches above normal. At Tampa, 8.19 inches fell during the last four days of the month. Several daily records were set (Table 4). A total of 3.12 inches on the 31st at St. Petersburg broke a daily record in existence since 1931. Figure 1 graphically depicts the departure from normal of March rainfall totals across the state.
Table 3: March precipitation totals and departures from normal (inches) for selected cities.
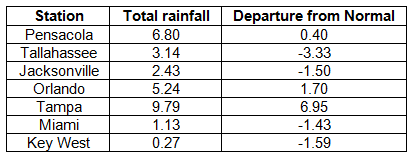
Table 4: Daily rainfall records (inches) tied or broken during March. (Compiled from NOAA, NWS).
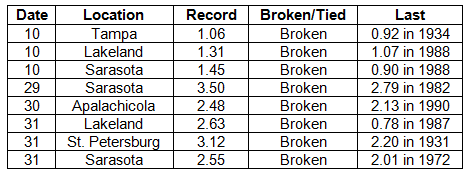
Figure 1: A graphical depiction of the monthly rainfall departure from normal (inches) for March is given in the figure below (courtesy of NOAA, NWS).
La Niña continues during March. Although sea surface temperatures in the equatorial Pacific Ocean warmed slightly during March, they continued below normal, denoting a weak cold phase of ENSO, or La Niña. As the impact of cold temperatures in the Arctic lessened, weather conditions returned to those expected during a La Niña Spring.
Hazardous weather. March was a very active month for severe weather in the state. Most of the events were concentrated on the last two days of the month. On the 10th, weak tornadoes touched down briefly near Ft. Lauderdale and Miami, causing minor damage. Additionally, wind gusts of 70 mph were observed near Ft. Lauderdale. On the 30th, thunderstorm winds caused widespread damage across north-central and central areas. A tornado was observed near Lake Panasoffkee and two-inch-diameter hail was observed at Malamar. Wind gusts up to 88mph on the Sunshine Skyway, 85 mph at the Kennedy Space Center, 74 mph near Azalea Park and 73 mph at Winter Haven were observed. One injury occurred when a tree was blown onto a house at Orange City. Strong winds caused moderate to severe damage to 11 homes at Winter Springs. The month ended with many severe storm events in west-central areas on the 31st. Tornadoes occurred at Indian Rocks Beach, Bartow, Mulberry, and near Lutz and Kathleen. There were numerous reports of downed trees and power lines and damage to structures. Near Lakeland, seven people were injured and 50 light aircraft were damaged or destroyed by 70-75 mph thunderstorm winds and a brief tornado at Lakeland Airport during an ongoing air show.
Agricultural and other impacts. Cold temperatures early in the month slowed growth of pasture. Later in the month warm windy conditions dried out soil and pasture. However, growth of natural grasses was aided by warming temperatures during the month. Although field preparation progressed, planting of some vegetables was delayed due to dry soil. By the end of the month severe to extreme drought conditions existed in southern areas and along the upper east coast. On March 26 a water shortage was declared in south Florida and water use restrictions were implemented.
Prepared by Preston Leftwich, David F. Zierden, and Melissa Griffin
Florida Climate Center
The Florida State University
Tallahassee, FL
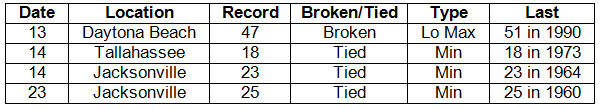
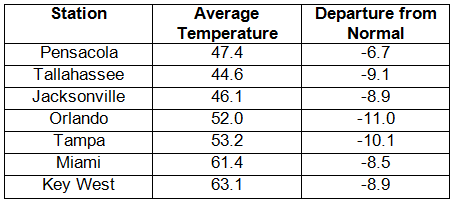
Average temperatures much below normal in January. Mean temperatures were again below normal in all areas during January (Table 1). The monthly mean temperature at Tallahassee was more than five degrees F below normal. On the 14th Tallahassee (18° F) and Jacksonville (23° F) tied daily minimum records (Table 2). Jacksonville again tied a daily minimum record (25° F) on the 23rd.
Table 1: January average temperatures and departures from normal (° F) for selected cities.
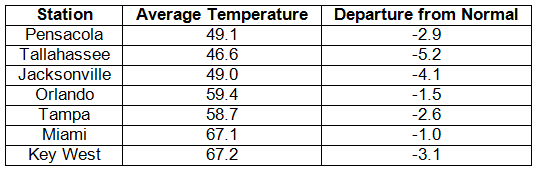
Table 2: Daily temperature records (° F) tied or broken during January. (Compiled from NOAA, NWS).
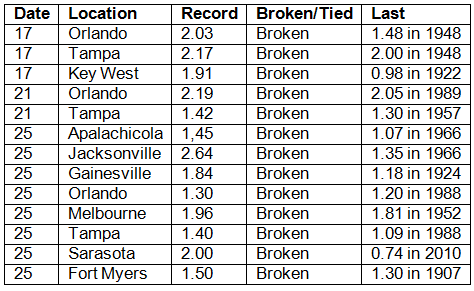
Rainfall totals vary during January. Rainfall totals for January were below normal in the northwest, above normal in central areas, and near to below normal in the south (Table 3). Monthly totals at Tampa (6.28 in) and Orlando (5.92 in) were well above normal. Along the southeast coast, monthly rainfall at West Palm Beach and Ft. Lauderdale were below normal. An areal perspective is given by Figure 1. There were at least 13 daily rainfall records set during January (Table 4). A daily rainfall of 1.91 inches at Key West on the 17th broke a record in existence since 1922. On the 25th rainfall of 1.96 inches at Gainesville and 1.50 inches at Fort Myers broke records in existence since 1924 and 1907, respectively. Orlando set three daily records during a nine-day period (17th - 25th).
Table 3: January precipitation totals and departures from normal (inches) for selected cities.
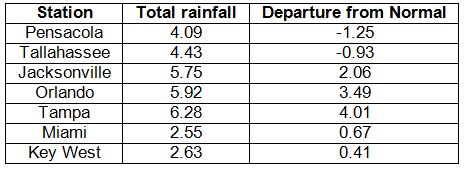
Figure 1: A graphical depiction of the monthly rainfall departure from normal (inches) for January is given in the figure below (courtesy of NOAA, NWS).
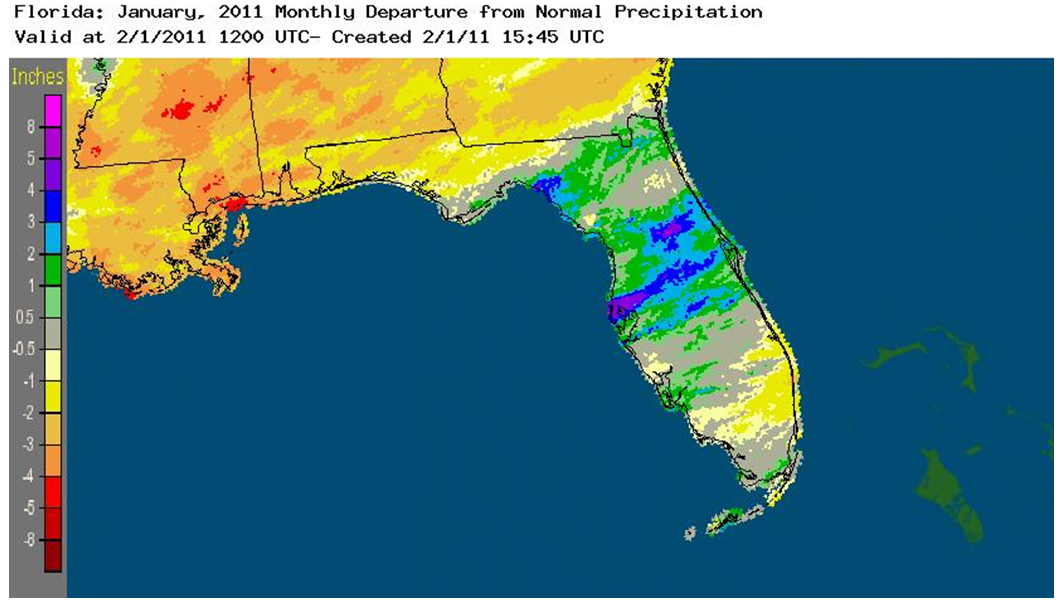
Table 4: Daily rainfall records (inches) tied or broken during January. (Compiled from NOAA, NWS).
La Niña continues during January. Sea surface temperatures in the equatorial Pacific Ocean were below normal during January, denoting a continued cold phase of ENSO, or La Niña. Above normal rainfall observed during January in the central peninsula and below normal mean temperatures observed statewide were not characteristic of winter during La Niña events. These observed conditions reflect the continued dominance of the North Atlantic Oscillation (NAO) and the Arctic Oscillation (AO) this winter.
Hazardous weather. Sleet was reported at Crawfordville and Tallahassee on the 9th. There were seven confirmed tornadoes during January. On the 17th a brief tornado occurred near Port St. John. Also, thunderstorm winds blew cars off the road near Bradenton and power lines were downed near Marathon and Key West. The 25th was an active severe storm day. Tornadoes were observed near Zolfo Springs, Ona, Alva, Boca Raton, Spring Lake, and Myakka Head. Six mobile homes were damaged or destroyed by the tornado near Alva. Otherwise, these tornadoes caused minor damage. Numerous strong thunderstorm winds were observed in central and southern areas on the 25th. One person was injured in St. Petersburg when strong winds toppled a service station canopy onto a car. Thunderstorm winds gusted to 63 mph at Sanford, 64 mph near Parkland, and 67 mph at Fowey Rocks.
Agricultural and other impacts. Continued cold and dryness produced the greatest impacts on agriculture during January. Freezing temperatures in northern and western citrus areas caused some damage to fruit. Sugarcane suffered some damage and its growth halted during cold spells. Sprinklers were used to avoid great damage to strawberries. As farmers quickly harvested crops after freezing temperatures, the State lifted weight restrictions for trucks hauling agricultural products. Overall, shipments of vegetables were below normal. Rain during the second half of the month somewhat raised the levels of wells in the south. However, many were still in the lowest 10% of normal. Long-term drought conditions persisted for all areas of the state during January. Extreme drought conditions remained in the northeast and along eastern coastal areas.
Prepared by Preston Leftwich, David F. Zierden, and Melissa Griffin
Florida Climate Center
The Florida State University
Tallahassee, FL
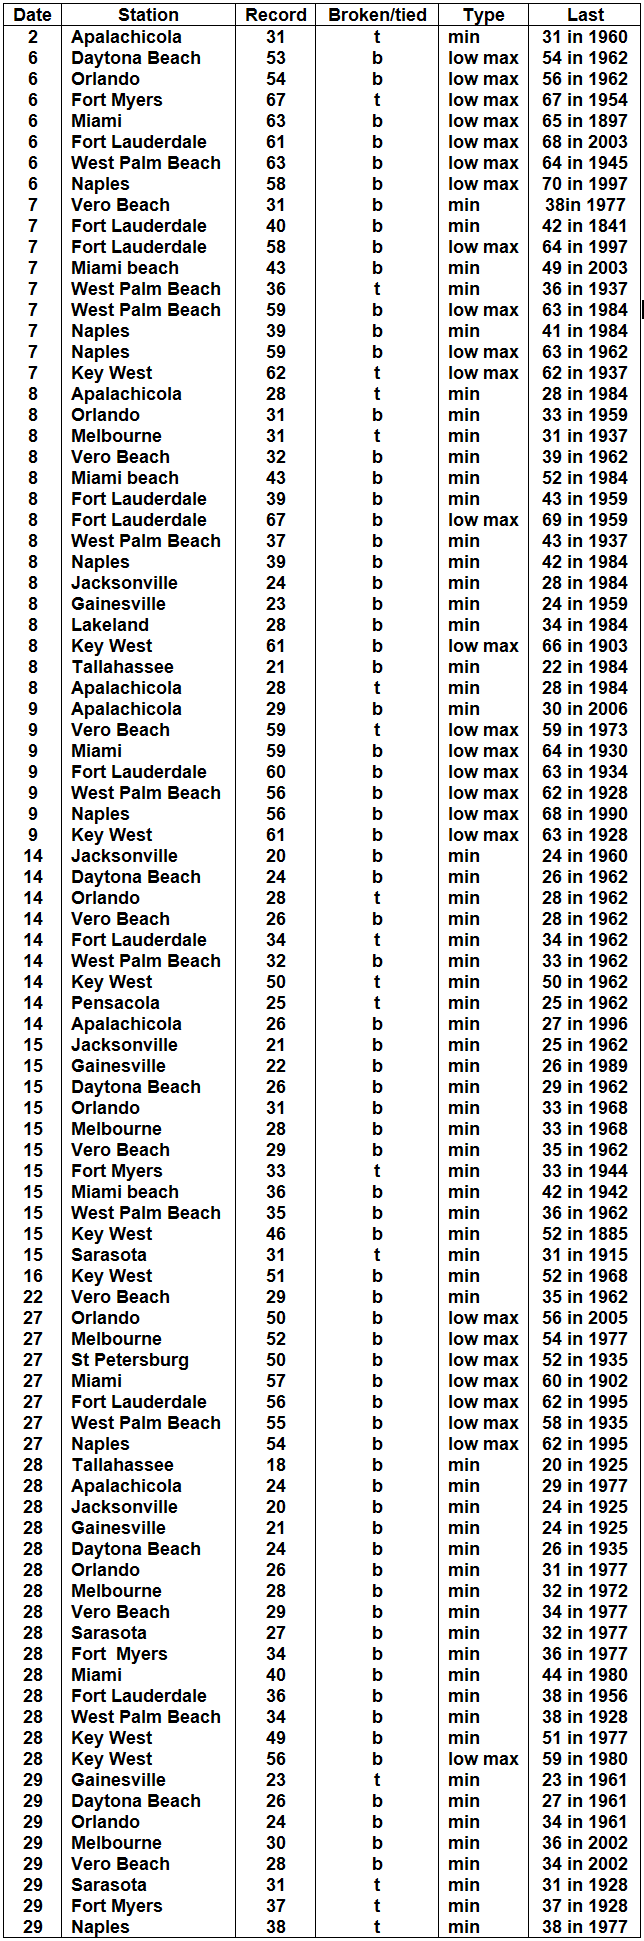
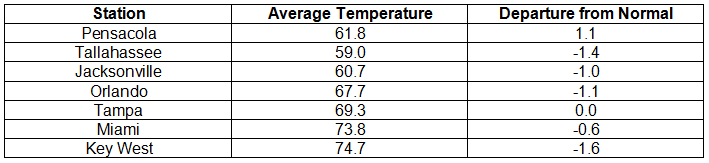
Average temperatures much below normal in December. Average temperatures in December were much below normal (Table 1). At Tallahassee, Melbourne, Orlando, Tampa, Miami, and Key West, as well as numerous other sites across the state, this was the coldest December on record. Many long-standing daily minimum records were tied or broken (Appendix). A minimum temperature of 40° F at Fort Lauderdale on the 7th broke a record for that date set in 1841. On the 15th, minimum temperatures of 46° F at Key West and 31° F at Sarasota broke records in existence since 1885 and 1915, respectively. Later in the month, minima at Tallahassee (18° F), Jacksonville (20° F), and Gainesville (21° F) broke records in existence since 1925. Further, many record-low maximum temperatures were observed during the month.
Table 1: December average temperatures and departures from normal (° F) for selected cities.
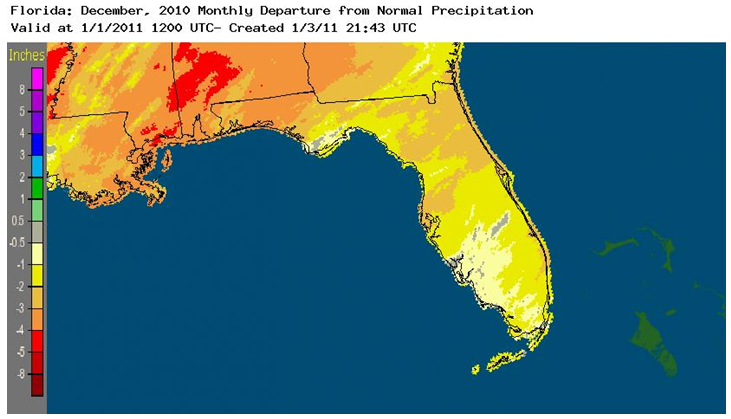
December rainfall totals below normal. Rainfall totals for December were below normal in all areas of the state (Table 2). An aerial perspective is given by Figure 1. Jacksonville, Orlando, Tampa, and Key West all received less than one inch of rain during December. In contrast, a daily total of 1.87 inches at Melbourne on the 18th broke the previous record of 1.68 inches observed in 2009. A trace of snow was observed at several places in the north on the 25-26th, including Pensacola, Apalachicola, Tallahassee, and Jacksonville.
Table 2: December precipitation totals and departures from normal (inches) for selected cities.
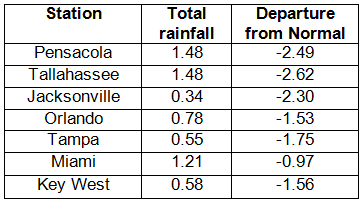
Figure 1: A graphical depiction of the monthly rainfall departure from normal (inches) for December is given in the figure below (courtesy of NOAA, NWS).
La Niña continues during December. Sea surface temperatures in the equatorial Pacific Ocean continued below normal during December, denoting a continued cold phase of ENSO, or La Niña. Winter dryness is associated with a cold phase of ENSO. In addition, cold phases of the large-scale North Atlantic Oscillation (NAO) and the Arctic Oscillation (AO) aided the advances of frigid air into the state.
Hazardous weather. No tornadoes occurred during December. On the 11th, thunderstorm wind gusts to 70-80 mph damaged houses, mobile homes, trees and roofs near Milton. Severe drought conditions persisted from the east-central coast into the northeastern portion of the state.
Agricultural and other impacts. The majority of field crops were finished for the season and did not suffer damage from the record cold of December. However, in the south tomatoes, peppers, and sweet corn suffered some freeze damage. An extended period of freezes in mid-month near Lake Okeechobee severely damaged sugarcane. Pastures in the north were heavily damaged by freezing temperatures. Although damage assessment is incomplete, some fruit damage and defoliation were evident after two major freezes in citrus areas. Continued drought conditions provided favorable conditions for the onset of several wildfires around the state.
Appendix: Temperature Records (° F) Tied or Broken during December (compiled from NWS).
Prepared by Preston Leftwich, David F. Zierden, and Melissa Griffin
Florida Climate Center
The Florida State University
Tallahassee, FL
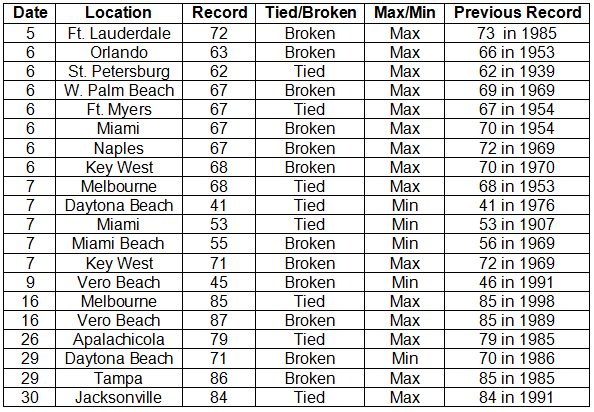
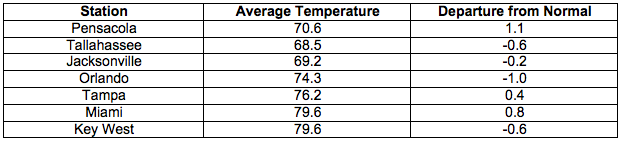
Average temperatures near normal for November. Overall, average temperatures for November were near normal (Table 1). During the first half of the month record low maximum temperatures were tied or broken in southern areas. A maximum temperature of 62° F at St. Perersburg on the 6th tied the lowest daily maximum, a record in existence since 1939. Several minimum temperature records were tied or broken, too. The minimum temperature at Miami on the 7th (53° F) tied a record in existence since 1907. Later in the month, several daily maximum temperature records were set (Appendix).
Table 1: November average temperatures and departures from normal (° F) for selected cities.
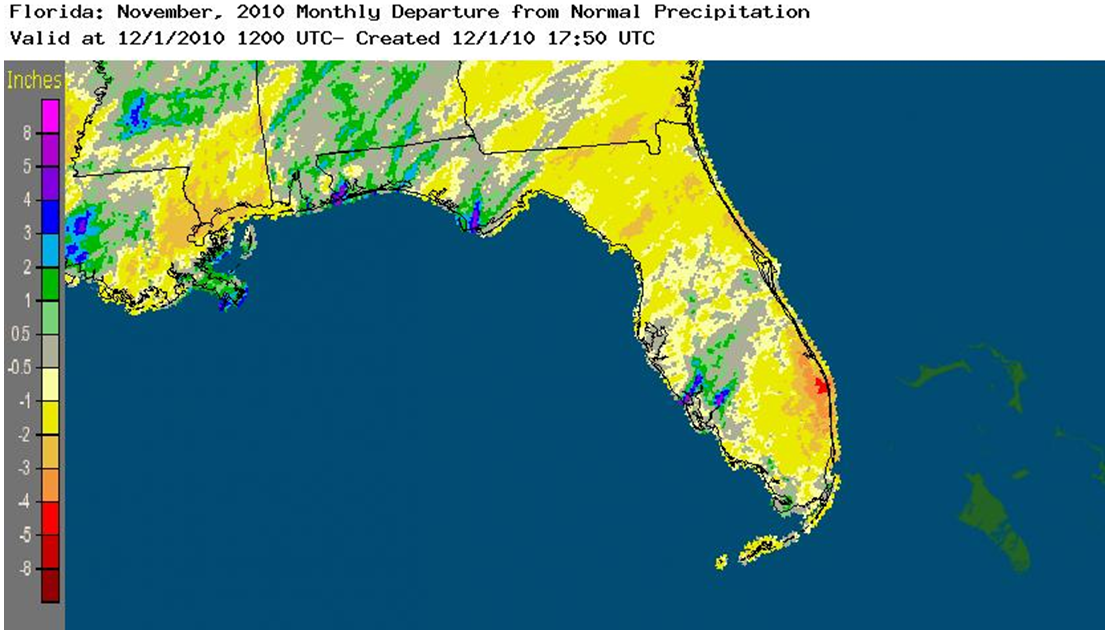
November rainfall totals near normal in most areas. Rainfall totals for November were near normal in most areas of the state (Table 2). In contrast, the monthly total of 7.33 inches recorded at Pensacola was nearly three inches above normal. A daily amount of 3.34 inches at Pensacola on the 3rd was a primary factor in the monthly total being above normal. Two daily rainfall records were set durng the month. On the 16th, 2.22 inches of rain broke the record of 1.05 in that occurred in 1957. An amount of 0.78 inch at Key West on the 26th broke the record of 0.61 inch that occurred in 1987. Monthly departures from normal November rainfall are depicted in Figure 1. While Panhandle areas were near or slightly above normal, an area along the south-central coast was more than four inches below normal.
Table 2: November precipitation totals and departures from normal (inches) for selected cities.
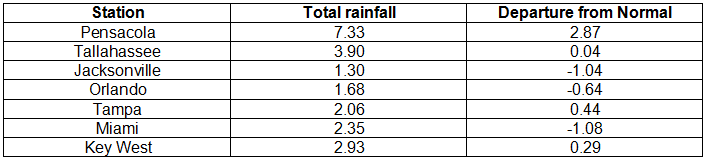
Figure 1: A graphical depiction of the monthly rainfall departure from normal (inches) for November is given in the figure below (courtesy of NOAA, NWS).
La Nina continues during November. Sea surface temperatures in the equatorial Pacific Ocean continued below normal during November, denoting a continued cold phase of ENSO, or La Nina. As a very active Atlantic hurricane season came to an end, no tropical cyclones affected the state during November.
Hazardous weather. No tornadoes were observed during the month. Only isolated severe local storms occurred. On the 2nd, golf-ball-sized hail fell near Pensacola. On the 15th, trees and power lines were downed by thunderstorm winds near Monticello. All areas of the state except the extreme southeast and Keys continued to experience drought conditions during November. Two areas, along the upper east coast and near the central east coast, reached extreme drought conditions by the end of the month. Although drought conditions eased somewhat in the Panhandle during November, areas near the borders of Alabama and Georgia still have moderate to severe drought conditions.
Agricultural and other impacts. Planting of cool season forage was delayed due to low soil moisture. Cattle producers continued to use hay as supplemental feed due to slowness of pasture growth. Frost and freezing temperatures in northern areas ended late vegetable production. Cooler weather aided strawberry development in west-central areas. By the end of the month citrus areas in Broward and Indian River Counties had reached extreme drought conditions.
Appendix: Temperature Records (° F) Tied or Broken during November (compiled from NWS).
Prepared by Preston Leftwich, David F. Zierden, and Melissa Griffin
Florida Climate Center
The Florida State University
Tallahassee, FL
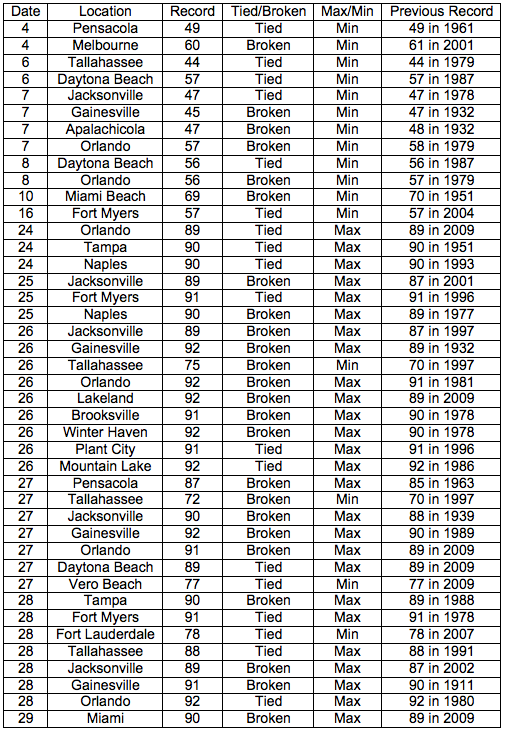
Average temperatures near normal for October. Overall, average temperatures for October were near normal (Table 1). Even so, there were many daily records set during the month (Appendix). During the first half of the month 12 daily minimum records were tied or broken. Among these, low temperatures of 45° F at Apalachicola and 47° F at Gainesville on the 7th broke records in existence since 1932. During the last eight days of October, 26 daily maximum records were tied or broken. High temperatures of 92° F on the 26th and 91° F on the 28th at Gainesville broke records in existence since 1932 and 1911, respectively. Tallahassee observed record high minimum temperatures on both the 26th and 27th.
Table 1: October average temperatures and departures from normal (° F) for selected cities.
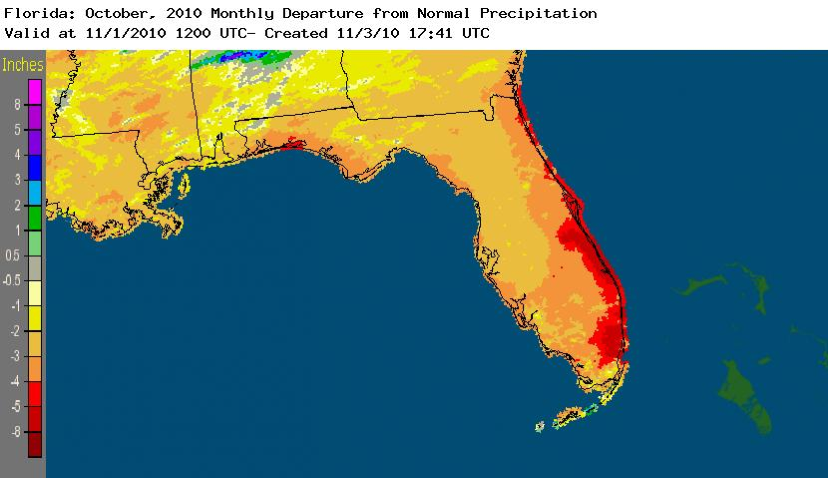
October rainfall totals much below normal except in the Keys. October rainfall totals were much below normal in almost all areas of the state (Table 2). Miami's monthly total was more than four and one-half inches below normal. Jacksonville and Orlando did not officially record rain and Tampa recorded only a trace during October. This was the driest October on record at these three stations. In contrast, a localized heavy rain event (3.44 in) on the 26th at Key West raised the monthly total above normal. The general sparseness of rainfall across the state during October is depicted in Figure 1. Departures from normal in eastern and southeastern coastal areas exceeded five inches.
Table 2: October precipitation totals and departures from normal (inches) for selected cities.
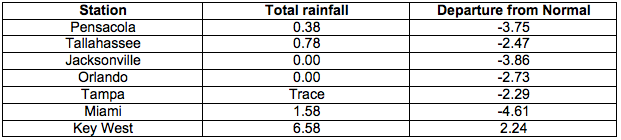
Figure 1: A graphical depiction of the monthly rainfall departure from normal (inches) for October is given in the figure below (courtesy of NOAA, NWS).
La Nina continues during October. Sea surface temperatures in the equatorial Pacific Ocean remained below normal during October, denoting a continued cold phase of ENSO, or La Nina. All five tropical cyclones in the Atlantic basin during October became hurricanes. Such increased tropical cyclone activity is associated with La Nina conditions. The warm, dry conditions across most of the state are also associated with La Nina.
Hazardous weather. No severe local storm events were reported during October. As Tropical Storm Paula passed near the Keys on the 12th, 8.28 inches of rain was recorded at the Marathon airport, resulting in the wettest day on record at that site. Small areas near the border with Alabama and along the east-central coast have reached extreme drought conditions. Severe drought conditions are present in the western Panhandle and along the northern two thirds of the Atlantic coast. Most of the northern two thirds of the state have abnormally dry conditions.
Agricultural and other impacts. Dry soil in western areas of the Panhandle hindered peanut digging as farmers harvested peanuts early in response to the worsening drought. Cattlemen have begun to use hay to supplement pastures that are in poor condition. River and well levels have continued to decrease in northern areas. Wildfire danger increased across most of the state as rainfall remained well below normal.
Appendix: Temperature Records (° F) Tied or Broken during October (compiled from NWS).
Building A, Suite 292
Tallahassee, FL 32306-2741
Phone: (850) 644-3417 | (850) 644-0719
climate@coaps.fsu.edu