


The Florida Climate Center serves as the primary resource for climate data, information, and services in the state of Florida.

The Florida Climate Center achieves its mission by providing climate monitoring, research, and expertise to be applied by the people, institutions, and businesses of Florida and the surrounding region.
We provide direct service by fulfilling requests for climate and weather data and information in a variety of formats.
We perform research that advances the understanding of the climate variability and changes of Florida and the surrounding region.
We provide outreach in presentations and at events aimed at a variety of groups, interests, and ages.
Prepared by Melissa Griffin, Preston Leftwich, and David F. Zierden
Florida Climate Center
The Florida State University
Tallahassee, FL

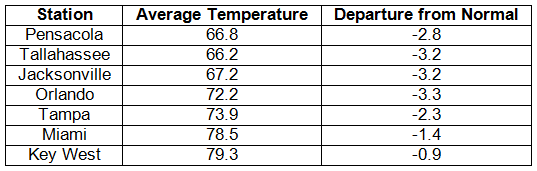
Average temperatures were below normal in October. Average temperatures were below normal across the entire state (Table 1). Departures from normal ranged from -0.9° F at Key West to -3.3° F at Orlando. It was the 2nd coldest October on record at Orlando, and October 2011 was in the top ten coldest Octobers for Pensacola (9th), Tallahassee (8th), and Jacksonville (7th). Cold dry air pushed into the state at the beginning of the month, causing numerous minimum temperature records to be broken or tied in the northeastern portions of the state from the 2nd to the 4th (see Appendix). Record low maximum temperatures on the 8th at Orlando and Melbourne corresponded with record rainfall events at both locations. Another round of cold air slipped into the state toward the end of the month, leading to more records being tied or broken on the 22nd and 23rd.
Table 1: October average temperatures and departures from normal (° F) for selected cities.
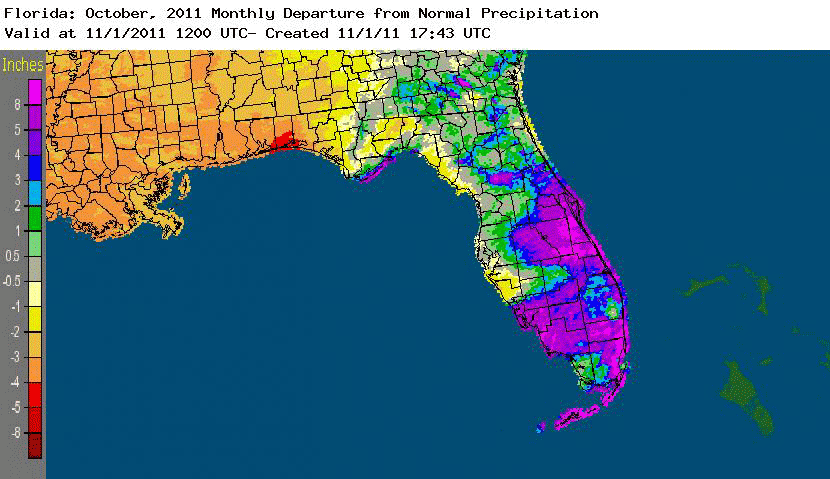
Rainfall totals varied in October. Rainfall totals varied greatly across the state during October (Table 2). In the north, the monthly total at Pensacola (0.24 inches) was five inches below normal, making October 2011 the 8th driest October on record at the station. In contrast, two separate heavy rain events along the southern part of the state helped ease drought conditions and broke many records. The monthly total (17.14 inches) at Key West makes it the 2nd wettest October on record, only behind October 1969 (21.57 inches). Orlando (8.87 inches) and Miami (15.52 inches) saw their 3rd and 5th wettest Octobers on record, respectively. Vero Beach had a daily record rainfall of 8.30 inches on the 8th, which was over double the previous record set in 1983 (Table 2). Apalachicola reported a daily rainfall total of 7.49 on the 18th that was over four times greater than the previous record for that date of 1.73 in 1989. Areal patterns of monthly rainfall relative to normal are depicted in Figure 1.
Table 2: October precipitation totals and departures from normal (inches) for selected cities.
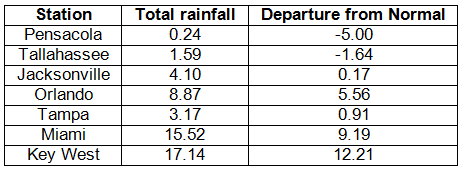
Table 3: Daily rainfall records (inches) broken during October (compiled from NOAA, NWS).
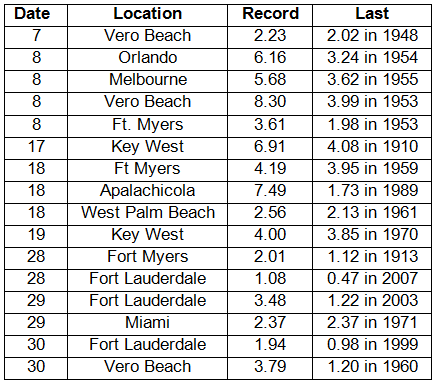
Figure 1: A graphical depiction of the monthly rainfall departure from normal (inches) for October is given in the figure below (courtesy of NOAA, NWS).
La Niña continues during October.La Niña conditions are present across the equatorial Pacific, with sea surface temperatures (SST) at least 0.5?C below average for the region. The atmospheric circulation anomalies and winds are consistent with La Niña. The current La Niña is forecasted to strengthen and continue through the winter of 2011/2012.
The 'Wild Card' will be the Arctic Oscillation (AO), which has the potential to trump the typical La Niña pattern. The AO is always present and fluctuates between positive and negative phases. The negative phase of the AO pushes cold Canadian air into the US, leading to periods of well-below normal temperatures, as it has the last two winters. Strong AO phases typically last a few weeks and are very difficult to predict more than a week or two in advance.
Hazardous weather. Numerous hazardous weather events were reported during the month of October. The beginning of the month started off with waterspouts and wind damage reported along the lower portions of the Florida Keys. High winds associated with a strong cold front caused minor damage as they moved through the state from the 8th through the 10th. A vigorous low-pressure system caused significant heavy rains, flooding, and tornadoes in south Florida from the 16th through the 18th. A tornado (EF-2) was confirmed in the Sunrise/Plantation area on October 18th; about 50 homes were damaged, and about a dozen homes received significant damage. Roofs were blown off two houses, and two trailers were shifted off their foundations. There were other tornadoes reported with the October 18th event in Indian River and Glades Counties. The remains of Hurricane Rina caused flooding, heaving rains, high winds, and a tornado as they moved through the area from the 28th to the 30th. On October 29th, an EF-0 tornado was reported around Hobe Sound, FL, (Martin County), which did some minor damage to some roofs and landscape.
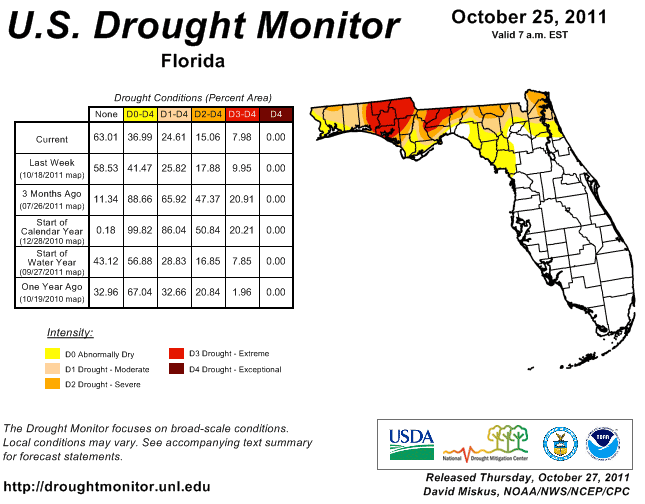
Agricultural and other impacts. The cooler and drier weather has helped facilitate the harvest of peanuts, cotton, and a variety of other crops across portions of the state. However, drought conditions continue to persist in northern portions of the state, with extreme drought conditions present around Leon and Gadsden Counties and the Choctawhatchee River basin. Heavy rains in the second half of October eased some of the dry conditions that had been lingering around Lake Okeechobee. The average lake level is 13.55 ft, which is down from the historic average of 15.03 ft but a significant change from the 11.13 ft that was reported a month ago.
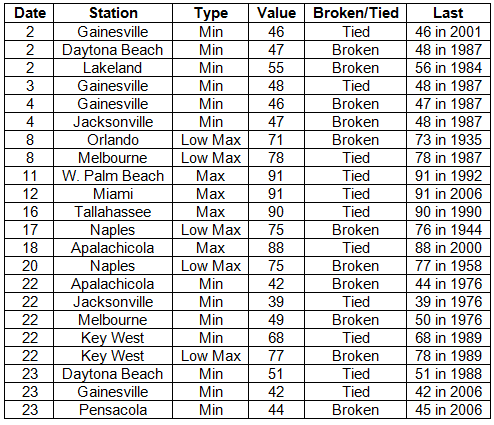
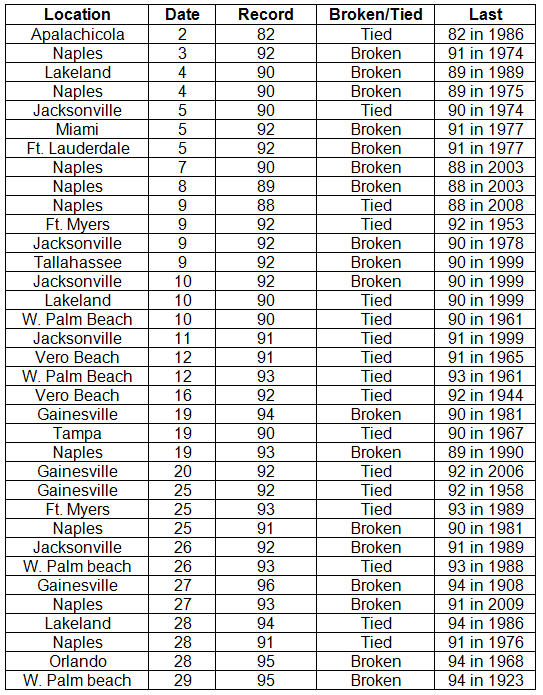
Appendix: Daily maximum and minimum temperature records (° F) tied or broken during October (compiled from NOAA, NWS).
Prepared by Preston Leftwich, David F. Zierden, and Melissa Griffin
Florida Climate Center
The Florida State University
Tallahassee, FL
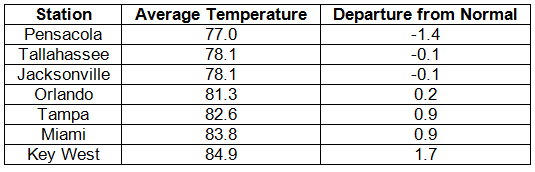
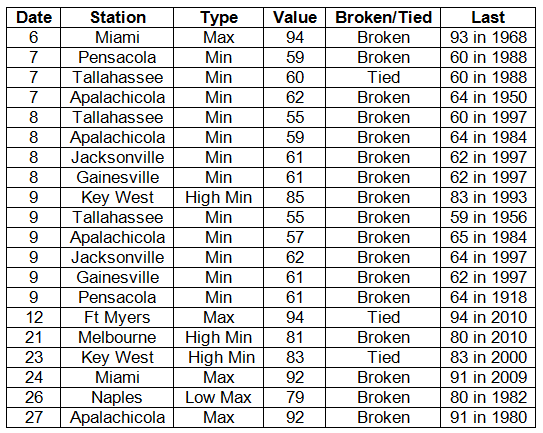
Average temperatures generally near normal in September. Average temperatures were slightly below normal in the north and slightly above normal in the south (Table 1). Departures from normal ranged from -1.4° F at Pensacola to 1.7° F at Key West. Cool dry air moved into northern parts of the state after the passage of Tropical Storm Lee. Subsequently, several daily minimum temperature records were set. On the 7th a minimum temperature of 62° F at Apalachicola broke a daily record in existence since 1950. On the 9th minimum temperatures of 55° F at Tallahassee and 61° F at Pensacola broke daily records in existence since 1956 and 1918, respectively. In contrast, the minimum temperature (85° F) at Key West on the 9th tied the all-time high minimum temperature for September. The maximum temperature (79° F) at Naples on the 26th was a record low daily maximum (Appendix).
Table 1: September average temperatures and departures from normal (° F) for selected cities.
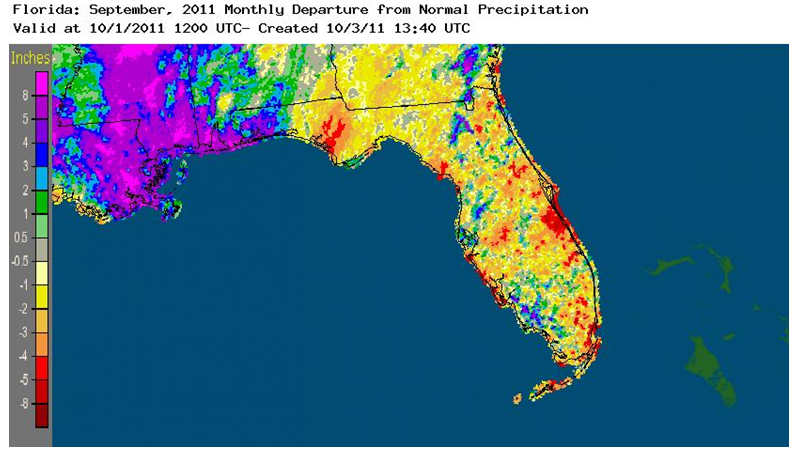
Rainfall totals varied in September. Rainfall totals varied greatly across the state during September (Table 2). In the north, the monthly total at Pensacola (8.15 inches) was more than two inches above normal. In contrast, the monthly total (4.99 inches) at Miami was almost five inches below normal. Three long-standing daily rainfall records were broken during the month (Table 3). In particular, a total of 3.36 inches at Key West on the 26th broke a daily record in existence since 1920. Areal patterns of monthly rainfall relative to normal are depicted in Figure 1. Particularly evident are (1) an above-normal area in the far northwest where Tropical Storm Lee produced several storm totals of almost eight inches and (2) a below-normal area along the central Atlantic coast. The latter area included Melbourne's monthly total (2.43 inches) that was more than five inches below normal.
Table 2: September precipitation totals and departures from normal (inches) for selected cities.
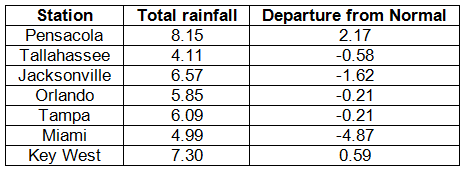
Table 3: Daily rainfall records (inches) broken during September (compiled from NOAA, NWS).
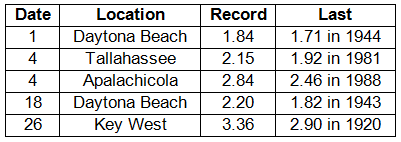
Figure 1: A graphical depiction of the monthly rainfall departure from normal (inches) for September is given in the figure below (courtesy of NOAA, NWS).
La Niña returns during September. By the beginning of September, cooling sea surface temperatures in the equatorial Pacific Ocean brought a return to a cold phase of ENSO, or La Niña. La Niña has little impact on weather in Florida during September.
Hazardous weather. Tropical Storm Lee spawned several tornadoes in northwest Florida from the 3rd through the 5th. On the 3rd, three tornadoes damaged structures and trees near Perdido Bay, Pensacola, and Crestview. A brief tornado touched down near Crystal Lake on the 4th. On the 5th there was widespread tree damage in the Panhandle. A tornado touched down near Dellwood and winds gusted to 65 mph at Mary Ester, 60 mph at the Panama City airport, and 59 mph at Pensacola. Farther to the east and south, trees were downed near Tallahassee, Newport, Capps, Madison, Lake City, High Springs, and St. Petersburg. Thunderstorm winds downed trees and power lines near St. Petersburg and damaged the roof of a condominium near Seminole on the 6th. From late afternoon on the 16th into early morning on the 17th, very heavy, convective rainfall occurred across inland northeast areas. Highest rainfall totals were more than nine inches near Jacksonville Beach. On the 26th, trees and power lines were downed near Arlington, Mayport, and Dungeness. Near the end of the month, one-inch diameter hail was observed at Mims on the 29th.
Agricultural and other impacts. Heavy rains during the month eased the drought in many areas of the state. Rain in the north delayed some peanut harvesting, but it loosened the soil for digging. Rain in the south interrupted some field planting while water was pumped from the fields. In contrast, extreme drought continued in a portion of the Panhandle and the extreme northeast corner of the state.
Appendix: Daily maximum and minimum temperature records (° F) tied or broken during September (compiled from NOAA, NWS).
Prepared by Preston Leftwich, David F. Zierden, and Melissa Griffin
Florida Climate Center
The Florida State University
Tallahassee, FL
Note: Comparisons to normal in this summary are based on averages for the period 1971-2000. Beginning August 1, 2011, averages for the period 1981-2010 are normal values of temperature and precipitation.
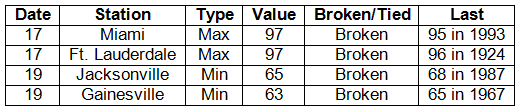
Average temperatures continued above normal in July. Average temperatures across the state were slightly above normal in July (Table 1). Two daily maximum records were broken during July. Both were 97° F at Miami and Ft. Lauderdale on the 17th (Table 2). Just two days later, daily minimum records were broken at Jacksonville (65° F) and Gainesville (63° F). Numerous daily record warm minimum temperatures were tied or broken during July. At West Palm Beach record warm minimum temperatures occurred on nine consecutive days at the end of the month. On the 28th and 29th, the minimum temperature at West Palm Beach (85° F) tied the all-time warmest minimum for any month there. Also, a minimum temperature of 84° F on the 28th tied the all-time warmest minimum for July at Ft. Lauderdale.
Table 1: July average temperatures and departures from normal (° F) for selected cities.
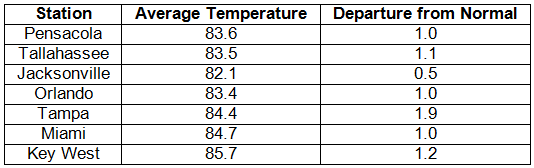
Table 2: Daily maximum and minimum temperature records (° F) broken or tied during July. (Compiled from NOAA, NWS.)
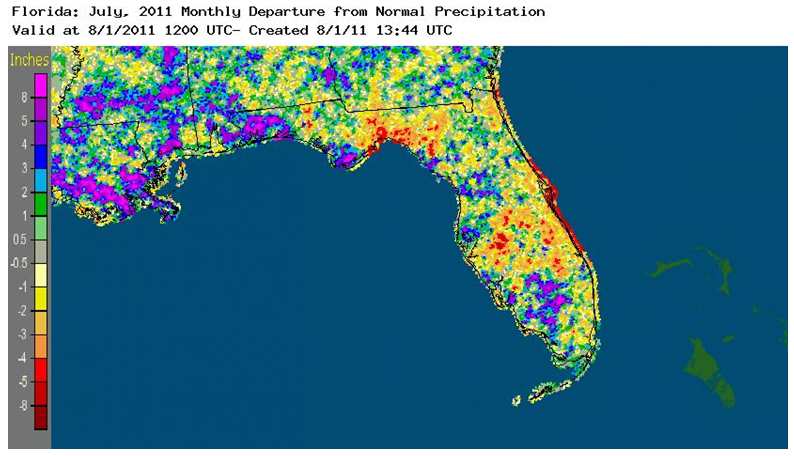
Rainfall totals varied relative to normal across the state during July. The monthly total at Tallahassee (4.28 in) was more than three and three-quarters inches below normal. In contrast, the monthly total at Orlando (10.62 in) was almost three and one half inches above normal (Table 3). Also, the monthly total at Pensacola (9.58 in) broke the record of 8.76 inches recorded in 2004. Several long-standing daily rainfall records were broken. The daily total at Vero Beach (4.09 in) on the 1st broke a record in existence since 1944 (Table 4). On the 7th, the daily total at Melbourne (2.80 in) broke a record in existence since 1957. Daily totals of 5.80 inches at Apalachicola and 3.13 inches at Ft. Myers on the 17th broke records in existence since 1964 and 1920, respectively. The daily total at Orlando (1.88 in) on the 22nd broke a record in existence since 1931. The impact of localized convective storms is evident in the departures from normal monthly rainfall for July (Figure 1). Well-above-normal rainfall occurred in the northwest and southwest, as well as other isolated locations. Well-below-normal rainfall fell in northern, south-central, and eastern coastal areas.
Table 3: July precipitation totals and departures from normal (inches) for selected cities.
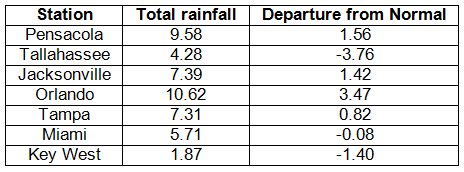
Table 4: Daily rainfall records broken during July.
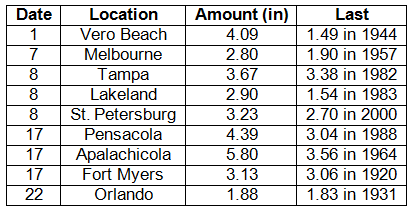
Figure 1: A graphical depiction of the monthly rainfall departure from normal (inches) for July is given in the figure below (courtesy of NOAA, NWS).
ENSO neutral phase continues during July. Sea surface temperatures in the equatorial Pacific Ocean were close to long-term average values during July, indicating a neutral phase of ENSO. However, atmospheric patterns continued to be as observed during La Niña. These ENSO conditions have little impact on weather across the state during summer.
Hazardous weather. A weak tornado caused roof and siding damage to four homes near Zephyrhills on the 7th. A severe thunderstorm produced wind gusts to 59 mph southwest of the Rotenberger Wildlife Management Area on the 1st. On the 15th trees were downed near Greenville, Madison, Hamilton, Jasper, and Lake City. Thunderstorm winds gusted to 60 mph at Estero, 59 mph at Charlotte County Airport, and 58 mph at Fort Myers on the 22nd. As a strong line of thunderstorms moved northeastward across the northeast corner of the state on the 25th, wind gusts downed trees and/or power lines near Starke, Palatka, Durbin, Palm Coast, Orange Park, and downtown Jacksonville.
Agricultural and other impacts. Substantial rain that fell during the middle of the month improved soil moisture for crops and pastures. Rain helped the growth of cotton and peanuts in the north, but plant sizes were still smaller by a few weeks of growth due to earlier dryness. Rapid growth of sugarcane was noted after rains in the south. However, the threat of pests and disease increased with higher moisture and high temperatures. Extreme drought conditions persisted in the northwest, north, and southeast parts of the state. Near-normal rains in recent weeks only produced short-term relief from the drought, and water restrictions are still in place in the southeast.
Prepared by Preston Leftwich, David F. Zierden, and Melissa Griffin
Florida Climate Center
The Florida State University
Tallahassee, FL
Note: Comparisons to normal in this summary are based on averages for the period 1971-2000. Beginning July 1, 2011, averages for the period 1981-2010 are the normal values of temperature and precipitation.
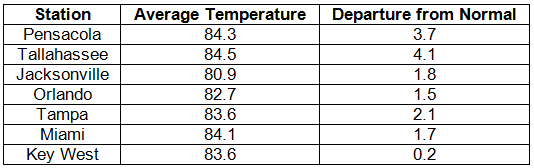
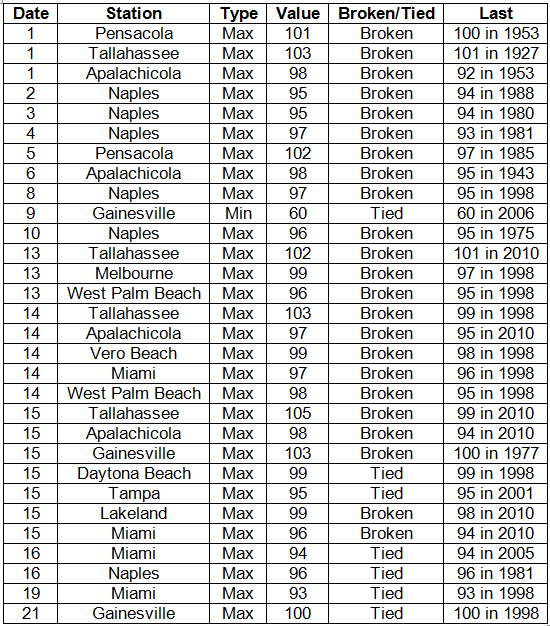
Average temperatures continue above normal in June. Average temperatures were well-above normal in the north during June (Table 1). Many daily maximum temperature records were tied or broken, especially during the first half of the month (Appendix). Three stations-Naples (2nd-4th), Tallahassee (13th-15th), and Miami (14th-16th)-observed record daily maxima on three consecutive days. The maximum temperature at Tallahassee on the 1st (103° F) broke a record in existence since 1927. A maximum of 98° F at Apalachicola on the 6th broke a record in existence since 1943. On the 15th, a maximum at Tallahassee (105° F) not only set a new record for the date but is now the highest temperature on record there. The previous highest temperature was 104° F, observed on June 20, 1933. On the 9th, the temperature dipped to a minimum of 60° F at Gainesville, tying the daily record established in 2006.
Table 1: June average temperatures and departures from normal (° F) for selected cities.
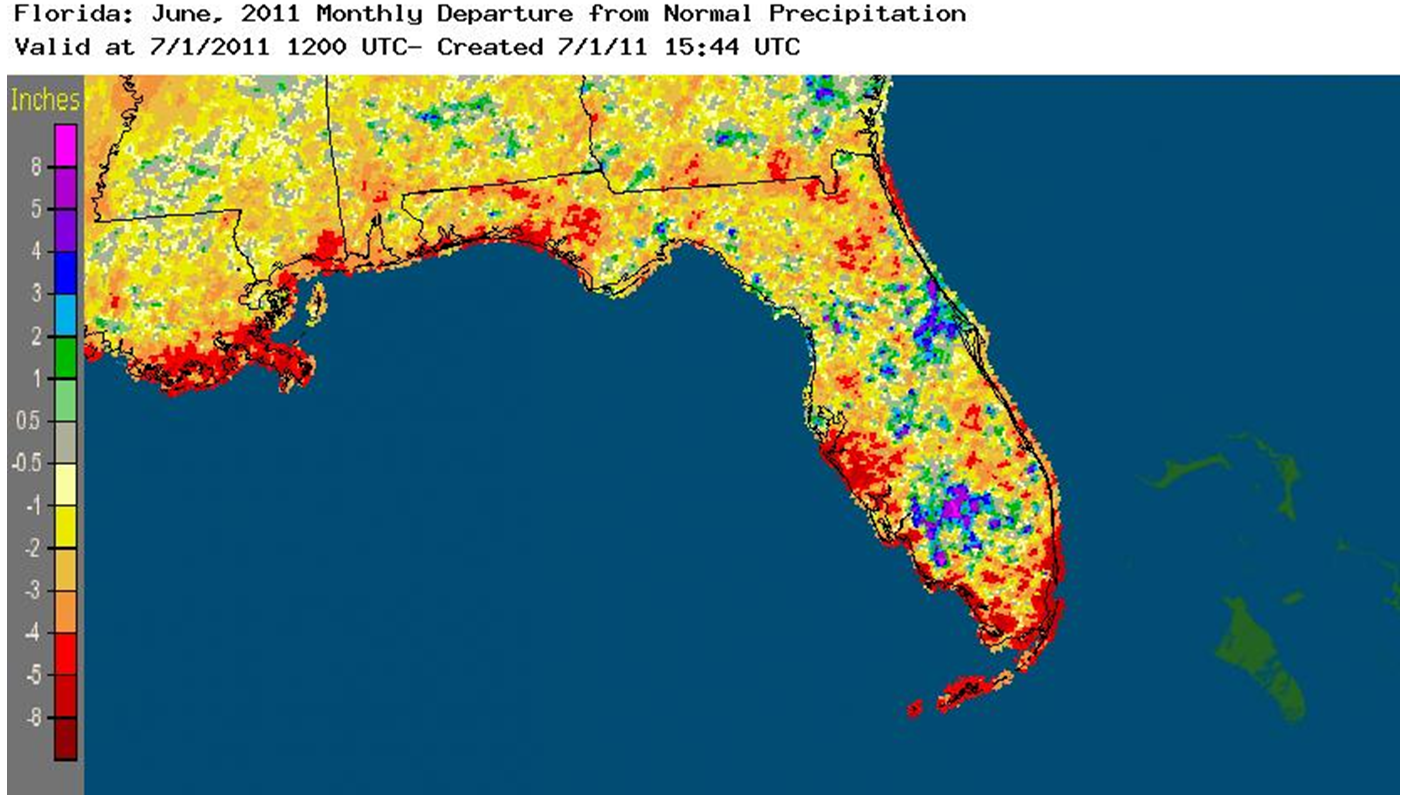
Rainfall totals below normal in most areas in June. Rainfall totals for June were below normal across most of the state (Table 2). Monthly totals at Pensacola (1.64 in) and Key West (0.71 in) were more than four and three inches below normal, respectively. In contrast, the monthly total at Miami (12.22 in) was more than three inches above normal, aided by a daily total of 3.19 inches observed on the 30th. Daily totals at Fort Myers (4.22 in) and Daytona Beach (1.92 in) on the 29th broke records in existence since 1909 and 1932, respectively (Table 3). In addition, a monthly total of 1.15 inches at Miami Beach was the driest June on record, breaking the previous record of 1.45 inches observed in 1927. A monthly total of 1.20 inches at Sarasota denoted the second driest June since records began in 1911. Although most areas of the state recorded below normal monthly totals, there were areas in the southwest and near the central east coast where totals were above normal (Figure 1). At Daytona Beach a monthly total of 12.29 inches was 6.60 inches above normal.
Table 2: June precipitation totals and departures from normal (inches) for selected cities.
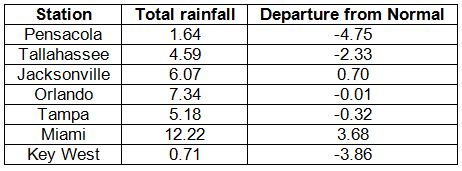
Table 3: Daily rainfall records (inches) tied or broken during June (compiled from NOAA, NWS).
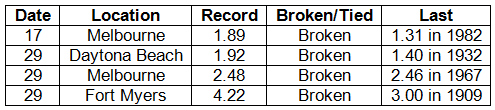
Figure 1: A graphical depiction of the monthly rainfall departure from normal (inches) for June is given in the figure below (courtesy of NOAA, NWS).
ENSO reaches neutral phase during June. Sea surface temperatures in the equatorial Pacific Ocean continued to warm slightly and reached near-normal values during June, indicating a neutral phase of El Niño-Southern Oscillation (ENSO). Continued dryness in the northwest and some areas of above-normal rainfall in central and southwestern parts of the state were consistent with lingering effects of the recent La Niña period.
Hazardous weather. June was an active month for severe thunderstorms. Many events of downed trees and power lines occurred. Most events occurred in north and central parts of the state, but notable severe events occurred in the south, too. On the 5th, trees were downed in Tallahassee. The next day, there were numerous trees downed across north and north-central areas. Golf-ball size hail (1.75 inches in diameter) was observed in Bellview and Newburn. On the 12th, golf-ball hail and 64 mph wind gusts were observed at Weston, and one-inch diameter hail and 60 mph winds were observed at Pembroke Pines. A confirmed downburst downed trees and produced some structural damage near Jacksonville on the 13th. On the 15th strong winds were reported at Winter Haven (63 mph) and Titusville (67 mph). Trees were downed in Immokalee, Naples, and Marco Island. Gusts estimated to be 70-80 mph occurred at Belle Meade, and gusts to 58 mph were observed at Naples and Marco Island. On the 17th, a thunderstorm produced a wind gust of 65 mph at Gainesville. This is the highest wind gust on record there. Trees were downed near Pomona Park and Daytona Beach, Orlando International Airport recorded a wind gust of 70 mph, and Patrick AFB recorded a gust of 64 mph on the 18th. One plane was flipped and several small planes were moved as 76 mph gusts hit Panama City Airport on the 24th. On the 26th, one-inch hail was observed at Ponce De Leon and De Funiak Springs. Trees were downed at Tallahassee, Daytona Beach, White Springs, Hilliard, and Live Oak, and a waterspout knocked out power to St. George Island. On the last day of the month, many trees and power lines were downed around Tallahassee, Woodville, Crawfordville, and Palm Springs. Thunderstorms produced gusts of 72 mph at Pompano Beach and 64 mph at Tallahassee.
Agricultural and other impacts. Excessive heat and continued drought had notable impacts during June. In the north, corn, cotton, and peanuts were severely affected by continued drought conditions. In the south, the prime growing season for sugarcane was affected by dryness and subsequent watering restrictions. Lack of widespread rainfall and excessive heat produced favorable conditions for the development and spread of wildfires. At mid-month there were over 400 active wildfires in the state. Cattle producers sent an above normal number of livestock to feed lots due to the poor condition of pasture. All locks in the northern portion of Lake Okeeechobee were closed to boat traffic due to the low water level. Water restrictions remained in place for both agricultural and general use in the southeast. By the end of the month, drought conditions had become exceptional in the northwest and extreme southeast.
Appendix: Daily maximum temperature records (° F) tied or broken during June. (Compiled from NOAA, NWS)
Prepared by Preston Leftwich, David F. Zierden, and Melissa Griffin
Florida Climate Center
The Florida State University
Tallahassee, FL
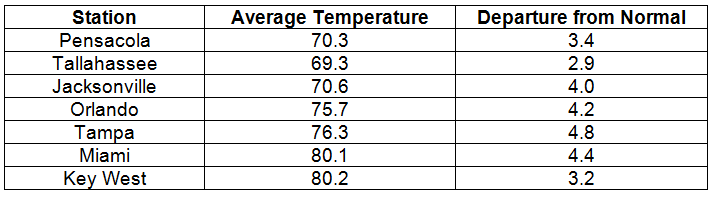
Average temperatures well above normal in April. Average temperatures were well above normal throughout the state in April (Table 1). Monthly average temperatures at West Palm Beach (80.2° F), Fort Lauderdale (79.1° F), and Miami (80.1° F) are the warmest on record at these sites for April. Nine daily maximum temperature records were tied or broken at Naples (Appendix). The maximum of 92° F at Vero Beach on the 16th tied a record in existence since 1944. On the 29th, the maximum temperature reached 95° F at West Palm Beach, breaking the record of 94° F recorded in 1923. Also, the minimum temperature (79° F) at West Palm Beach on the 28th is the warmest minimum temperature on record there during April.
Table 1: April average temperatures and departures from normal (° F) for selected cities.
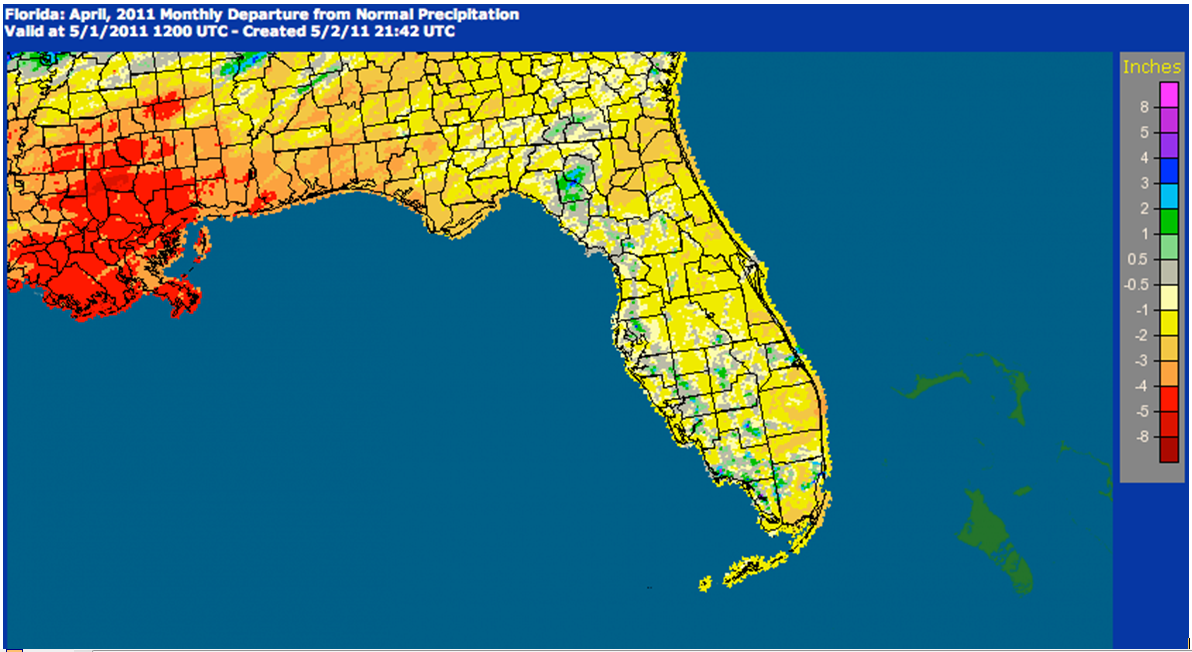
Rainfall totals below normal in most areas in April. Rainfall totals for April were generally below normal across the state in April (Table 2). Although above-normal monthly totals were observed at Tampa and Miami, such totals were isolated (Figure 1). The monthly total at Miami was raised above normal by a record daily total of 2.58 inches that fell on the 29th.
Table 2: April precipitation totals and departures from normal (inches) for selected cities.
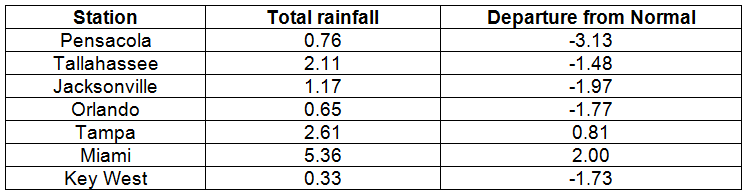
Figure 1: A graphical depiction of the monthly rainfall departure from normal (inches) for April is given in the figure below (courtesy of NOAA, NWS).
La Niña continues during April. Although sea surface temperatures in the equatorial Pacific Ocean continued to warm slightly during April, they continued below normal, denoting a weak cold phase of ENSO, or La Niña. Weather conditions continued as expected during a La Niña Spring.
Hazardous weather. During the early morning hours of the 4th, a strong squall line moved across northern areas. There were many reports of downed trees and power lines across the entire west-to-east extent of the state. Also, there were isolated reports of structures damaged by high winds or fallen trees. Wind gusts of 60mph were observed at Bonifay, and gusts up to 75 mph were observed at Perry. As the squall line continued to move down the state during the rest of the day, strong thunderstorm winds continued to produce damage. Wind gusts of 60 mph were recorded at Ormond Beach. Gusts of 59 mph were recorded at both Belle Glade and West Palm Beach. A tractor-trailer was overturned at West Boynton Beach, a trailer was overturned near Lakeland, and a house was damaged in West Melbourne. There were numerous reports of downed trees and power lines. On the 20th, golf-ball sized hail fell at Anthony, and ping-pong-ball sized hail fell near Ocala. Trees were downed near Archer, Newberry and Andalusia. Early on the morning of the 28th, a confirmed EF-1 tornado moved across Quincy Municipal Airport. Several airplanes were damaged and numerous trees were downed along a three-mile path. As a squall line preceded a cold front moving into the state, thunderstorm winds up to 65 mph downed trees and power lines near Tallahassee. Trees were blown down near Madison and power lines were downed near Dowling Park. Large hail, the size of a ping-pong ball west of Tallahassee, the size of a golf ball at Titusville and Buckhead Ridge, and the size of a baseball near Okeechobee, was observed. A wind gust of 62 mph was recorded at the Kennedy Space Center.
Agricultural and other impacts. Early in the month, widespread showers and above-normal temperatures helped the growth of early crops. Dry weather during most of the month aided the potato harvest and allowed fields to be prepared for the planting of cotton and peanuts. However, the dry weather and warm temperatures caused declines in pasture and leafy vegetables. Extreme drought conditions continued in the southeast. Water restrictions remained in place in Miami-Dade County. Severe drought remained in the northeast and extreme west. At the end of the month, only a small area around Tampa Bay was void of some degree of drought.
Appendix: Daily maximum temperature records (° F) tied or broken during April. (Compiled from NOAA, NWS)
Building A, Suite 292
Tallahassee, FL 32306-2741
Phone: (850) 644-3417 | (850) 644-0719
climate@coaps.fsu.edu