


The Florida Climate Center serves as the primary resource for climate data, information, and services in the state of Florida.

The Florida Climate Center achieves its mission by providing climate monitoring, research, and expertise to be applied by the people, institutions, and businesses of Florida and the surrounding region.
We provide direct service by fulfilling requests for climate and weather data and information in a variety of formats.
We perform research that advances the understanding of the climate variability and changes of Florida and the surrounding region.
We provide outreach in presentations and at events aimed at a variety of groups, interests, and ages.
Prepared by Melissa Griffin and David F. Zierden.
Florida Climate Center
The Florida State University
Tallahassee, FL

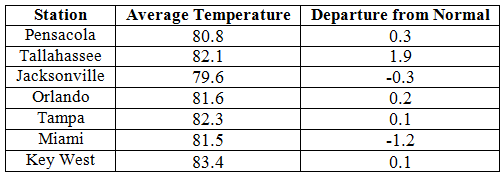
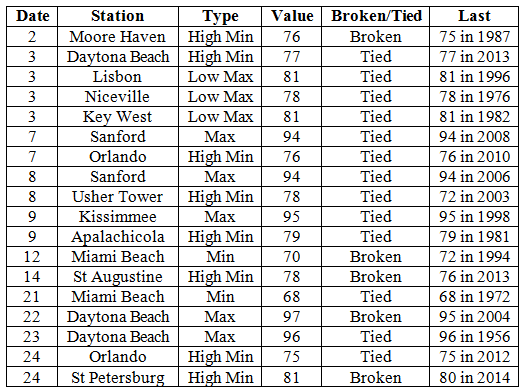
Average temperatures varied across the state in June. The departures for average temperatures in June 2014 varied across the entire state, though most of the reporting stations saw average temperatures above normal. The departures ranged from -1.2˚F in both Fort Lauderdale and Miami to 1.9˚F at Tallahassee (Table 1 and Appendix 1). Tallahassee reported a maximum temperature of 99˚F on the 29th and 30th, while most of the major reporting stations saw at least one day above 95˚F during June. There were multiple maximum and minimum temperatures that were broken or tied (Appendix 2).
Table 1: June average temperatures and departures from normal (inches) for select cities.
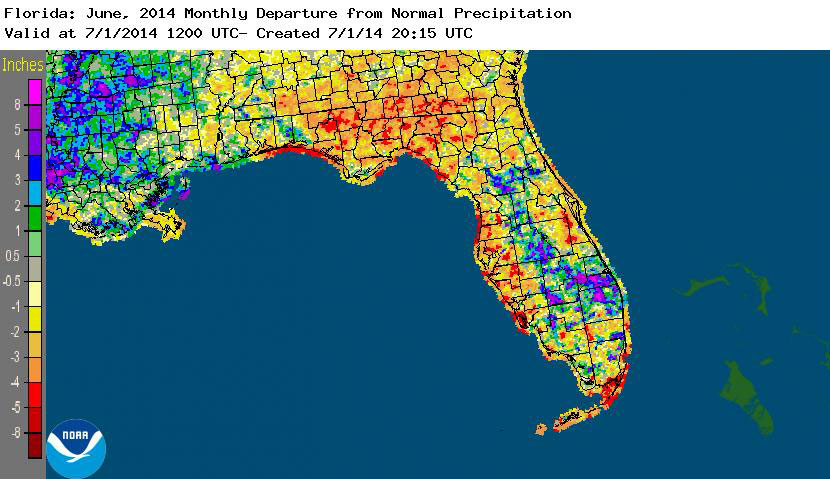
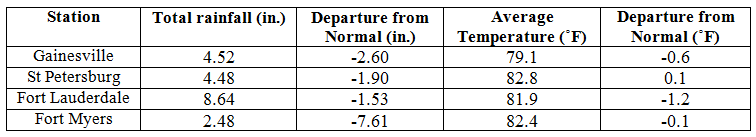
Rainfall totals varied across the state in June. Interior portions of the Florida Peninsula and the northwest Panhandle reported monthly rainfall totals well above normal, while the rest of the state saw below average rainfall during June (Figure 1). Departures from normal roughly ranged from -7.61” to 9.55” (Table 2 and Appendix 1), though localized parts of Florida saw rainfall totals that were as much as 8.00” below normal to over 10.00” above normal. June 2014 was the 7th wettest on record at Miami (the wettest was 1930 with 25.34”), and it was the 4th driest on record in Tampa (the driest was back in 1918 with only 1.26” of rain). There were multiple 24-hour precipitation records broken for the month (Table 3).
Table 2: June precipitation totals and departures from normal (inches) for select cities.
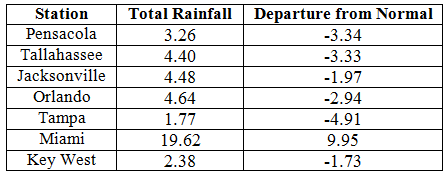
Table 3: Select daily rainfall records (inches) broken during June (compiled from NOAA, NWS).
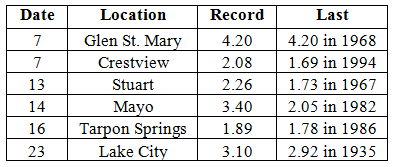
Figure 1: A graphical depiction of the monthly rainfall departure from normal (inches) for June is given in the figure below (courtesy of NOAA, NWS).
ENSO-neutral conditions continue in the Pacific. Based on current data and forecast models, the Climate Prediction Center (CPC) continues to have an El Niño Watch in place. Though Neutral ENSO conditions continue to be reported, the equatorial sea surface temperatures (SST) were above average across the equatorial Pacific. ENSO neutral conditions are currently being observed, with a 70% chance of transitioning to an El Niño by the end of summer and an 80% chance during the fall and winter. CPC predicts above normal temperatures across the entire state and normal precipitation through September 2014.
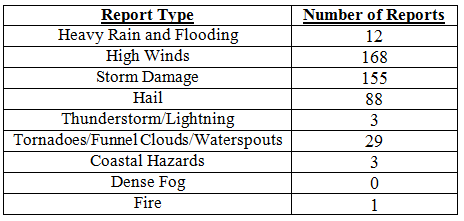
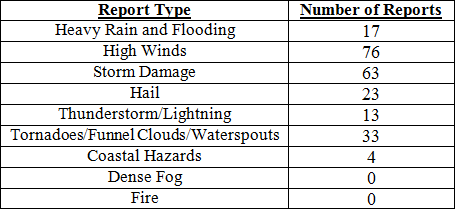
Hazardous weather events in June. There were a total of 459 severe weather reports made in Florida during June. On the 1st, a 27-year old male was pulled out to sea due to rip currents on Juno Beach. The Coast Guard suspended the search and the gentleman was presumed dead. The following day, heavy rains flooded parts of Aventura and Miami Gardens, FL. A severe thunderstorm set up along a boundary along north Florida late on the 6th and persisted through the early morning hours on the 7th, producing quarter sized hail, high winds (60 mph), and multiple reports of storm damage from Crestview to Fernandina Beach, including areas such as Marianna, Tallahassee, Lake City, and Maccleny. On the 8th, lightning caused damage to one of the runways at the Fort Lauderdale International Airport and structural fires in southern Tallahassee. Additional storms in other portions of the state, including north Florida and the interior peninsula, caused pea-sized hail and storm damage. Multiple reports of waterspouts were made along the coast of Fort Lauderdale on the 10th. High winds, up to 60 mph, were recorded up the east coast of Florida from the Keys to St. Augustine. A 70-year-old man was struck by lightning while picking blueberries by Allentown, and a person succumbed to strong rip currents off Clearwater Beach on the 13th. Another male lost his life due to rip currents off the coast of New Smyrna Beach on the 22nd. Various sea breeze thunderstorms caused hail, high wind, and storm damage across the state during the entire month of June.
Table 4: Breakdown of storm reports submitted in Florida during June (compiled from Southeast Regional Climate Center).
Agricultural and other climate-related impacts. At the beginning of June, topsoil and subsoil moisture levels across the state were running more than 60% adequate and about 6% at surplus levels. Daily rain in the Panhandle had delayed the harvest of winter wheat and oats. Peanut planting was about 80% complete statewide, which was ahead of last year’s number. Some fields in central Florida were flooded, delaying planting of cucumbers and squash. Various fruits and vegetables were coming to market, while melons, okra, and others were being planted in Dade County. Moderate drought conditions in the southwestern part of the state impacted part of the southernmost citrus growing area. Cotton, peanuts, and corn continued to be planted in the northern part of the state, weather permitting, around mid-month. Some areas of north Florida had excessive rain. Watermelon harvests were taking place in Dixie, Bradford, and Gilchrist counties, while potatoes harvesting slowed down in Flagler and Putnam counties. Increased heat led to a loss of soil moisture levels. Cattle and pasture conditions across the state were good to excellent.
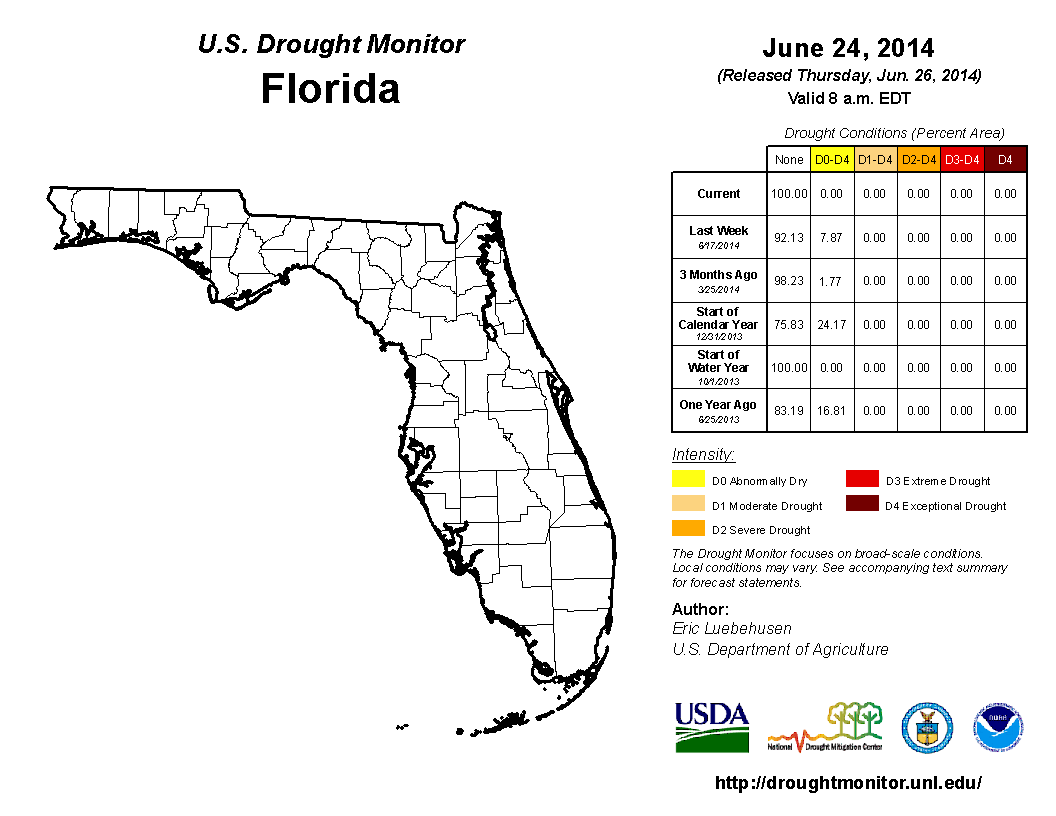
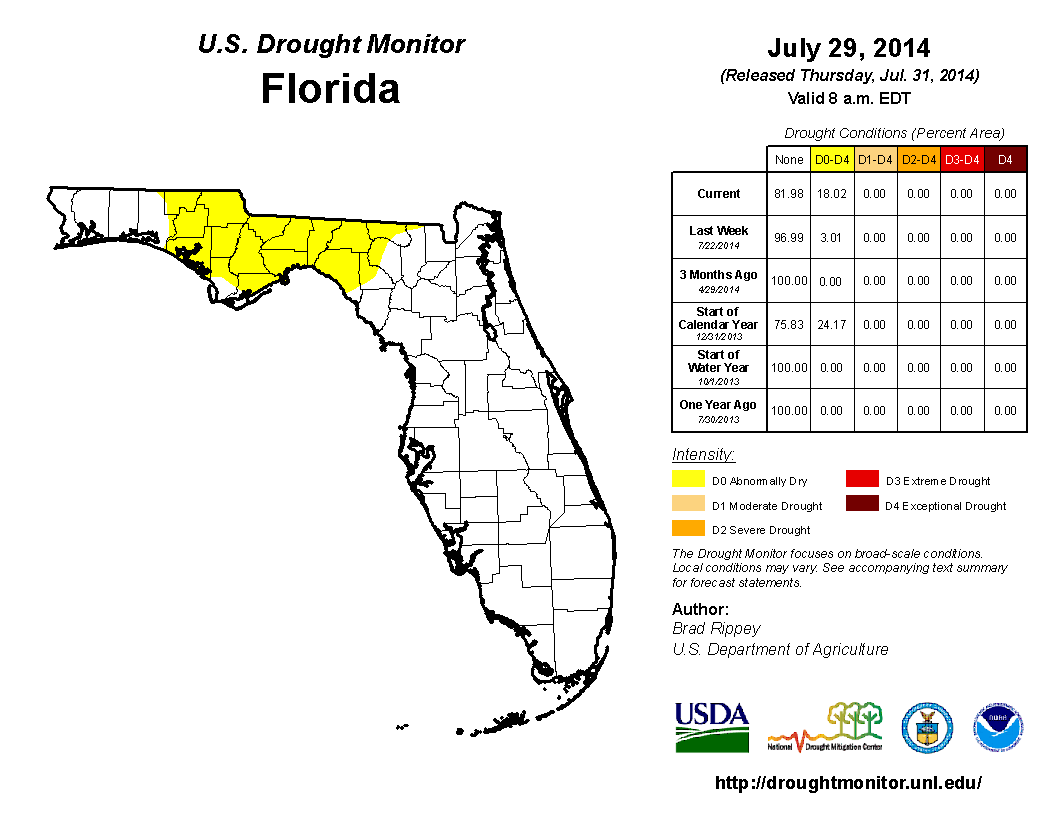
The National Drought Monitor showed that the lack of rainfall for the state at the end of May led to an increase in observed drought conditions, with moderate drought (D1) recorded for coastal portions of Collier, Dade, and Monroe counties. The Everglades, along with most of the Gold Coast, were experiencing abnormally dry (D0) conditions for the first two weeks of the month. Around the time of the June 17th release, rains in southern portions of the state had eased the moderate conditions and had cut back the D0 to all of Dade and Monroe counties and portions of Broward and Collier counties. Continued rains through the remainder of the month further alleviate drought conditions across the entire state. Lake Okeechobee is currently at 12.95 ft., which is up from the end of May.
Figure 2: Drought conditions in Florida as of June 24, 2014 (courtesy of U.S. Drought Monitor).
Appendix 1: Additional June departures from normal data for Florida locations.
Prepared by Melissa Griffin and David F. Zierden.
Florida Climate Center
The Florida State University
Tallahassee, FL
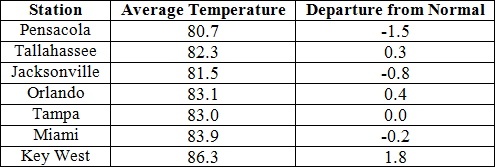
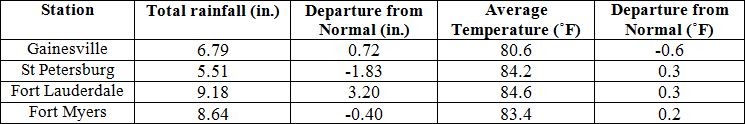
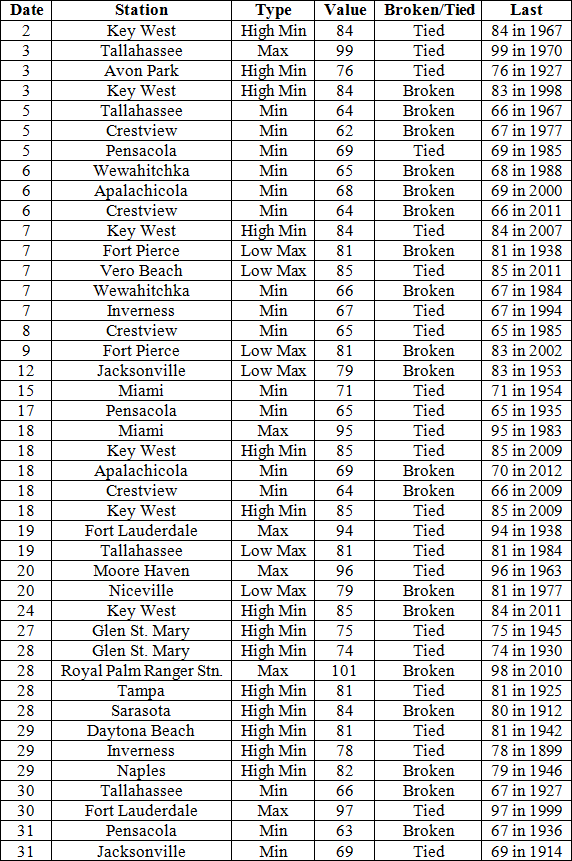
Average temperatures varied across the state in July. The departures for average temperatures in July 2014 varied across the entire state, though most of the reporting stations saw average temperatures above normal. The departures ranged from -1.5˚F in both Pensacola to 1.8˚F at Key West. (Table 1 and Appendix 1). July 2014 was the 4th warmest on record in Key West and the 7th coldest in Perry. Royal Palm Ranger Station reported 101˚F on the 28th, the highest temperature in Florida for the month. Tallahassee reported a maximum temperature over 95˚F for nine days in July, and Miami recorded its hottest temperature (95˚F) since 2011. Minimum temperatures were also a story this month, with multiple records tied or broken due to cold fronts impacting the state (Appendix 2).
Table 1: July average temperatures and departures from normal (inches) for select cities.
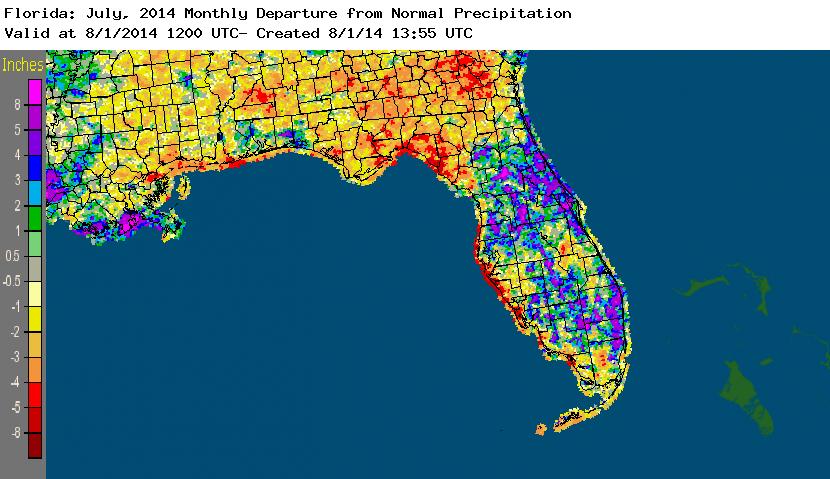
Rainfall totals varied across the state in July. Portions of the Florida Peninsula reported monthly rainfall totals well above normal, while most of the rest of Florida saw below average rainfall during July (Figure 1). Departures from normal roughly ranged from -4.84” to 5.61” (Table 2 and Appendix 1), though localized parts of Florida saw rainfall totals that were as much as 8.00” below normal to over 8.00” above normal. July 2014 was the 7th wettest in Tampa and the 10th wettest on record at Miami, and it was the 2nd driest in Tallahassee (the driest was in 1918, with only 1.28” reported for the month) and it was 8th driest on record in Jacksonville. There were multiple 24-hour precipitation records broken for the month (Table 3).
Table 2: July precipitation totals and departures from normal (inches) for select cities.
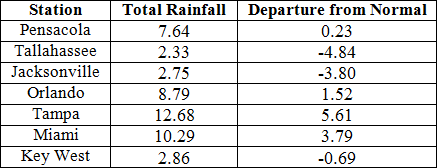
Table 3: Select daily rainfall records (inches) broken during July (compiled from NOAA, NWS).
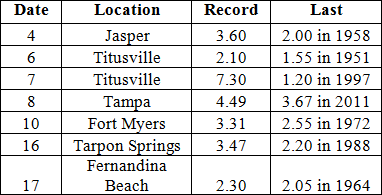
Figure 1: A graphical depiction of the monthly rainfall departure from normal (inches) for July is given in the figure below (courtesy of NOAA, NWS).
ENSO-Neutral Conditions Continue in the Pacific.
Based on current data and forecast models, the Climate Prediction Center (CPC) continue to have an El Niño Watch in place. Though Neutral ENSO conditions continue to be reported as sea surface temperatures (SST) were slightly above average across the eastern equatorial Pacific. Tropical rainfall is slightly enhanced over Indonesia and in the western equatorial Pacific. CPC predicts above normal temperatures across the entire state and normal precipitation through October 2014.
Hazardous Weather Events in July.
There were a total of 229 severe weather reports made in Florida during July. The month started off with the St. Augustine Life Guard Patrol performing 11 rip current rescues on the 2nd. A strong thunderstorm complex that moved westward across the Peninsula during the afternoon on the 2nd caused storm damage along the Apalachee Bay area and in portions of the Big Bend during the early morning hours on the 3rd. Also on the 3rd, a possible tornado caused damage in Elkton, FL and multiple reports of storm damage, including high winds and hail in portions of north Florida. A man was struck by lightning while outside of his house in Sunrise, FL the afternoon on the 4th. Waterspouts were reported on the 9th, in both Boca Raton and Venice, FL. On the same day, lightning created several small brush fires and a structural fire in Palm Coast, FL (Flagler County). Spotters reported waterspouts again on the 10th, this time off of Big Torch Key and Patrick AFB. The Jacksonville area had three days (12th – 14th) of severe weather, with thunderstorms producing high winds (55 mph), storm damage (downed trees and power-lines), hail (pea to marble sized), and heavy rains. Lightning caused a house fire in Naples, and a thunderstorm produced dime-sized hail in the greater Miami metro area on the 15th. Strong storms ahead of an approaching cold front caused multiple reports of lightning strikes causing structural fires in and around the Tampa Bay area on the 16th. The same line of thunderstorms produced high winds along portions of the Peninsula and even a few waterspouts off the coast of Venice, FL. Rip currents were strong along east Florida beaches on the 19th – 21st with over 2 dozen water rescues and 2 fatalities reported by lifeguards from Jacksonville to Melbourne. From the 20th – 24th, one person died and 5 others were injured when struck by lightning across the state. A very weak tornado touched down along SR 528 in Wedgefield, FL (Orange County) on the 24th. The very next day, an EF0 tornado touched down at Massey Ranch Air Park, flipping two planes and causing extensive damage to three hangers. Lightning from a severe thunderstorm struck a car on Interstate 10 in Jackson County on the 28th, causing significant damage to the vehicle and injuring the driver.
Table 4: Breakdown of storm reports submitted in Florida during the month of July (Compiled from Southeast Regional Climate Center.)
Agricultural and other climate related impacts.<br/ > At the beginning of July, topsoil and subsoil moisture levels across the state were running more than 70% adequate and about 5%. A late planting of soybeans continued in the Panhandle, while hay was being cut due to the drier field conditions in the same area. Central Florida hay fields were too wet for any cutting, but the rain was beneficial to the citrus producing area. Watermelon harvesting completed in Gilchrist County and began in Jackson County. By mid-month, peanut conditions across the state were mainly good (72%) to excellent (7%) with pegging at 71%. Armyworms had been spotted in pastures in the Panhandle and north Florida. Pasture conditions in Charlotte, Collier, Glades, Hendry and Lee counties had improved, through standing water was reported in pastures in St. Lucie County. Fall tomato planting started in Gadsden County, while peppers were planted in Bradford County. Vegetable and fruit were harvested in southern counties, with avocados, okra, and mangoes were harvested in Miami-Dade County. Cattle conditions for the month were good (74%) to excellent (8%) and the next season’s citrus crop was progressing well with growers applying summer oils, fertilizers and resetting new trees.
Rainfall across most of the state kept drought conditions in check for most of July. The state started the month ‘drought free’, until the release of the National Drought Monitor on the 15th. Abnormally dry conditions (D0) were introduced in Gadsden and Leon counties, along with portions of Holmes, Jackson and Jefferson counties along the state line between Alabama, Florida and Georgia. By the end of July, dry conditions were shown for most of the Big Bend and Panhandle counties after 3-months of below normal precipitation had been observed. In the Peninsula, the rains had curbed most of the dryness during the month and the water levels in Lake Okeechobee were currently at 13.89 ft., which is up from the end of June.
Appendix 1: Additional July departures from normal data for Florida locations.
Appendix 2: Select daily maximum and minimum temperature records (° F) tied or broken during July (compiled from NOAA, NWS).
Prepared by Melissa Griffin and David F. Zierden.
Florida Climate Center
The Florida State University
Tallahassee, FL
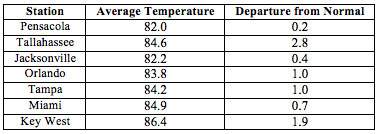
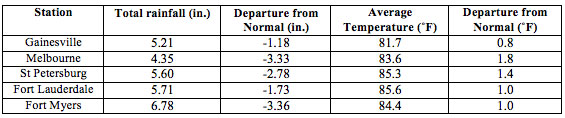
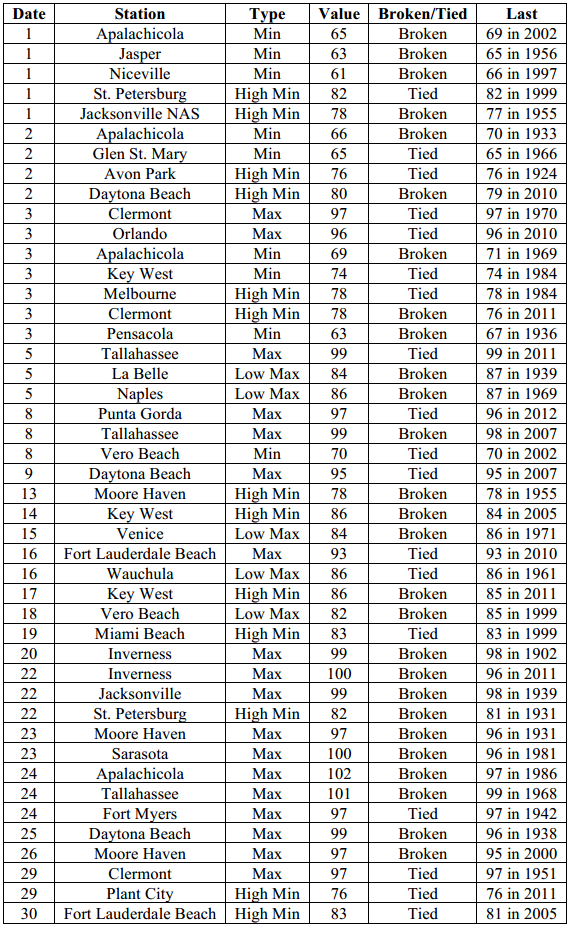
Average temperatures were above normal across the state in August. The departures for average temperatures in August 2014 were above normal across the entire state and the departures ranged from 0.2˚F in Pensacola to 2.8˚F at Tallahassee. (Table 1 and Appendix 1). August 2014 was the 2nd in Fort Myers, the 3rd warmest on record in Tallahassee and Key West, the 6th warmest in Daytona Beach and Miami, the 7th warmest in Tampa and the 9th warmest in Orlando and West Palm Beach. Royal Palm Ranger Station reported 101˚F on the 28th, the highest temperature in Florida for the month. Tallahassee reported a maximum temperature over 95˚F for 19 days in August and 2 days over 100˚F, and Apalachicola recorded a maximum temperature of 102˚F on the 24th, one degree off from tying the all time record set in 1931. Despite the record warm temperatures and heat wave at the end of the month, there were some minimum temperatures records tied or broken when cold fronts impacting the state earlier in the month (Appendix 2).
Table 1: August average temperatures and departures from normal (inches) for select cities.
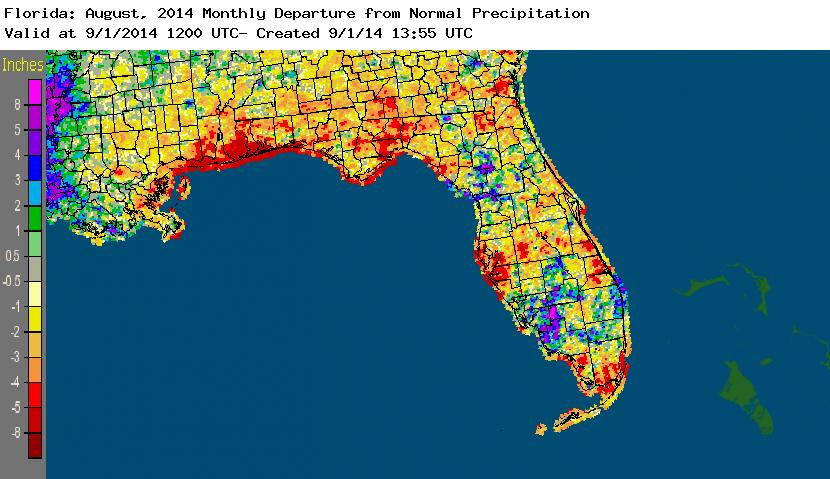
Rainfall totals varied across the state in August. Interior portions of the southern Florida Peninsula reported monthly rainfall totals well above normal, while most of the rest of Florida saw below average rainfall during July (Figure 1). Departures from normal roughly ranged from -5.39” to 0.19” (Table 2 and Appendix 1), though localized parts of Florida saw rainfall totals that were as much as 8.00” below normal to over 8.00” above normal. August 2014 was the 2nd driest in Tallahassee (the driest was in 2011, with only 2.03” reported for the month), 2nd driest in Daytona Beach (the driest was in 1963, with only 2.01” reported for the month) and it was 4th driest on record in Pensacola. There were multiple 24-hour precipitation records broken for the month (Table 3). The summer (June-July) was the driest on record in Tallahassee (only 8.99”, which is -13.26” below normal) and the 2nd wettest on record in Miami (38.98”, which is 13.93” above normal).
Table 2: August precipitation totals and departures from normal (inches) for select cities.
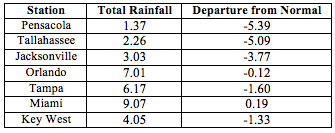
Table 3: Select daily rainfall records (inches) broken during August (compiled from NOAA, NWS).
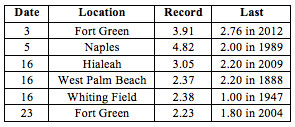
Figure 1: A graphical depiction of the monthly rainfall departure from normal (inches) for August is given in the figure below (courtesy of NOAA, NWS).
ENSO-Neutral Conditions Continue in the Pacific.
Based on current data and forecast models, the Climate Prediction Center (CPC) continue to have an El Niño Watch in place. Though Neutral ENSO conditions continue to be reported, positive sea surface temperatures (SST) anomalies continue in the eastern Pacific Ocean and just west of the Date Line. The chances of an El Niño event have decreased to about 65% during the Northern Hemisphere fall and early winter. CPC predicts above normal temperatures across northeast portions of the state and above normal precipitation in the southern Peninsula through November 2014.
Hazardous Weather Events in August.
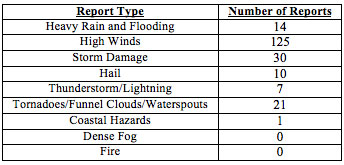
There were a total of 208 severe weather reports made in Florida during August. On the 3rd, lightning struck and injured a man in downtown St. Petersburg, FL. On the same day, a severe thunderstorm produced golf ball sized hail and high winds in Hosford, FL and a waterspout was spotted on Lake Okeechobee. Heavy rains, over 4 inches in less than a hour, in the Naples area caused urban flooding, with some roads under 2 feet of standing water. Multiple reports of a funnel cloud were made in New Port Richey on the morning of the 6th, though there was no confirmed touchdown. Thunderstorms on the 8th and 9th produced wind gusts of over 40 mph in the Titusville area, and storms on the 10th and 11th caused high winds, hail and minimal storm damage in portions of central Florida from Tampa to Daytona Beach. On the 12th, a person was injured in Milton, FL when a secondary lightning strike struck the vehicle he was leaning against. Two mature waterspouts were reported in Biscayne Bay on the 14th, along with 45 mph wind gusts in Vero Beach, and funnel clouds were seen over Palm Beach Gardens and Pompano Beach Airpark. Also on the 14th, thunderstorms dumped heavy rainfall in parts of south Jacksonville, causing some streets to flood. A USPS worker sustained serious burns when lightning struck near his truck and traveled through the vehicle as he was touching it in Lauderdale by the Sea on the 15th. At the same time, an estimated EF0 tornado touched down near the intersection of Indrio Road and US 1 north of Fort Pierce, FL. Another EF0 tornado was spotted on the 16th, this time in Boca West, near Clint Moore Road and the Florida Turnpike. Back to back evenings of thunderstorms on the 18th and 19th, caused pea-sized hail, high winds and localized storm damage in parts of northeast Florida, especially around the Jacksonville area. A strong storm on the 20th caused power outages in Wellington and there were reports of hail in the same area. Thunderstorms in Orlando, Palatka and Tallahassee caused downed trees and power lines, with storm damage different structures and some dime sized hail reported from those locations on the 21st. Winds up to 60 mph were reported with an intense line of thunderstorms that moved through Levy county on the 22nd. On the 24th, a waterspout was reported offshore in Crystal River, FL and sea breeze thunderstorms produced high winds along portions of Pinellas, Manatee, Sarasota, Charlotte and Lee counties. Heavy rain and dangerous lightning were reported in Gainesville on the 30th and on the 31st someone was struck and injured by lightning in Chiefland, FL.
Table 4: Breakdown of storm reports submitted in Florida during the month of August (Compiled from Southeast Regional Climate Center.)
Agricultural and other climate related impacts.
At the beginning of August, topsoil and subsoil moisture levels across the state were running more than 75% adequate and about 10%at surplus. Hay continued to be cut in the Panhandle, north and central Florida; although, army worms were reported found in hay, pasture, soybeans and peanuts. Peanut pegging was reported at 95% and farmers in southwest Florida continued land preparation for fall planting. Corn and corn silage harvesting continued in portions of the state and water levels beginning to rise in ponds and wetlands in parts of south Florida. Drier conditions through the month led to a decrease in surface and sub-surface soil moisture levels. Polk County began preparations for strawberries mid-month, while land preparation and setting down plastic for fall planting continued in many southwest Florida counties. Extreme heat at the end of the month made for unsuitable working conditions across the state, stressed cattle and contributed in decreased topsoil and subsoil moisture levels.
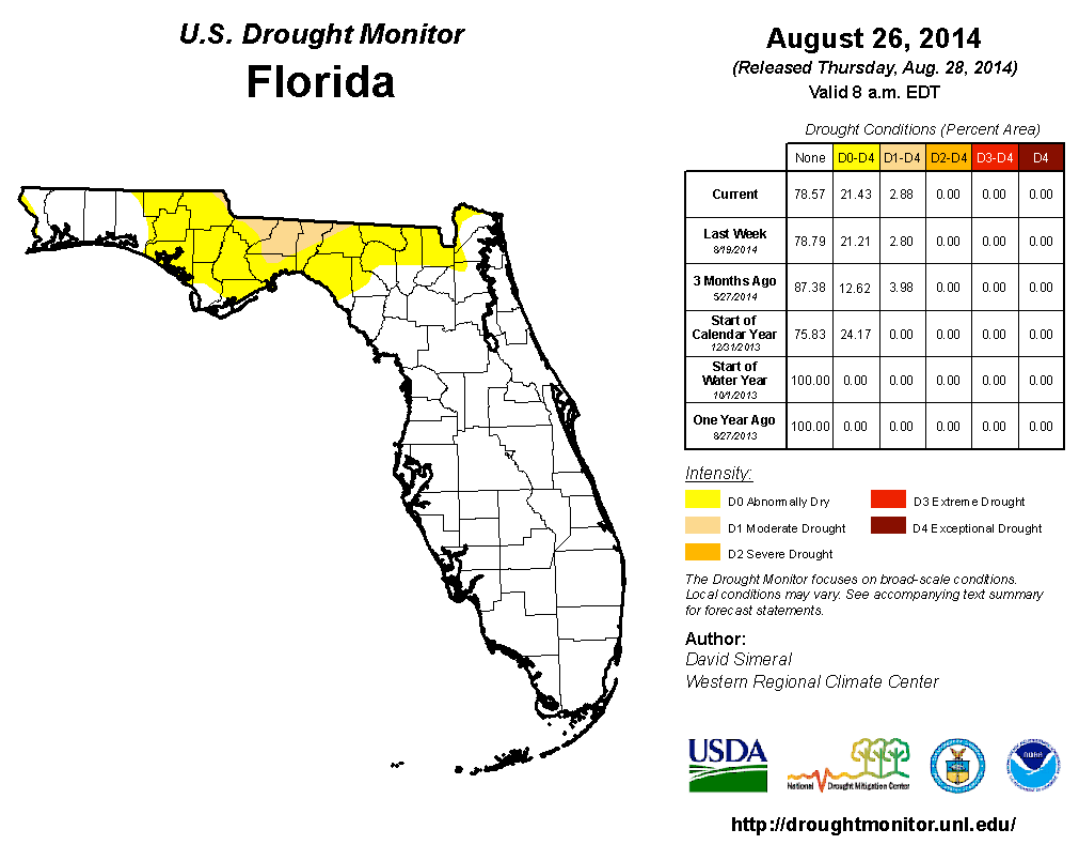
The state started the month of August with abnormally dry conditions (D0) shown for most of the Big Bend and Panhandle counties after 3-months of below normal precipitation had been observed. Tallahassee reported its driest summer on record (back to 1893) with more than 12.00” below normal rainfall for the June, July and August, and Jacksonville reported its 7th driest summer on record (more than 8.00” below normal). The lack of rainfall in the northern part of the state lead to deteriorating conditions in portions of Gadsden, Jefferson, Leon and Wakulla counties were moderate (D1) drought conditions were introduced. The area of D0 in Panhandle and Big Bend expanded east, to portions of the Suwannee River watershed. In the Peninsula, the summer rains, while less than normal, inhibited any southward expansion of dryness during the month and Miami area reported its second wettest summer on record (over 14.00” above normal). The water levels in Lake Okeechobee were currently at 14.53 ft., which is up from the end of June, but below the lake level at this time last year (2013).
Appendix 1: Additional August departures from normal data for Florida locations.
Appendix 2: Select daily maximum and minimum temperature records (° F) tied or broken during August (compiled from NOAA, NWS).
Prepared by Melissa Griffin and David F. Zierden.
Florida Climate Center
The Florida State University
Tallahassee, FL
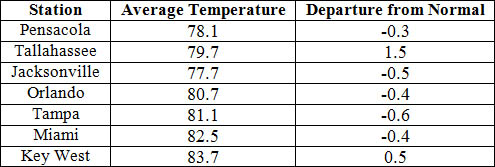
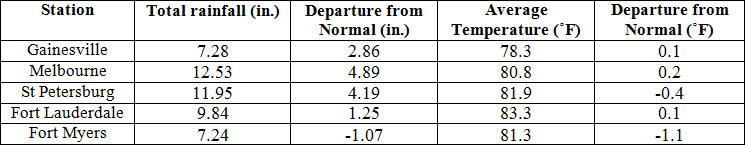
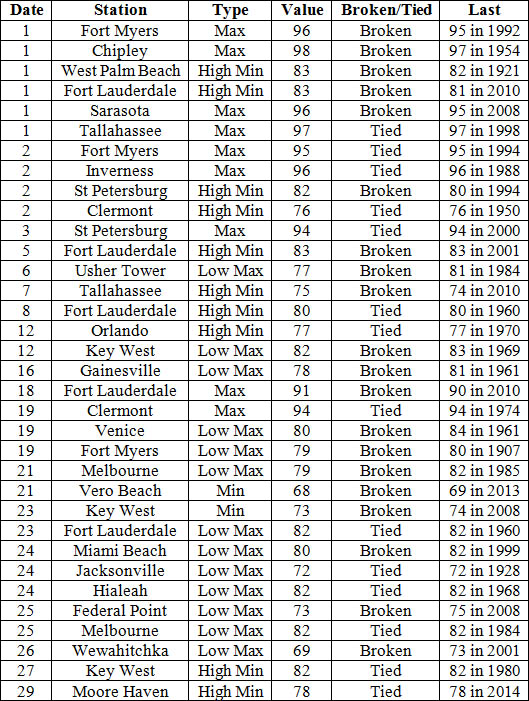
Average temperatures varied across the state in September. The departures for average temperatures in September 2014 varied across the entire state, though most of the reporting stations saw average temperatures near normal. The departures ranged from -1.1˚F in Fort Myers to 1.5˚F at Tallahassee. (Table 1 and Appendix 1). Chipley reported 98˚F on the 1st, the highest temperature in Florida for the month; while the lowest minimum temperature recorded in the state was 56˚F in Crestview on the 26th. Of interest this month was the cool temperatures that impacted portions of the Panhandle on the 25th and 26th, with multiple locations struggling to get to a high of 70˚F. Despite the fall like weather, many stations saw at least on day of maximum temperatures at or above 90˚F. Multiple temperature records were tied or broken across the state in September (Appendix 2).
Table 1: September average temperatures and departures from normal (˚F) for selected cities.
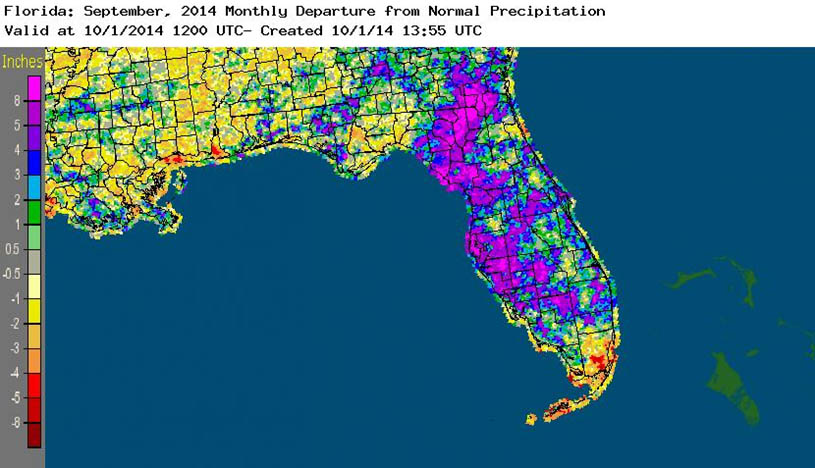
Rainfall totals varied across the state in September. Portions of the Florida Peninsula reported monthly rainfall totals well above normal, while most of the rest of Florida saw below average rainfall during September (Figure 1). Departures from normal roughly ranged from -2.61” to 4.89” (Table 2 and Appendix 1), though localized parts of Florida saw rainfall totals that were as much as 5.00” below normal to over 8.00” above normal (Figure 1). September 2014 was the wettest in Daytona Beach (18.51”) in the 91 years records have been kept at the station. Miami, West Palm Beach and Vero Beach all reported 22 days in the month with measurable (>=0.01”) rainfall; while Orlando had 20 days, Fort Myers had 19 days and Tampa recorded 16 days during September. There were multiple 24-hour precipitation records broken for the month (Table 3).
Table 2: September precipitation totals and departures from normal (inches) for select cities.
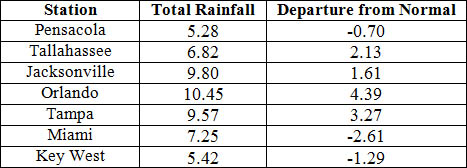
Table 3: Select daily rainfall records (inches) broken during September (compiled from NOAA, NWS).
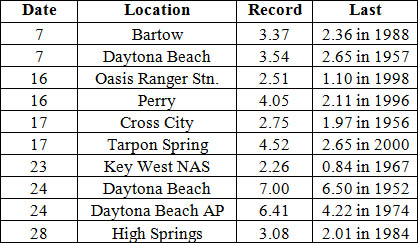
Figure 1: A graphical depiction of the monthly rainfall departure from normal (inches) for September is given in the figure below (courtesy of NOAA, NWS).
ENSO-Neutral Conditions Continue in the Pacific.
Based on current data and forecast models, the Climate Prediction Center (CPC) continue to have an El Niño Watch in place. Though Neutral ENSO conditions continue to be reported, though positive sea surface temperatures (SST) anomalies have been recorded across the entire Pacific Ocean. The chances of an El Niño event have decreased to about 60 – 65% during the Northern Hemisphere fall and early winter. CPC predicts above normal temperatures and above normal precipitation across the state through December 2014.
Hazardous Weather Events in September.
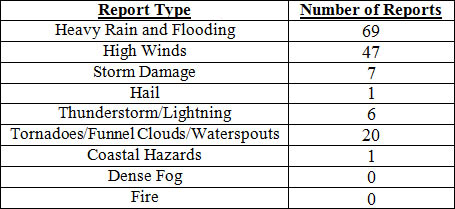
There were a total of 151 severe weather reports made in Florida during September. On Labor Day, September 1st, a 65-year old male from Louisiana drowned after he was pulled out into the Gulf of Mexico by rip currents in Navarre, FL. On the evening of the 1st, multiple reports of a funnel cloud and waterspout were made by spotters and the general public in the Tampa area. Heavy rains and high winds were reported at numerous locations near the Space Coast on the 5th, while heavy rains on the 6th, over 10” in 24-hours, caused a retention pond failure in Lake City that resulted in several homes to be flooded. Also on the 6th, a landscape worked was injured after being struck by lightning in Cooper City, FL. Additional rainfall on the 7th exacerbated flooding problems in Lake City, as many streets became impassable and residents in some neighborhoods used canoes and kayaks to evacuate. Lightning started a house fire near Pensacola, FL on the 8th. On the 9th, a spotter reported a well-formed waterspout near Islamorada, which lasted for more than 10 minutes and another waterspout was reported in Tampa Bay, near MacDill AFB, on the 11th. From the 13th – 14th, high winds (gusts to 50 mph), reports of funnel clouds and heavy rains were seen along the Florida Keys, and portions of the Gold Coast as a Tropical Wave impacted the area. The public reported several large waterspouts near Santa Rosa Sound and Navarre Beach, and heavy rains were recorded in Jacksonville and Vernon, FL on the 16th. Thunderstorms on the evening of the 18th knocked down power lines and trees in Marion and Putnam counties. A vigorous cold front moved through the northern part of the state on the 21st, before stalling out in central Florida. The stationary front remained in place across the peninsula until the 27th, when a new stationary front formed along the Big Bend and stayed put through the end of the month. During this time, there were multiple reports of high winds, heavy rains and flooding across the Peninsula. Areas around Miami, Palm Coast and Tampa were especially hard hit with torrential rains. Tampa recorded the same amount of rain, if not more, in the two-week period from September 14th – 27th, than was seen during the summer (June 1st – August 31st).
Table 4: Breakdown of storm reports submitted in Florida during the month of September (Compiled from Southeast Regional Climate Center.)
Agricultural and other climate related impacts.
At the beginning of September, topsoil and subsoil moisture levels across the state were running more than 68% adequate and about 16% at surplus. Drought conditions were placing stress on corn, soybeans, and peanuts in the Panhandle, and Armyworms were still a problem in the same area. Peanut conditions were mainly fair (31%) to good (56%), as hay, corn, soybeans and peanuts were being harvested. Palm Beach County began prepping fields for sugarcane planting. Cattle were stressed from the temperatures, with daytime highs in the mid to upper 90s. Cotton in the northern part of the state was in fair condition, though some fields showed signs of disease. By mid-month, spotted wilt was reported on peanuts in Santa Rosa County and the peanut/cotton crops were delayed due to drought and pest pressure. Pastures in Santa Rosa and Washington counties showed signs of drought stress, and pastures in southwest Florida began to decline seasonally as grasses matured. Areas in southwest Florida prepared land for planting of fall vegetables. At month’s end, soil moisture levels were up, though areas in the northern part of the state were still dealing with drought conditions. Stem maggots had taken over, while the Armyworms were gone. Peanut quality declined due to weather, disease and pest. Some south Florida fields were under water and planting of fall vegetables had been disrupted. The citrus area had received widespread rain throughout the month, and growers were mowing, irrigating, and treating trees with greening and caring for resets on next season’s crop.
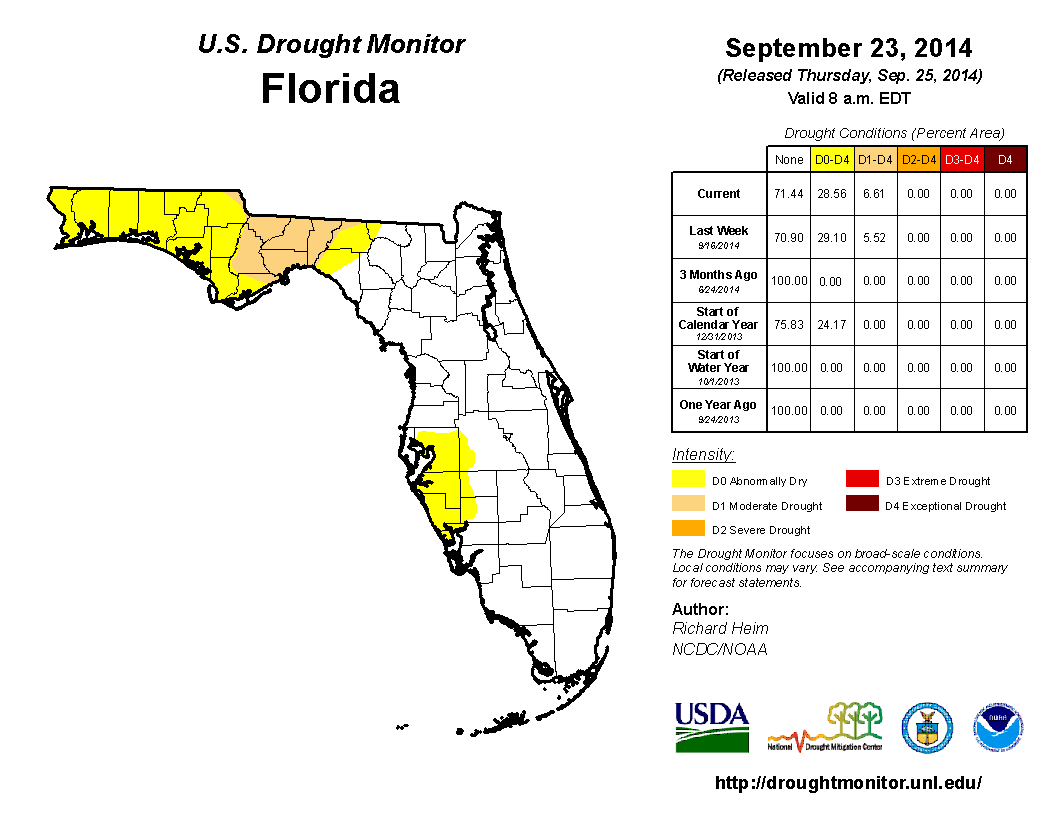
Due to the lack of rainfall through August, deteriorating conditions in portions of Gadsden, Jefferson, Leon and Wakulla counties prompted moderate (D1) drought conditions to be introduced, while the area of abnormally dry (D0) conditions in Panhandle and Big Bend grew to portions of the Suwannee River watershed. After the first week in September, that area of D0 was expanded to cover all of the counties in the western Panhandle, and D1 was mentioned in Madison and Taylor counties. The lack of summer rains along the west coast caused the D0 to be introduced into portions of Hillsborough, Manatee, Pinellas, and Sarasota counties and by mid-month this area of D0 was increased into western Desoto, Hardee and Polk counties. Some rainfall in North Florida eased the dry conditions in Baker, Columbia, Hamilton, and Nassau counties. By the end of the month, D1 conditions had been removed from eastern Big Bend counties (Madison and Taylor counties) but introduced in Franklin, Jackson and Liberty counties, and rainfall late in the month will prompt the removal of the dry conditions from the west coast and central Florida. Rainfall across the peninsula kept drought conditions in check during the month of September and Lake Okeechobee reported a lake level above 15 ft., well within normal range.
Appendix 1: Additional September departures from normal data for Florida locations.
Appendix 2: Select daily maximum and minimum temperature records (° F) tied or broken during September (compiled from NOAA, NWS).
Prepared by Melissa Griffin and David F. Zierden.
Florida Climate Center
The Florida State University
Tallahassee, FL
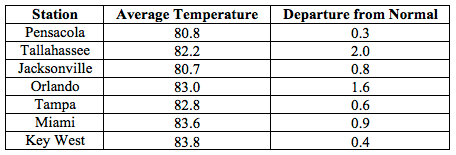
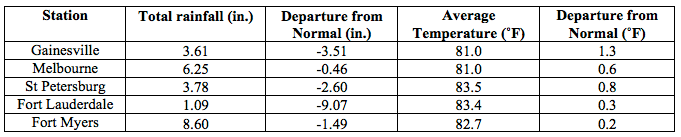
Average temperatures were above normal across most of the state in June. The departures from average temperatures in June 2015 were near normal to above normal across the entire state, ranging from 0.2˚F in Fort Myers to 2.0˚F in Tallahassee (Table 1 and Appendix 1). Most locations across the state reported at least one day with a maximum temperature at or above 90˚F. Crestview recorded 10 consecutive days with maximum temperatures of 95˚F. Orlando recorded its first 100˚F temperature in 17 years on the 19th. June 2015 was the 3rd warmest in Vero Beach, 6th warmest in West Palm Beach, and 7th warmest in Orlando and Miami, and the 10th warmest in Daytona Beach and Tallahassee. Multiple maximum and high minimum temperature records were tied or broken across the state in June (Appendix 2).
Table 1: June average temperatures and departures from normal (inches) for select cities.
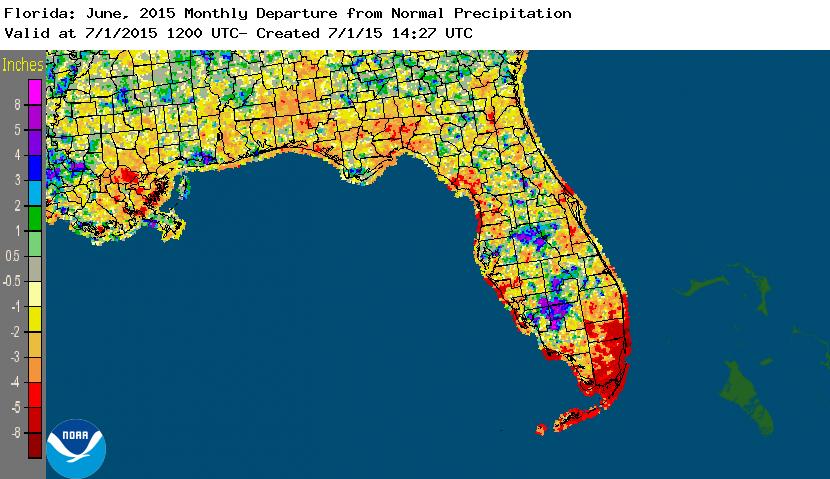
Rainfall totals varied across the state in June.With the exception of some interior portions of the Peninsula, especially around Polk County and counties east of Lake Okeechobee, the majority of the state had rainfall totals below normal (Figure 1). Departures from normal roughly ranged from -9.07” to -0.13” (Table 2 and Appendix 1), though localized parts of the state saw rainfall totals that were as much as 8.00” below normal to 8.00” above normal (Figure 1). There were multiple 24-hour precipitation records broken for the month (Table 3).
Table 2: June precipitation totals and departures from normal (inches) for select cities.
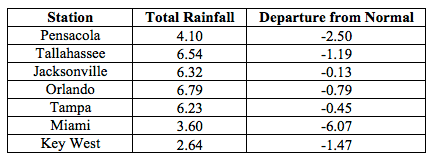
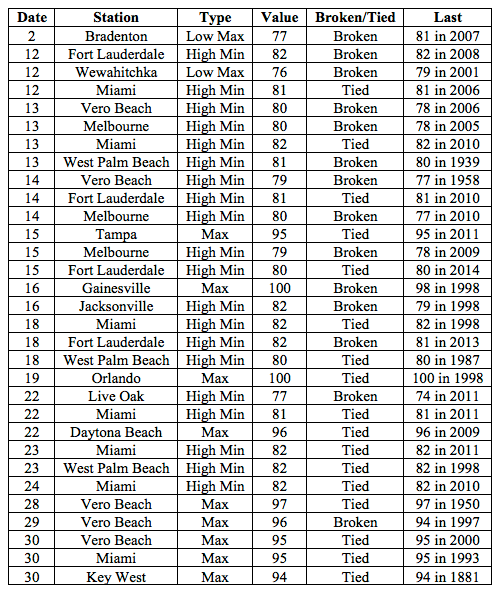
Table 3: Select daily rainfall records (inches) broken during June (compiled from NOAA, NWS).
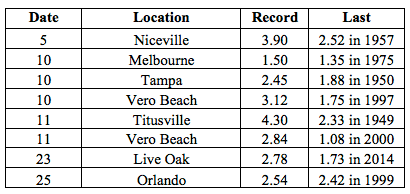
Figure 1: A graphical depiction of the monthly rainfall departure from normal (inches) for June is given in the figure below (courtesy of NOAA, NWS).
ENSO-neutral conditions continue in the Pacific. Based on current data and forecast models, the Climate Prediction Center (CPC) decided to continue the El Niño Advisory. El Niño conditions are present, and positive equatorial sea surface temperatures (SST) anomalies continue across most of the Pacific Ocean. There is approximately a 90% chance that El Niño conditions will continue through fall 2015, and a greater than 80% chance it will last through the remainder of 2015. CPC predicts above normal temperatures and below precipitation across the state through September 2015.
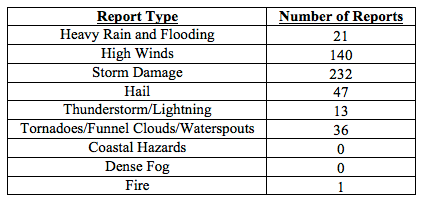
Hazardous weather events in June. There were a total of 490 severe weather reports made in Florida during June. On June 4th, a 10-acre wildfire was reported near the vicinity of Pomona Park in Putnam County. An 11-year old boy was injured after being struck by lightning while fishing in waist deep ocean waters off the coast of Daytona Beach Shores on the 9th. St. Johns County Emergency Management reported a tornado in Elkton, FL on June 10th. The tornado was rated EF-0 and destroyed a potato field, a shed and damaged a metal structure. On the same day, heavy rains (around 3.50”) caused multiple reports of flooding in downtown Tampa. A tornadic circulation caused damage in the Tequesta, FL (Palm Beach County) area also on the 10th. On the 19th, an 81-year old man was struck and killed by lightning as he was walking around in his front yard in Clearwater, FL (Pinellas County). Lightning caused a structure fire on the 21st in Duval County, near the campus of the University of North Florida. Two structural fires were caused by lightning on the 22nd, the first fire destroyed a mobile home in Lake City, FL (Columbia County) and the second in Naples, FL (Collier County) did $2 million in damages and a firefighter was injured when the second floor of the building collapsed. A tractor-trailer was struck by lightning on the 23rd, while traveling along Interstate 75 near Reddick, FL (Marion County). On the 24th, lightning started an early morning house fire in Gulf Breeze, FL (Escambia County) and a structural fire later that afternoon in Lowell, FL (Marion County). Lightning may be responsible for the death of a 25-year old man, who was working on the roof of a home in Port Orange, FL (Volusia County) on the 26th. A swimmer was indirectly struck by lightning on the 27th while standing in ankle deep water in Crescent Beach, FL (St. Johns County). Various convective and sea breeze thunderstorms caused hail, high winds, storm damage and heavy rains across the state during the entire month of June.
Table 4: Breakdown of storm reports submitted in Florida during June (compiled from Southeast Regional Climate Center).
Agriculture Related Impacts.At the beginning of June, topsoil moisture levels were at mainly short to adequate across the state. Heavy rains at the start of the month slowed planting of peanuts, cotton and soybeans in the Panhandle. Wheat was harvested in Jackson County, while areas of the Big Bend and counties around Orlando started haying in the drier conditions. Peanut conditions were mainly fair to good, which was a decrease in conditions from last year’s crop. In southwest Florida, the growing season for fruits and vegetables was over. Due to the continued dry conditions and warm temperature, heavy use of irrigation was seen across Florida throughout the month, especially in the citrus areas. The lack of rains as the month progressed aided in planting of crops in the Panhandle, but deteriorated pasture conditions in North Florida. Warm temperatures during the middle of the month caused added stress on livestock. Sugarcane and rice were developing in south Florida counties, though localized fields needed excess water to be pumped due to heavy rain at the end of the month. Late season orange harvesting had come to an end and all of the packinghouses were closed, as growers began focusing on next season’s crop.
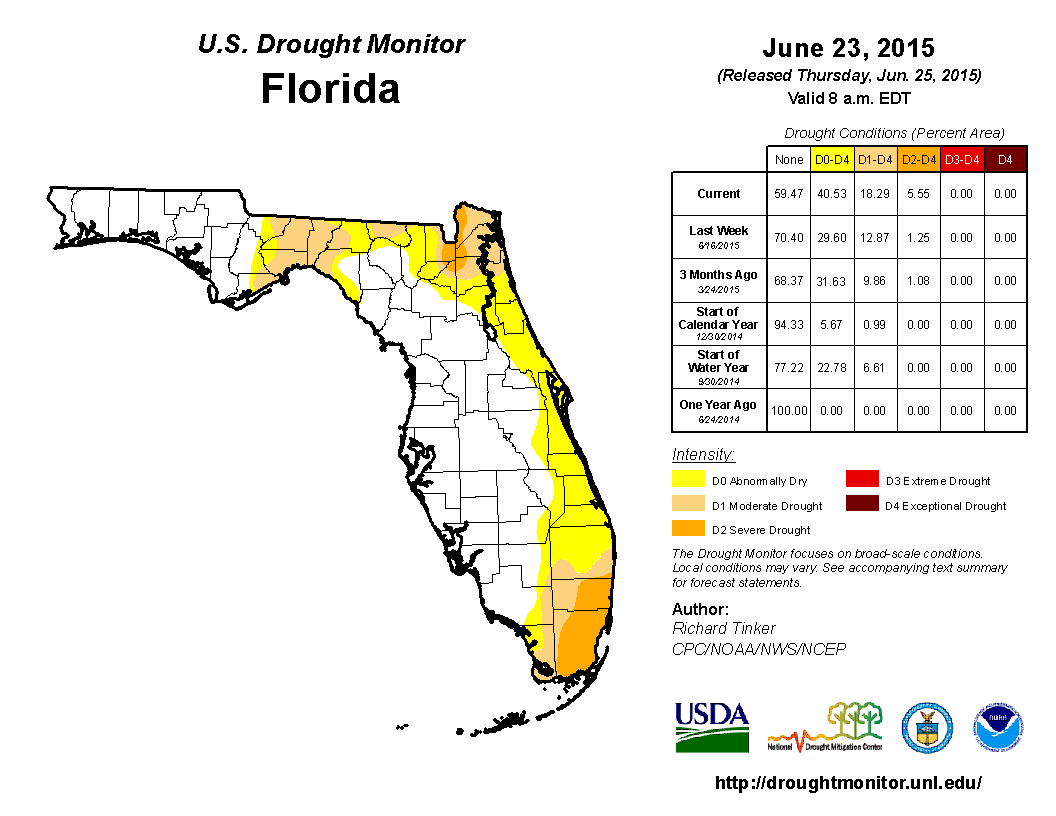
Drought Related Impacts.At the end of May, nearly 13% of the state was experiencing abnormally dry (D0) conditions, mainly concentrated in portions of northeastern and southern Florida. As June progressed, the lack of rain and warm temperatures did little to ease drought conditions. The area of D0 along with portions of the moderate drought (D1) in South Florida expanded and severe drought (D2) was introduced into Dade County. By the middle of June, the area of D0 expanded from the northeastern portions of the state (near Jacksonville) into the Big Bend, and with the continued below normal precipitation in that area, D1 was introduced. The June 23rd release of the Drought Monitor introduced D2 in part of the Lower St. Johns and Nassau/St. Mary’s river basins. In addition, the eastern coast of the state, from Nassau County to the Keys, has now been classified as experiencing at least D0 drought conditions. The area of D2 conditions in the southern part of the state expanded outside of Dade County and is now being observed in Broward County. Based on census data, roughly 6 million Florida citizens are currently being impacted by drought conditions reported in nearly 41% of the state. At the end of the month, the water level in Lake Okeechobee had dropped to just over 12 ft., mainly due to lack of rainfall across the basin.
Figure 2: Drought conditions in Florida as of June 24, 2014 (courtesy of U.S. Drought Monitor).
Appendix 1: Additional June departures from normal data for Florida locations.
Building A, Suite 292
Tallahassee, FL 32306-2741
Phone: (850) 644-3417 | (850) 644-0719
climate@coaps.fsu.edu