
CENTER FOR OCEAN-ATMOSPHERIC PREDICTION STUDIES
THE FLORIDA STATE UNIVERSITY
TALLAHASSEE, FL, 32306, USA
DIRECTOR: DR. JAMES J. O’BRIEN
REGIONAL EFFECTS OF ENSO ON U.S. HURRICANE LANDFALLS
By
CARISSA A. TARTAGLIONE
DEBORAH E. HANLEY
JAMES J. O’BRIEN
SHAWN R. SMITH
AUGUST 2002
TECHNICAL REPORT
2002-5
TABLE OF CONTENTS
FOREWORD
This is the MS thesis of Carissa Tartaglione. She now works at NOAA/NCDC. The research here is one of a series of papers on ENSO Impacts on the United States. We discovered these findings by serendipity.
The results are important. All regions of the US coast have an El Niño signal (less hurricanes). All regions have a La Niña signal (more hurricanes). On the Gulf Coast and Florida, La Niña and Neutral have the same signal. Along the East Coast of the U.S., the Neutral probability curve collapses on the El Niño curve. This means that during 75 percent of years, the East Coast has a reduced probability of hurricane landfall.
James J. O'Brien
Robert O. Lawton Distinguisded Professor
Meteorology and Oceanography
ABSTRACT
The effects of El Niño-Southern Oscillation on hurricane activity in the Atlantic Basin as a whole have been well established. It is known that El Niño suppresses hurricane activity while La Niña enhances it. Regional differences in the impact of El Niño/La Niña on hurricane landfalls have been observed in the Caribbean. The present study focuses on regional differences in the impact of ENSO on hurricane landfalls in the United States.
Hurricane landfall frequencies for Florida and the U.S. East Coast (Georgia to Maine) for El Niño, neutral, and La Niña years are presented. An increase compared to neutral years in Florida landfalling hurricanes for La Niña years is not observed; however, there are more hurricanes making landfall in Florida than along the East Coast during neutral years. Results for the Gulf Coast (Alabama through Texas) are nearly identical to those for Florida. La Niña appears to only increase hurricane landfall activity relative to neutral years from Georgia northward in the United States.
Most previous ENSO impact studies have shown differences in hurricane activity between El Niño , neutral, and La Niña phases. In this study, differences are only observed in one out of the three phases. Along the East Coast, the effects of the El Niño and neutral phases are essentially the same, such that the scenario becomes El Niño/neutral vs. La Niña. Along the coasts of the Gulf of Mexico and Florida, there is a similar scenario. In this case, the effects of the La Niña and neutral phases are nearly identical, creating a La Niña/neutral vs. El Niño scenario.
Examination of the origin points and tracks of landfalling hurricanes for both regions are examined and results show that storms making landfall along the East Coast are more likely to form in the central Atlantic while those that make landfall in Florida usually form further west, in the Caribbean and the Gulf of Mexico. Also, there are fewer storms forming in the neutral phase in the usual origin regions for East Coast landfalling hurricanes than there are in the cold phase. Possible explanations for the regional variation in the impact of ENSO on hurricane landfalls, such as the North Atlantic Oscillation and steering patterns, are suggested.
1
1. INTRODUCTION
Atlantic basin hurricane activity has doubled between 1995 and 2000, as compared to the preceding 24 years (Goldenberg et al. 2001). With the recent increase in Atlantic hurricane activity, growing coastal population, and the expected persistence of this trend, the need arises for a better understanding of the factors that influence hurricane activity. Numerous studies have investigated the role of various factors on hurricane activity in the North Atlantic; however, little focus has been placed on these influences regionally. Such information would be useful to many government agencies such as the Federal Emergency Management Agency (FEMA) for disaster relief planning.
The impact of El Niño-Southern Oscillation (ENSO) on hurricane activity has been well documented. Gray (1984) showed that El Niño conditions reduce hurricane activity in the North Atlantic basin. There are numerous characteristics of El Niño conditions that Gray attributed to the suppression of tropical cyclone activity. More discussion of these factors will be presented in Section 2.
Conversely, Gray (1984) and others have acknowledged that La Niña conditions, which are accompanied by weaker upper level westerlies and reduced vertical wind shear, tend to increase hurricane activity. Studies by Richards and O’Brien (1996) and Bove et al. (1998) agree with Gray’s observations, showing a decrease (increase) in hurricane landfall probabilities in the United States during El Niño (La Niña) events.
The study by Bove et al. (1998) revealed that the mean number of hurricanes to make landfall in the U.S. annually was 1.04 during El Niño years, 1.61 during neutral years, and 2.23 during La Niña years. It was also found that the probability of two or more hurricanes making landfall in the U.S. was 28% during El Niño, 48% during the neutral phase, and 66% during La Niña. The analysis by Bove et al. (1998) focused only on hurricane landfall probabilities for the United States as a whole and did not examine hurricane landfalls for the United States on a regional scale.
Tartaglione et al. (2002) have observed regional differences in the effects of ENSO on hurricane landfalls in the Caribbean. It was found that El Niño decreases hurricane landfall activity relative to the neutral phase for the entire Caribbean region. However, there were no differences observed in hurricane landfall probabilities between the El Niño and neutral phases in the East and West Caribbean.
It has been proven that large-scale circulation patterns produce different impacts regionally. A regional difference in the impact of ENSO on hurricane activity has been observed in the Caribbean. To date, there have been no studies that have determined the regional effects of ENSO phases on hurricane activity in the United States.
In this paper, hurricane landfall probabilities are calculated for Florida and the East Coast separately and the regional impact of ENSO in the U.S. is evaluated. Only landfalling hurricanes are considered for the following two reasons. First, the record of hurricane landfalls is more accurate than the record of all hurricanes. This is due to the fact that prior to the deployment of satellites in the 1960’s, open ocean hurricanes were more difficult to track and may not have been identified if they failed to hit land. Also, landfalling hurricanes are of more interest to the public because they have a direct impact on lives and property. For this study, only hurricane strength storms (those which make landfall with winds greater than or equal to 64 kts) are considered.
The number of hurricane landfalls in Florida and along the East Coast is determined for each year between 1900 and 1998 using the Atlantic Basin Best Track dataset provided by the National Hurricane Center and National Climatic Data Center (Neumann et al. 1993). Probabilities of hurricane landfalls for each region are evaluated for the warm (El Niño), neutral, and cold (La Niña) phases of ENSO. The origin points and tracks of Florida and East Coast landfalling hurricanes are also identified for each ENSO phase.
The analysis presented shows an increase in the probability of hurricane landfalls along the East Coast during La Niña years relative to neutral years. Surprisingly, there is virtually no difference in the number of Florida landfalling hurricanes during La Niña and neutral years is observed. Results found for the Gulf of Mexico were nearly identical to those for Florida. During La Niña, the average number of East Coast and Florida landfalling hurricanes is almost the same. Since the decrease in hurricane activity during El Niño is well-documented (Gray 1984) and noted in both study regions, this work will focus only on the La Niña and neutral phases from here on. The goals of this study are to examine regional differences in the impacts of ENSO on U.S. hurricane landfalls and to determine why there are fewer hurricane landfalls along the East Coast than in Florida during neutral years.
A detailed background including climate impacts, genesis mechanisms, and steering influences will be discussed in Section 2. The methodology will be presented in Section 3. Results are discussed in Section 4. Finally, a conclusion will be presented in Section 5.
2. BACKGROUND
a. Climate Impacts
The main factor Gray (1984) credited for the suppression of tropical cyclone development in the North Atlantic is an anomalous increase in the upper level westerly wind anomalies over the equatorial Atlantic and Caribbean Sea that is brought on by El Niño. More deep cumulus convection has been observed to be present during El Niño years (Gray 1984). This results in stronger upper level outflow, decreasing upper level anticyclonic flow, and further enhancing the westerlies. Since 200hPa winds must be easterly from 0º-15ºN and westerly from 20º-30ºN for conditions to be favorable for large numbers of tropical cyclones to form (Gray 1984), the conditions brought on by El Niño are unfavorable for hurricane development. The increase in upper level westerlies during El Niño results in increased vertical wind shear, which is known to suppress tropical cyclone formation and growth (Gray 1968). It is estimated that the upper tropospheric winds are anywhere from 2-7ms-1 more westerly during El Niño years than during non-El Niño years.
Gray (1984) also found that El Niño affected precipitation in the Caribbean very little. This suggests that tropical disturbances still exist during El Niño years; however, they are not developing into tropical cyclones. Thus, it is not a reduction in the amount of disturbances occurring that is brought on by El Niño, but unfavorable conditions for development which suppresses hurricane activity.
b. Tropical Cyclone Formation
The meteorological community has yet to come to an agreement on the physical mechanisms that lead to tropical cyclone development. This is largely due to the lack of upper-air observations available over the open ocean. Such a lack of observations hinders the development of a proper understanding of the factors that are responsible for tropical cyclone formation.
Although there is not a consensus on what exactly causes the development of tropical cyclones, several factors are widely accepted to be crucial to tropical cyclone genesis. There is a requirement for a pre-existing disturbance. Initial disturbances often arise from low level convergence coupled with upper tropospheric divergence and an increase in the mean tropospheric temperature (Gray 1968; Montgomery and Farrell 1993). The presence of a Tropical Upper Tropospheric Trough (TUTT) has also been identified as an influence on the development of tropical disturbances (Gray 1998; Montgomery and Farrell 1993). The TUTT acts to create upper level divergence and reduce vertical wind shear (Gray 1998).
Another key parameter established for tropical cyclone development is weak vertical wind shear (Gray 1968, 1998; Shapiro and Goldenberg 1998). The concentration of heat and condensation within a disturbance are hindered by strong vertical shear. Instead, the heat and condensation necessary for development are advected away from the disturbance (Gray, 1968). Thus, strong vertical wind shear does not allow for tropical cyclone formation.
The presence of low level relative vorticity (zr) has also been identified as a key factor in tropical cyclone genesis. In conjunction with a pre-existing disturbance, low level relative vorticity acts to enhance development. In fact, Weak vertical wind shear and large values of low level relative vorticity are listed by Gray (1998) as the two most influential factors in the development of tropical cyclones from existing disturbances.
Sea surface temperatures (SSTs) also play an important role in tropical cyclone formation. Palmen (1948) established that sea surface temperatures of 26.5ºC or higher are necessary for tropical cyclone genesis. This value has become widely accepted as a threshold. Shapiro and Goldenberg (1998) acknowledge the importance of decreased vertical wind shear, but indicate that hurricanes rarely develop if SSTs are below this value. Furthermore, Shapiro and Goldenberg (1998) stress that higher sea surface temperatures in the Atlantic are associated with above average tropical cyclone formation. The results of DeMaria et al. (2001) agree with the findings of Shapiro and Goldenberg (1998) that higher SST’s result in more tropical cyclones.
Various indices have been developed in an effort to predict tropical cyclone genesis. While many of these indices include similar factors, they all vary to some degree. Ward (1995) developed a parameter based on SST, vorticity, and tropospheric vertical shear. DeMaria et al. (2001) established a parameter using vertical shear, vertical instability, and mid-level moisture. They determined that early season tropical cyclone formation is limited most by vertical instability and mid-level moisture while late season formation is restricted more by vertical shear. DeMaria et al. (1998) also found these three parameters to be favorable for tropical cyclone development from the middle of July through the middle of October, which coincides with the peak of Atlantic hurricane activity.
Montgomery and Farrell (1993) noted that convective available potential energy present in moist convective cloud systems is an important source of energy for hurricanes. Upper level potential vorticity increases instability, thus they suggested that upper-level potential vorticity anomalies could initiate the formation of tropical cyclones. Montgomery and Farrell (1993) also identified tropical cyclone development as a result of the interaction between an easterly moving disturbance at lower levels and a westerly moving upper-level trough.
A more extensive index was established by Gray (1998) and is based on six factors which are seasonally averaged. These six factors are the Coriolis parameter, low level relative vorticity, the inverse of tropospheric vertical wind shear, ocean thermal energy (related to SST), the difference in the equivalent potential temperature between the surface and 500hPa (Dqe), and mid-tropospheric relative humidity. The "seasonal genesis parameter" is a product of what Gray refers to as the dynamic potential and the thermal potential. The dynamic potential is the product of the Coriolis parameter, the low level zr, and the inverse vertical wind shear. The thermal potential is the product of the ocean thermal energy, Dqe, and the relative humidity. Gray (1998) uses this seasonal genesis parameter to predict tropical cyclone formation.
It should also be noted that Shapiro and Goldenberg (1998) indicated the area from 10ºN-20ºN latitude to be the "main development region" in the Atlantic hurricane basin. This agrees with the results found by Gray (1968). However, Gray (1968) observed that the main regions of development in the North Atlantic exhibit a seasonal shift. The findings presented in this paper coincide with the results of Gray (1968) and Shapiro and Goldenberg (1998).
c. Tropical Cyclone Steering
Much like the case of tropical cyclone formation, little is understood about the conditions and mechanisms that control the movement of tropical cyclones. Once again, the lack of upper-air data presents a problem. Without adequate observations, it becomes difficult to identify what exactly controls the path that tropical cyclones take. Unfortunately, this lack of understanding manifests itself as a lack of agreement as to which factors steer tropical cyclones.
Many studies identified steering flow by a pressure averaged wind field. Most often, the middle tropospheric steering flows are used to predict the motion of tropical cyclones (Kasahara, 1959; Chan and Gray, 1982; Carr and Elsberry, 1990). It has also been noted by Kasahara (1959) that the position of the West Atlantic subtropical high plays a role in tropical cyclone movement.
Kasahara (1959) determined steering flow by solving the barotropic nondivergent vorticity equation. After establishing the steering flow, hurricane tracks were forecasted using an equation that included the interaction between the hurricane and the steering flow. Results showed that both the 500hPa and 700hPa flows predicted tropical cyclone paths rather well. Based on these results, Kasahara (1959) suggested that a vector mean of the 500hPa and 700hPa steering flow be used in forecasting the motion of tropical cyclones.
Carr and Elsberry (1990) found that tropical cyclones in the Northern Hemisphere that were moving westward had the tendency to move faster and to the left of the steering flow. They also noted that the motion of the tropical cyclone relative to the steering flow, referred to as propagation, was induced by b and depended on the strength of the outer winds of the tropical cyclone. In this study, it was suggested that a standardized steering flow be defined as the 850-300hPa pressure weighted wind over a 5º-7º latitude radius from the storm center.
Chan and Gray (1982) provided an extensive study of the relationship between tropical cyclone motion and environmental steering. In this study, tropical cyclones were stratified by direction and speed of motion, latitude, intensity change, and size. Steering flow was analyzed at various pressure levels and radii. The results showed that the 500-700hPa winds at a 5º-7º radius from the center of the storm were best correlated with tropical cyclone movement. It was observed that in the Northern Hemisphere, tropical cyclones move about 10º-20º to the left of the surrounding mid-tropospheric flow at a 5º-7º radius. Chan and Gray (1982) also found that tropical cyclones generally travel about 1 ms-1 faster than the surrounding flow. Although Chan and Gray (1982) found that the 500-700mb steering flow best determined tropical cyclone path, they note that the steering level that best indicates the movement of each tropical cyclone is influenced by vertical wind shear.
There are also factors that can complicate the prediction of tropical cyclone steering. Trough interactions may affect the track of a tropical cyclone (Hanley et al. 2001). The position of an upper-level trough can play a role in the direction that a tropical cyclone will move. Also, tropical cyclones are known to modify their own environment. These modifications can make it difficult to predict steering.
If the physical mechanisms that control hurricane formation and movement are known, they can be compared to the conditions associated with El Niño, neutral, and La Niña ENSO phases. A better understanding of tropical cyclone genesis and steering may provide an explanation of the regional variations in U.S. hurricane landfall activity.
3. METHODOLOGY
The Atlantic Basin Best Track dataset (Neumann et al. 1993) is used to determine hurricane landfalls. The Best Track dataset is composed of six-hourly observations (0Z, 6Z, 12Z, and 18Z) of storm center position, wind speed in knots, and pressure in millibars. A "landfalling" hurricane is defined as a storm that made at least one Florida, Gulf Coast, or East Coast landfall with winds greater than or equal to 64 kts. Once landfalling hurricanes are identified, each storm is then categorized as occurring during the onset summer of a warm, cold, or neutral ENSO year defined in Appendix A.
Hurricane landfall probabilities are determined using an inverse cumulative frequency distribution (IFCD). The IFCDs, also known as exceedence, show the probability that a certain number of hurricanes or more will make landfall during a particular ENSO phase. IFCDs are calculated for Florida, Gulf Coast, and East Coast landfalls. These regions are described in Appendix A.
Track plots are constructed using the storm center positions found in the Best Track data. These are separated by ENSO phase for the East Coast and Florida landfalling hurricanes. When "formation regions" are discussed, origin points are determined by the first position that is listed in the Best Track data for each storm. The first position marks the time that a named storm is identified as a tropical depression or stronger.
Monthly means of 1000, 850, 500, and 250hPa heights and winds as well as sea level pressure and SST fields are composited for cold and neutral hurricane seasons using the NCEP/NCAR Reanalysis Data (provided by the NOAA-CIRES Climate Diagnostics Center, Boulder, Colorado, from their website at http://www.cdc.noaa.gov/ ).
In addition to ENSO, the North Atlantic Oscillation (NAO) has been investigated for possible climate impacts on hurricanes. Tracks of major U.S. hurricanes were identified and correlated with phases of the NAO by Elsner et al. (2000). This study found that major hurricane activity at high and low latitudes are inversely related. Above normal activity at low latitudes was found to occur when activity at high latitudes were below normal and vice versa. This inverse relationship in major hurricane activity across latitudes was then related to phases of the NAO. Elsner et al. (2000) found that the Gulf Coast was more likely to see a major hurricane strike during a relaxed NAO while the East Coast was more likely to see a major hurricane strike during an excited NAO. In this work, the years of East Coast landfalls and Florida landfalls are also classified according to North Atlantic Oscillation (NAO) phase (Tables 1 and 2).
Table 1. Years in which one or more hurricanes made landfall along the East Coast, classified by positive or negative NAO phase.
|
Positive NAO Phase |
Negative NAO Phase
1920
1901
1928
1933
1953
1936
1959
1947
1979
1952
1984
1960
1989
1985
1993
1996
Table 2. Years in which one or more hurricanes made landfall in Florida, classified by positive or negative NAO phase.
|
Positive NAO Phase |
Negative NAO Phase |
|
1919 |
1915 |
|
1921 |
1917 |
|
1926 |
1933 |
|
1928 |
1936 |
|
1935 |
1939 |
|
1945 |
1941 |
|
1946 |
1947 |
|
1948 |
1960 |
|
1950 |
1966 |
|
1953 |
1968 |
|
1979 |
1985 |
|
1992 |
1995 |
4. RESULTS
Between 1900 and 1998, a total of 60 hurricanes made landfall in Florida. Of those 60, 18 occurred during the 23 cold events, 6 made landfall during the 22 warm events and 36 hit during the 54 neutral events. During the same time period, only 46 hurricanes made landfall along the East Coast. There were 16 landfalls during the 23 cold years, 9 during the 22 warm years, and 21 landfalls during the 54 neutral years. The number of hurricane landfalls in both regions shows a clear inter-annual variability (Figs. 1 and 2). The largest number of hurricanes to hit either Florida or the East Coast in one year is three. This occurred in 1964 for Florida (Fig. 1) and in both 1954 and 1955 for the East Coast (Fig. 2). Since the results for the Gulf Coast (not shown) and Florida were nearly identical, only results for Florida and the East Coast will be discussed from this point on.
a. Landfall Probabilities
The ICFDs reveal a La Niña increase relative to neutral in hurricane landfalls along the East Coast, that is not present in Florida. During a cold event, the probability of two or more hurricanes hitting the East Coast is 18% vs. only 9% during a neutral event (Fig. 3). In Florida, the probability of two or more hurricanes making landfall is 22% during a cold event and 20% during a neutral event (Fig. 4). No warm phase year has produced more than one hurricane landfall in either Florida or along the East Coast. For both areas there is a decrease in hurricane landfalls in the warm phase, thus only the cold and neutral events will be discussed hereafter.
|
|
Figure 1. The number of hurricanes that made landfall in Florida each year between 1900 and 1998. El Niño years are indicated in red, neutral years are shown in green and La Niña years are indicated in blue.
|
|
Figure 2. The number of hurricanes that made landfall along the East Coast each year between 1900 and 1998. El Niño years are indicated in red, neutral years are shown in green and La Niña years are indicated in blue.
Initially, it would appear that there is no increase relative to neutral in the amount of hurricane landfalls in Florida during a cold event. However, the average number of hurricane landfalls per year for each ENSO phase reveals a notable difference in the neutral phase and not in the cold phase. For the East Coast there is an average of 0.7 hurricanes that make landfall per cold phase year (Fig. 5). In Florida, there is an average of 0.78 landfalling hurricanes per cold event (Fig. 6). During a neutral event, there are an average of 0.39 hurricane landfalls per year along the East Coast (Fig. 5) and 0.67 landfalling hurricanes per year in Florida (Fig. 6). There appears to be a significant decrease in hurricane landfalls during the neutral phase along the East Coast whereas compared to Florida. This would suggest that there is a dominant flow pattern during neutral years that tends to steer hurricanes toward Florida.
|
|
Figure 3. Inverse cumulative frequency distributions of East Coast landfalling hurricanes for warm, neutral, and cold phases, 1900-1998.
|
|
Figure 4. Inverse cumulative frequency distributions of Florida landfalling hurricanes for warm, neutral, and cold phases, 1900-1998.
|
|
Figure 5. Average number of hurricanes per year that made landfall on the East Coast from 1900-1998 during years classified by the JMA index as warm, neutral, or cold ENSO phases.
|
|
Figure 6. Average number of hurricanes per year that made landfall in Florida from 1900-1998 during years classified by the JMA index as warm, neutral, or cold ENSO phases.
b. Tracks of Landfalling Hurricanes
The tracks of hurricanes that make landfall along the East Coast during neutral years (Fig. 7) mainly originate in one region, off the Cape Verde Islands. These storms tend to recurve near the Leeward Islands and then head towards the East Coast. During the cold years, the East Coast landfalling hurricanes tend to form in the central Atlantic (Fig. 8). It is interesting to note that during the cold phase, no storm that makes landfall along the East Coast hits Florida first. Also, hurricanes that make landfall along the East Coast tend to hit further north during cold years than during neutral years (Figs. 7 and 8). Only five of the 46 hurricanes to make landfall along the East Coast between 1900 and 1998 made landfall in Georgia. Of these five, one hit during a warm year and the remaining four occurred during neutral years. No hurricane has ever made landfall in Georgia during a cold event. The tracks stay further to the east (Fig. 8), indicating the likely presence of an upper level trough that is blocking the storms from tracking any further west. This does not occur in the neutral phase (Fig. 7), thus more storms are able to push further west, hitting Florida as well as the East Coast.
|
|
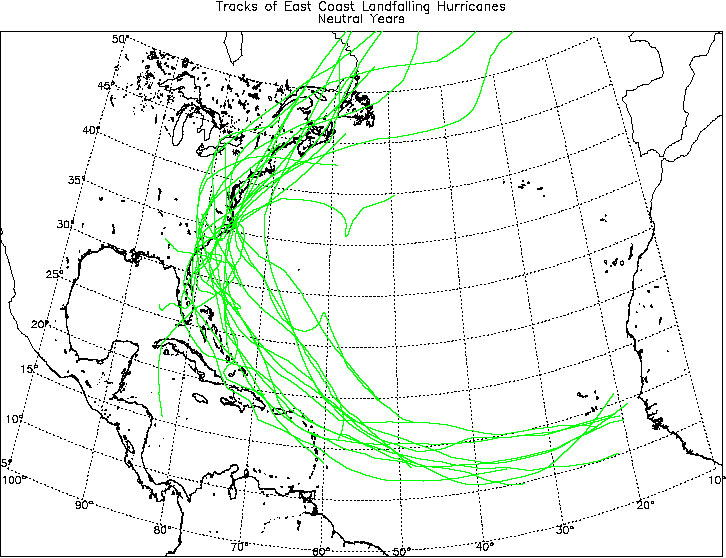
Figure 7. Tracks of hurricanes that made landfall along the East Coast during neutral years
|
|
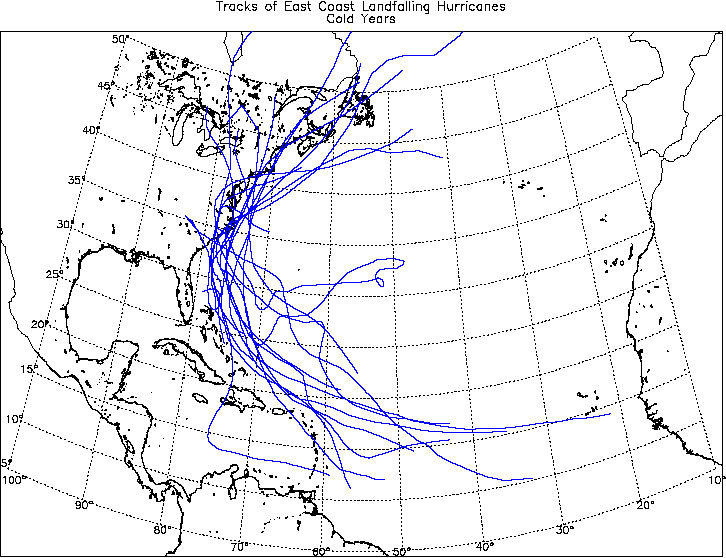
Figure 8. Tracks of hurricanes that made landfall along the East Coast during cold years.
c. Regions of Formation
Florida landfalling hurricanes during both neutral and cold years originate in two different areas (Figs. 9 and 10). Most storms begin either in the central Atlantic or in the Caribbean. In the neutral phase, storms that form in the Caribbean and off Hispaniola are more likely to hit Florida than the East Coast (Fig. 11). While it is geographically logical that storms forming in the Caribbean will hit Florida, the storms forming to the northeast of Hispaniola are equally likely to hit either Florida or the East Coast. Storms forming off of the Cape Verde Islands during neutral years are more likely to hit the East Coast (Fig. 11).
During the cold phase, the area of formation that is preferential for East Coast landfalling hurricanes extends further east to the central Atlantic (Fig. 12). This agrees with what is seen in the track plots (Figs. 7-10). The area of formation that is more likely for storms to make landfall in Florida during the cold phase is similar to that of the neutral phase (Figs. 11 and 12).
The main development region of Atlantic tropical cyclones is between 10ºN and 20ºN (Goldenberg et al. 2001). This is consistent with the formation regions identified in the present work. The main region of tropical cyclone formation during neutral years is between 10ºN-20ºN and 40ºW- 60ºW (Fig. 13). During cold phase years this region is narrower and located further South than during neutral years. The main region of tropical cyclone development for cold events is between 10ºN-15ºN and 40ºW-60ºW (Fig. 14). This is also the area of formation that is most favorable for East Coast landfalling hurricanes (Fig. 12). There are a greater number of tropical cyclone formations in this area during cold events than during neutral events. In the 5º by 10º box from 10ºN-15ºN and 50ºW-60ºW there are an average of 0.87 tropical cyclone formations per cold year (Fig. 14) and only 0.56 tropical cyclone formations per neutral year (Fig. 13). From 10ºN-15ºN and 40ºW-50ºW there is an average of 0.74 formations per cold year (Fig. 14), yet only 0.37 formations per neutral year (Fig. 13). The decrease in the number of all tropical cyclone formations during neutral years in the region most favorable for East Coast landfalling hurricanes contributes to the decrease in East Coast hurricane landfalls during neutral years.
|
|
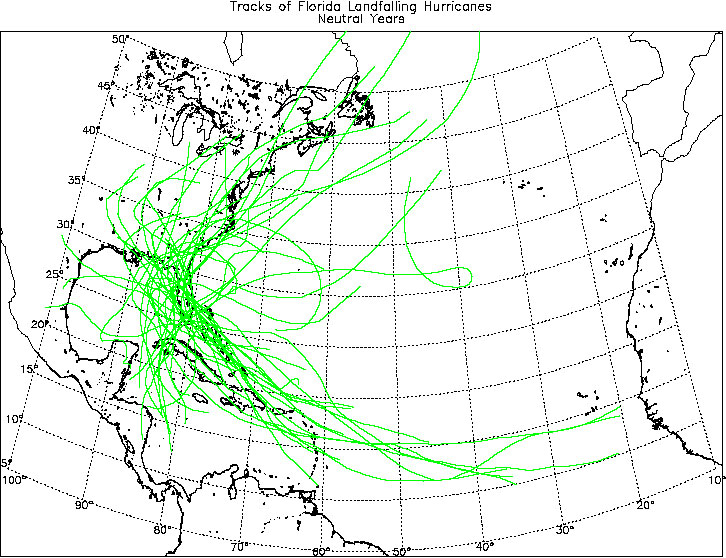
Figure 9. Tracks of hurricanes that made landfall in Florida during neutral years.
|
|
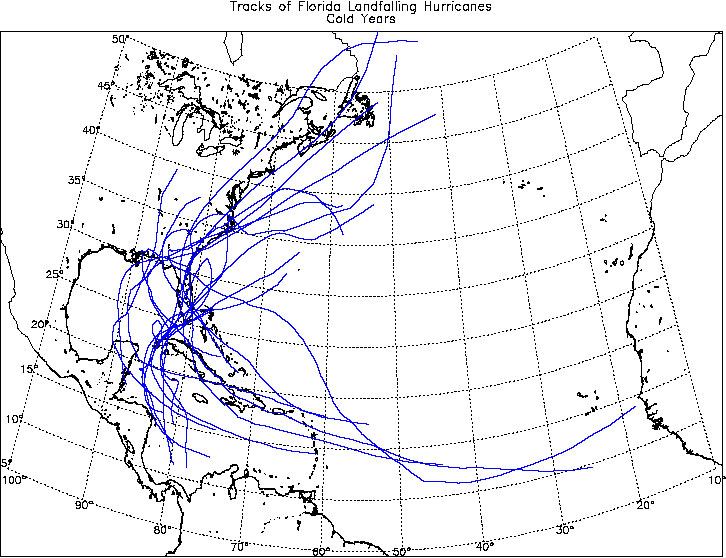
Figure 10. Tracks of hurricanes that made landfall in Florida during cold years.
|
|
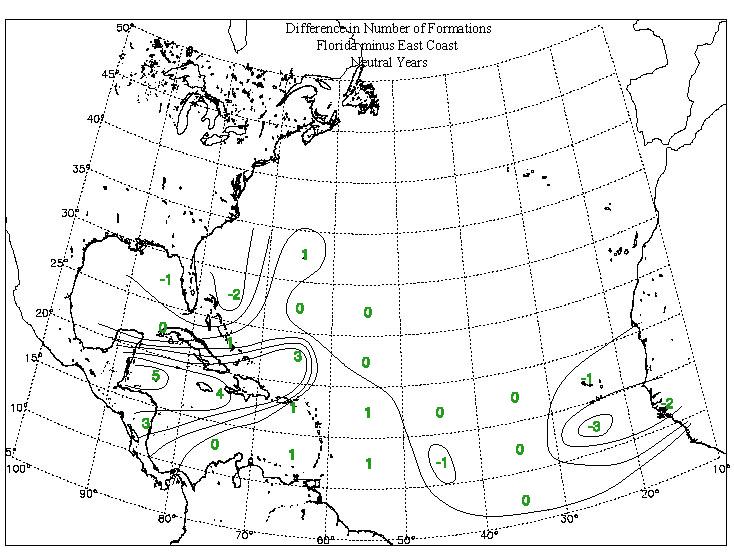
Fig. 11: The number of Florida landfalling hurricanes minus the number of East Coast landfalling hurricanes in each 5°x10° box for neutral years.
|
|
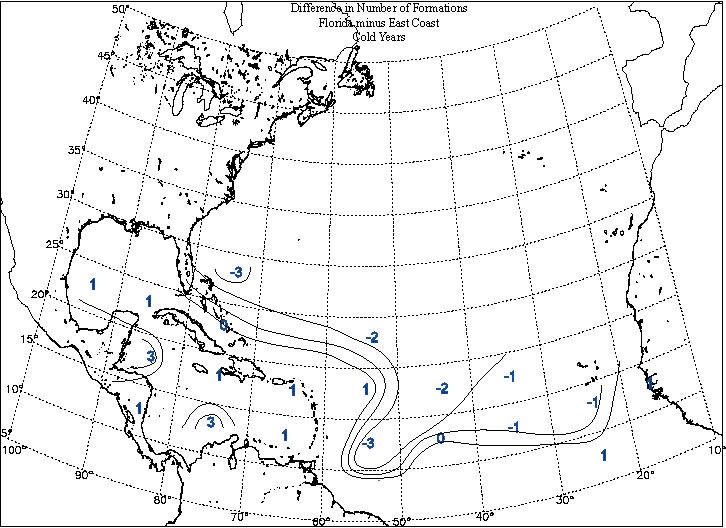
Figure 12. The number of Florida landfalling hurricanes minus the number of East Coast landfalling hurricanes in each 5°x10° box for cold years.
|
|
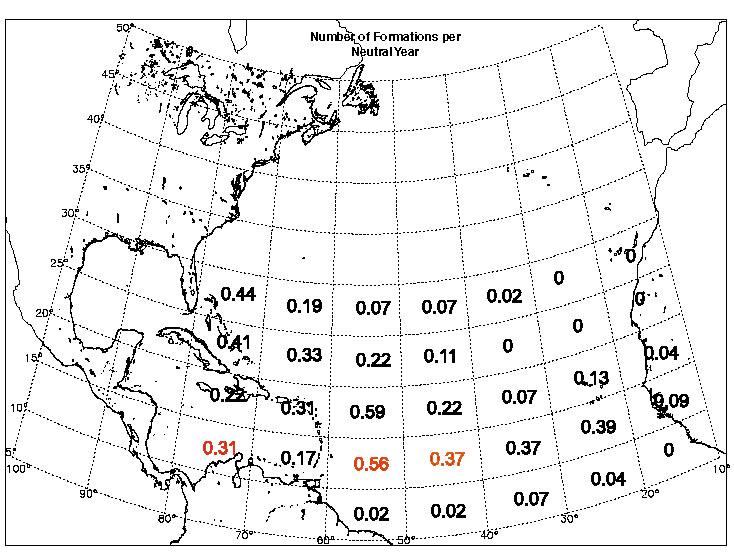
Figure 13. Number of tropical cyclone formations per neutral year.
|
|
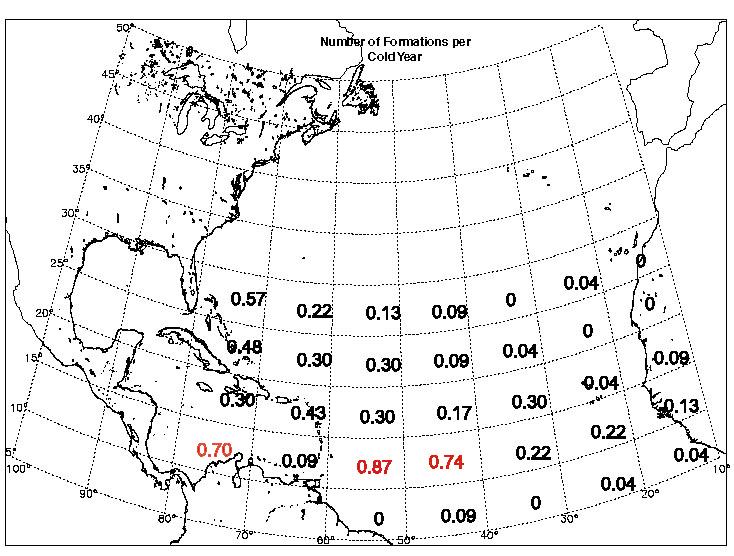
Figure 14. Number of tropical cyclone formations per cold year.
d. Other Analyses
Some of the many factors, previously discussed in Section 2, that influence tropical cyclone formation and steering (i.e., SST, vertical wind shear) may explain the results found in this work. However, composites created from the NCEP Reanalysis monthly averaged fields (not shown) do not allow a detailed investigation of these factors to be performed. The monthly analyses are extremely smoothed, hence, the composites do not display a clear signal. Daily observations for each individual landfalling hurricane would most likely be able to detect differences between cold and neutral patterns better than monthly averages.
There does not appear to be any relationship between NAO phase and location of hurricane landfall. An equal number of positive and negative NAO phase years for both East Coast (Table 1) and Florida landfalls (Table 2) are observed.
5. CONCLUSIONS
The regional differences in hurricane landfall probabilities in the United States are identified with respect to the warm, neutral, and cold phases of ENSO. Emergency planners may benefit from the results of this study. With knowledge of the ENSO phase and its effects on a particular region, one can determine when the probability of a hurricane landfall is the highest. This can be useful to local, state, and federal emergency management agencies, particularly in coastal areas.
Relative to neutral events, the frequency of hurricane landfalls along the East Coast is found to increase (decrease) during ENSO cold (warm) events. This is consistent with previous studies linking ENSO and Atlantic hurricane activity. The hurricane season that occurs before a La Niña winter is the most likely to see a landfalling hurricane along the East Coast. In Florida, there is no difference observed in the frequency of hurricane landfalls between cold and neutral events. The lack of difference in cold and neutral hurricane landfalls in Florida as compared to the difference observed along the East Coast is due to a decrease in East Coast hurricane landfalls during neutral events rather than a decrease in Florida hurricane landfalls during cold events.
Tracks of landfalling hurricanes indicate that East Coast landfalling storms tend to form in the central Atlantic and curve northward just off the Leeward Islands while Florida landfalling storms are more likely to form further west. There are less storms forming in the central Atlantic, where East Coast landfalling hurricanes tend to form, during neutral years than during cold years. This may explain why there are fewer hurricanes making landfall along the East Coast than in Florida during neutral years.
The physical mechanism(s) that cause the decrease in hurricane landfalls along the East Coast during neutral years are not clear at the present time. Some factors that may contribute to this are lower SST’s and increased vertical shear during neutral years in the central Atlantic, resulting in the reduction of tropical cyclone formation where East Coast landfalling hurricanes are most likely to originate. It is possible that the subtropical high is more elongated during neutral years, blocking hurricanes from hitting the East Coast and causing them to track further south towards Florida. Also, stronger easterlies close to the equator during neutral years may be steering storms on a more zonal path, keeping them at lower latitudes and preventing them from reaching the East Coast.
Monthly averages of pressure, height, wind, and sea surface temperature fields were insufficient in revealing any particular pattern to explain the results obtained in this analysis. It is necessary to investigate these patterns on a smaller time scale. Six-hourly conditions of sea surface temperature, vertical shear, low level vorticity, and 500-700hPa winds in the week previous to each hurricane landfall would be more useful in determining the subtle differences in conditions during cold and neutral years. Also, a correlation between NAO phase and landfall region was not observed. Further investigation is needed in order to gain a better understanding of the mechanisms suppressing East Coast hurricane landfalls during neutral years.
APPENDIX A
The warm and cold phases of ENSO are often defined using an index of equatorial Pacific sea surface temperatures (SST). There has been much disagreement in the meteorological community as to which index best defines ENSO phases. Both the Japan Meteorological Agency (JMA) index and the Southern Oscillation Index (SOI) have proven reliable for qualitative studies (Trenberth 1997; Hanley et al. 2002). For the present analysis, ENSO phases are classified according to the JMA index instead of the relatively noisy SOI index. The El Niño and La Niña periods identified by the JMA index compare well with many of the modern ENSO studies (Trenberth 1997).
The JMA defines a warm phase event when the five-month running average of sea surface temperature (SST) anomalies over the tropical Pacific (4°S-4°N, 150°W-90°W) is greater than 0.5ºC for at least six consecutive months including October, November, and December (JMA Atlas, 1991). A cold phase event is similarly defined when SST anomalies are less than -0.5ºC for at least six consecutive months including October, November, and December. All years that are not categorized as warm or cold are classified as neutral years.
An ENSO year is typically defined using the JMA index as the period from October in the year that the warm (or cold) phase develops until the following September. This definition is designed to capture the peak of an ENSO even in the boreal winter. Since the hurricane season runs from June through November, the typical ENSO year definition would split a hurricane season across two different ENSO years. Rather than classifying hurricane seasons using the standard ENSO definitions, hurricane seasons will be classified according to the onset year that the cold, warm, or neutral phase begins following the method of Bove et al. (1998). For example, the 1997 hurricane season is split between a neutral ENSO year from June through September and a warm ENSO year from October through November. According to Bove et al. (1998), the 1997 hurricane season is classified as a warm ENSO phase. ENSO classification for each hurricane season from 1900 to 1998 is displayed in Table 3. Using this method, 23 of the hurricane seasons in the 99-year period are classified as cold events, 22 are designated warm events, and 54 are categorized as neutral.
The regions focused upon in this work are the East Coast and Florida. The region defined as Florida includes the entire Florida coastline from Pensacola to Jacksonville. The East Coast is defined as the entire coastline from the Georgia/Florida border northward through Maine. Florida is treated individually from the East Coast. Some hurricanes make landfall in Florida, crossing the state and the re-entering the Atlantic where they regain strength and then hit the East Coast. These cases are treated separately as landfalls for both regions. The Gulf Coast (Alabama through Texas) was also considered in this study.
Table 3: ENSO Phases for Hurricane Seasons based on the JMA index. Row indicates decade, column indicates hurricane season. W denotes warm phase, N denotes neutral, and C denotes cold phase.
|
|
0 |
1 |
2 |
3 |
4 |
5 |
6 |
7 |
8 |
9 |
|
190 |
N |
N |
W |
C |
W |
W |
C |
N |
C |
C |
|
191 |
C |
W |
N |
W |
N |
N |
C |
N |
W |
N |
|
192 |
N |
N |
C |
N |
C |
W |
N |
N |
N |
W |
|
193 |
W |
N |
N |
N |
N |
N |
N |
N |
C |
N |
|
194 |
W |
N |
C |
N |
C |
N |
N |
N |
N |
C |
|
195 |
N |
W |
N |
N |
C |
C |
C |
W |
N |
N |
|
196 |
N |
N |
N |
W |
C |
W |
N |
C |
N |
W |
|
197 |
C |
C |
W |
C |
N |
C |
W |
N |
N |
N |
|
198 |
N |
N |
W |
N |
N |
N |
W |
W |
C |
N |
|
199 |
N |
W |
N |
N |
N |
N |
N |
W |
C |
|
ACKNOWLEDGMENTS
Funding for this research was provided by the National Oceanic and Atmospheric Administrations (NOAA) Office of Global Programs. Additional funding for this work was provided by NASA.
REFERENCES
Bove, M.C., Elsner, J.B., Landsea, C.W., Niu, X., and J.J. O’Brien, 1998: Effects of El Niño on U.S. Landfalling Hurricanes, Revisited. Bull. Amer. Meteor. Soc., 79, 2477-2482.
Carr, L.E. and R.L. Elsberry, 1990: Observational Evidence for Predictions of Tropical Cyclone Propagation Relative to Environmental Steering. J. Atmos. Sci., 47, 542-546.
Chan, J.C.L. and W.M. Gray, 1982: Tropical Cyclone Movement and Surrounding Flow Relationships. Mon. Wea. Rev., 110, 1354-1374.
DeMaria, M. J.A. Knaff, and B.H. Connell, 2001: A Tropical Cyclone Genesis Parameter for the Tropical Atlantic. Weather Forecast., 16, 219-233.
Elsner, J.B., K. Liu, and B. Kocher, 2000: Spatial Variations in U.S. Hurricane Activity: Statistics and a Physical Mechanism, J. Climate, 13, 2293-2305.
Goldenberg, S.B., C.W. Landsea, A.M. Mestas-Nuñez, and W.M. Gray, 2001: The Recent Increase in Atlantic Hurricane Activity: Causes and Implications. Science, 293, 474-479.
Gray, W.M., 1968: Global View of the Origin of Tropical Disturbances and Storms. Mon. Wea. Rev., 96, 669-697.
Gray, W.M., 1984: Atlantic seasonal hurricane frequency. Part I: El Niño and the 30 mb quasi-biennial oscillation influences. Mon. Wea. Rev., 112, 1649-1668.
Gray, W.M., 1998: The Formation of Tropical Cyclones. Meteor. Atmos. Phys. 67, 37-69.
Hanley, D., J. Molinari, and D. Keyser, 2001: A Composite Study of the Interactions between Tropical Cyclones and Upper Tropospheric Troughs. Mon. Wea. Rev., 129, 2570-2584.
Hanley, D.E., M.A. Bourassa, J.J. O’Brien, S.R. Smith, and E.R. Spade, 2002: A Quantitative Evaluation of ENSO Indices. J. Climate, accepted.
Japan Meteorological Agency, Marine Department, 1991: Climate Charts of Sea Surface Temperatures of the Western North Pacific and the Global Ocean. 51 pp.
Kasahara, A., 1959. A Comparison Between Geostrophic and Non-Geostrophic Numerical Forecasts of Hurricane Movement with the Barotropic Steering Model. J. Meteor., 16, 371-384.
Montgomery, M.T. and B.F. Farrell, 1993: Tropical Cyclone Formation. J. Atmos. Sci., 50, 285-310.
Neumann, C.J., B.R. Jarvinen, C.J. McAdie, and J.D. Elms, 1993: Tropical Cyclones of the North Atlantic Ocean. Prepared by the National Climatic Data Center, Asheville, N.C., in cooperation with the National Hurricane Center, Coral Gables, FL. 193 pp.
Richards, T.S., and J.J. O’Brien, 1996: The Effect of El Niño on U.S. landfalling hurricanes. Bull. Amer. Meteor. Soc., 77, 773-774.
Shapiro, L.J. and S.B. Goldenberg, 1998: Atlantic Sea Surface Temperature and Tropical Cyclone Formation. J. Climate, 11, 578-590.
Tartaglione, C.A., S.R. Smith, and J.J. O’Brien, 2002:ENSO Impact on Hurricane Landfall Probabilities for the Caribbean. J. Climate. (submitted)
Trenberth, K.E., 1997: The definition of El Niño. Bull. Amer. Meteor. Soc., 78, 2771-2777.
Ward, G.F.A., 1995: Prediction of Tropical Cyclone Formation in Terms of Sea-Surface Temperature, Vorticity, and Vertical Wind Shear. Aust. Meteor. Mag., 44, 61-70.