I. Introduction
It is now well-accepted that El Niño reduces hurricane activity in the Atlantic Basin. Gray (1984) uses physical processes that accompany El Niño to describe reduced hurricane activity. Gray (1984) also finds that of the 54 major hurricanes striking the United States coast during 1900-83, only four occurred during the 16 El Niño years in contrast to 50 making landfall during the 68 non-El Niño years. This is a rate of 0.25 major hurricanes per year during El Niño events and 0.74 during non-El Niño years, almost a three to one ratio. Richards and O'Brien (1996) showed that the probability of 2 or more hurricanes making landfall on the U.S. coast during El Niño is 21%, while the probability of 2 or more U.S. hurricanes during neutral conditions is 46%. However, the data and methodology used in Richards and O'Brien (1996) work are limited.
We reanalyze the frequency of hurricanes making landfall in the United States from 1900-1997 for the phases of the El Niño/Southern Oscillation (ENSO). Corrected U.S. hurricane data are used, and tropical storms are not considered in this study. The reanalysis shows that during an El Niño year, the probability of 2 or more hurricanes making landfall in the U.S. is 28%. The reanalysis further determines that the probability of 2 or more U.S. hurricanes during the other two phases is larger: 48% during neutral years and 66% during El Viejo. Also, we determine the range of these strike probabilities for El Niño and El Viejo. Strike probabilities of major U.S. hurricanes during each ENSO phase are also considered.
II. What is an El Niño?
El Niño (Warm Phase) involves an anomalous warming of the eastern tropical Pacific Ocean. Here we base the definition of an El Niño event as developed by the Japan Meteorological Agency (JMA Atlas, 1991) rather than the Southern Oscillation Index, which is relatively noisy.
The JMA Index defines El Niño events based on the sea surface temperature anomalies in the region 4° N to 4° S and 150° W to 90° W. An El Niño is identified when the five-month running average of SST anomalies is greater than 0.5° C for at least six consecutive months. The event must begin before September and include October, November, and December.
We also examine the opposite extreme of El Niño, which is known as El Viejo (Cold Phase or La Niña). The definition of El Viejo is chosen to be symmetric to that of the El Niño. Thus, an El Viejo occurs when the JMA SST index is 0.5°C below average for six consecutive months, starting before September and running through December. Years which do not meet the definition for either El Niño or El Viejo are considered neutral. The classification of each year is shown in Table 1.
Extremes in the ENSO cycle typically develop during summer, peak in late fall, and decay into the following spring. Therefore, for this analysis, we choose to define an ENSO year as the calendar year in which the El Niño develops. This definition is different than the JMA definition of an ENSO year, which runs from October of the year of development to the following September. Consequently, hurricane seasons are not broken up into 2 separate ENSO years. For example, under the JMA definition, the hurricane season of 1982 is considered neutral from June to September (considered JMA ENSO year 1981), then El Niño for October and November (JMA ENSO year 1982). With our change, the 1982 hurricane season falls entirely within ENSO year 1982.
III. Reasons For Reanalysis
There are three main limitations in the original work of Richards and O'Brien (1996). First, the JMA definition of an ENSO year was used, which breaks up a hurricane season into 2 separate events, as described above. Second, the original study only used 42 years of data, which is small for determining climatological changes. To increase the sample size, Richards and O'Brien (1996) used a resampling technique. This technique is known to be conservative with respect a measure of dispersion. Thus, the probabilities concerning El Niño U.S. hurricanes have likely been. Lastly, the data record of all U.S. hurricanes used in the original study included landfalls which never occurred. For example, the data used in Richards and O'Brien (1996) showed 2 U.S. hurricanes during JMA ENSO year 1957 (October 1957 - November 1958), when in actuality there were no U.S. hurricanes during this period.
IV. Histograms of Hurricane Landfall Occurrence
1. All U.S. Hurricanes
The sample size for examining North Atlantic hurricanes with respect to ENSO is small, with 22 El Niño years, 22 El Viejo years, and 54 neutral years. From these years, the number of U.S. hurricanes per ENSO phase is calculated. A tropical cyclone that makes at least one landfall somewhere in the U.S. as a hurricanes, or effects a portion of the U.S. coast with hurricane force winds, is considered a U.S. hurricane. Some U.S. hurricanes make multiple landfalls. Here we only consider the number of U.S. hurricanes, not the number of landfalls. Under this definition, the mean annual number of U.S. hurricanes during El Niño years is 1.04, 1.61 during neutral years, and 2.23 during El Viejo years. The number of U.S. hurricanes for each year is shown in Table 2.
The Poisson distribution is useful for describing rare, extreme events, such as the occurrance of hurricanes along the coastline. The Poisson distribution is characterized by the equality of the mean and variance. The ratio of the variance to the mean can be tested using a chi-squared (c2) distribution (Keim and Cruise 1998). Let the ratio R = s2 / mean, and N is the number of observations. R is tested against a critical R (Rc) obtained from c2N-1, a / (N - 1). With a = 0.10, Table 3 shows the test results stratified by ENSO events.
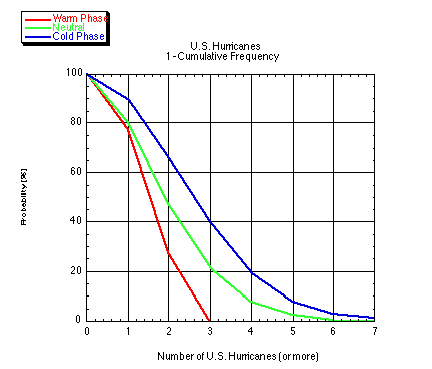
The ratios for neutral and cold events are close to unity, allowing us to assume a Poisson process (Elsner and Kara 1999, Elsner and Schmertmann 1993). Warm events are not Poisson permissible, so we adopt an empirical approach. Using these two methods, we find the probability of two or more hurricanes making U.S. landfall is 28% during El Niño, 48% during neutral years, and 66% during El Viejo (Figure 1).
The bootstrap technique (Draconis and Efron 1983) is used to determine confidence limits of U.S. hurricanes during warm and cold ENSO events. One thousand bootstrap records of U.S. hurricanes with respect to the ENSO phase are created with sample size of 22. The mean and empirical frequencies for each bootstrap sample are determined, and ranked in order to produce 5 and 95 percent confidence limits of the ENSO event. The same procedure is used for both the El Viejo and neutral years. In these cases the bootstrapped mean is used as the Poisson parameter.
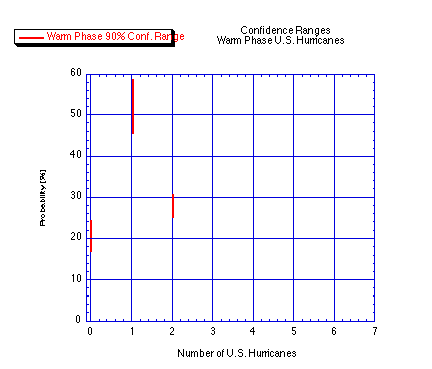
Figure 2 shows the 5 and 95 percent confidence limits of U.S. hurricanes during El Niño. During El Niño, we are 90% confident that the probability of no hurricanes making U.S. landfall is somewhere between 17 and 24 percent. The probability of exactly one U.S. hurricane given an El Niño is between 45 and 58 percent, and the probability of two U.S. hurricanes during El Niño lies between 25 and 31 percent. Based on the historical data, there is no chance of more than 2 U.S. hurricanes during El Niño.
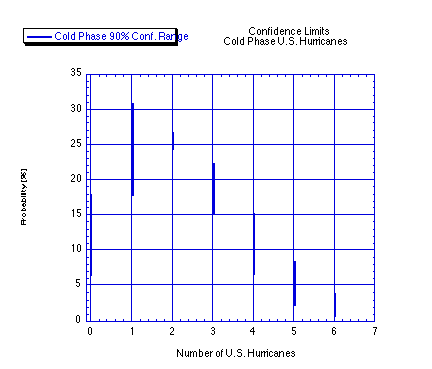
The probability of multiple U.S. hurricanes during El Viejo is significantly larger (Figure 3). The probability of not observing a U.S. hurricane during El Viejo ranges from 7 to 18 percent. The probability of exactly one El Viejo U.S. hurricane lies between 18 and 31 percent. The probability of exactly 2 U.S. hurricanes during El Viejo is about 26 percent, or once in every 4 cold phase years. For exactly 3 U.S. hurricanes, the probabilities vary between 15 and 22 percent, and for exactly 4 U.S. hurricanes the range is from 7 to 15 percent.
As seen in Figures 2 and 3, the probability range of exactly one U.S. hurricane is actually higher during warm phase than during cold phase. The probability spread of one U.S. hurricane is the same for both extreme events, however, with both warm and cold phases exhibiting a 90% confidence interval of 13 percent: warm phase from 45 to 58 percent, cold phase from 18 to 31 percent. For exactly 2 U.S. hurricanes, the probabilities are about the same between warm and cold events. The range of 90% confidence is quite narrow during cold phase for exactly 2 U.S. hurricanes, giving us a high degree of confidence that the probability is close to 26 percent. For warm phase, the range of probabilities is larger.
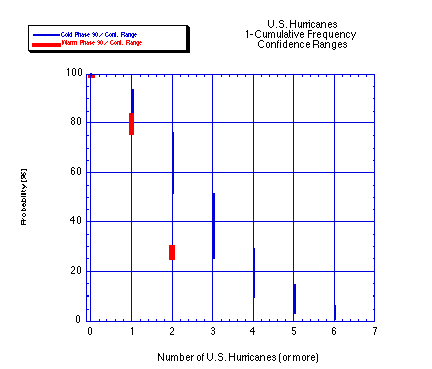
Taking the inverse cumulative frequency distributions of these confidence intervals and comparing the two phases shows the dramatic differences ENSO makes in U.S. hurricane activity (Figure 4). For example, the probability range of 2 or more U.S. hurricanes during El Niño (with 90% confidence) is 25 to 31 percent. For El Viejo, the probability for 2 or more U.S. hurricanes is much greater, ranging from 51 to 76 percent.
2. Major U.S. Hurricanes
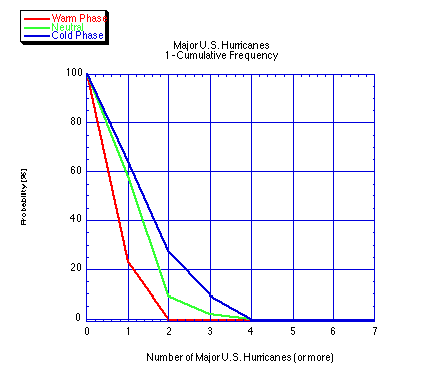
Major U.S. hurricanes (hurricanes making U.S. landfall with sustained winds of 96 knots or more) are of even more interest due to the larger amount of damage they can produce (Pielke and Landsea 1998). The impacts of ENSO on major U.S. hurricanes are similar to those for all U.S. hurricanes. There are 63 major U.S. hurricanes in the past 98 years, 5 during El Niño, 37 during neutral conditions, and 22 during El Viejo. The mean annual number of major U.S. hurricanes is 0.23 for El Niño, 0.68 for neutral conditions, and 0.95 for El Viejo conditions. The number of major U.S. hurricanes per year is shown in Table 4 (Neumann et al. 1993).
Here only empirical data is used to determine return frequencies of major U.S. hurricanes. Figure 5 shows that during an El Niño, the probability of at least one major U.S. hurricane is about 23 percent. The probabilities for at least one major U.S. hurricane during the other two phases are much higher: 58% for neutral conditions and 63% during a cold event. The United States is much more likely to see a major hurricane during neutral or cold events than during El Niño.
During the past 98 years, no El Niño event has ever been associated with more than one major U.S. hurricane. In contrast, the data shows there is a 27% chance for 2 or more major U.S. hurricanes during cold phase and a 8% chance during neutral conditions. It is also possible to see three major hurricanes during these phases of the ENSO cycle: 9% for cold phase, and 2% for neutral. No year has seen 4 or more major U.S. hurricanes.
V. Conclusions
Here we quantitatively relate the impacts of warm (and cold) sea surface temperature anomalies in the eastern tropical Pacific Ocean to the number of hurricanes making landfall in the United States. Whether or not an El Niño event is identified during the early summer, as it was in 1997, the potential for a major outbreak of U.S. hurricanes in an El Niño year is significantly decreased. The chance of a major U.S. hurricane is reduced as well.
Acknowledgments
The Center for Ocean-Atmospheric Prediction Studies (COAPS) receives its base support from the Secretary of the Navy Grant to James J. O'Brien. Additional support for this work was received from the Office of Global Programs, NOAA. The second author received support from NSF and the Risk Prediction Initiative (RPI).
References
Draconis, P. and B. Efron, 1983. Computer-intensive methods in statistics. Sci. Amer., 248, 116-130.
Elsner, J. B. and Schmertmann, 1993: Improving extended-range seasonal predictions of intense Atlantic hurricane activity. Wea. Forecasting, 8, 345-351.
Gray, W. M., 1984. Atlantic seasonal hurricane frequency. Part I: El Niño and 30 mb quasi-biennial oscillation influences. Mon. Weath. Rev., 112, 1649-1668.
Elsner, J. B., and A. B. Kara, 1999: Hurricanes of the North Atlantic: Climate and Society, Oxford, In press.
Japan Meteorological Agency, Marine Department, 1991. Climate Charts of Sea Surface Temperatures of the Western North Pacific and the Global Ocean. 51 pp.
Keim, B. D., and J. F. Cruise, 1998: A technique to measure trends in the frequency of discrete random events. J. Climate, 11, 848-855.
Neumann, C.J., B. R. Jarvinen, C. J. McAdie, and J.D. Elms, 1993: Tropical Cyclones of the North Atlantic Ocean. Prepared by the National Climatic Data Center, Asheville, NC, in cooperation with the National Hurricane Center, Coral Gables, FL. 193 pp.
Pielke, Jr., R. A., and Landsea, C. W., 1998: Normalized U. S. hurricane damage, 1925-1995. In press, Wea. Forecasting.
Richards, T. S., and J. J. O'Brien, 1996. The effect of El Niño on U.S. landfalling hurricanes. Bulletin of the Amer. Met. Soc., 77, 773-774.
List of Tables
Table 1. List of ENSO years, based on the JMA-SST Index. The column indicates the decade, and the row indicates year. 'W' indicates a warm phase, 'C' indicates a cold phase, and 'N' indicates neutral conditions.
Table 2. List of U.S. hurricanes per year. The column indicates the decade, the row indicates the year.
Table 3. Results of Poisson tests on annual means and variances of the number of U.S. landfalling hurricanes by ENSO events.
Table 4. List of major U.S. hurricanes per year. The column indicates the decade, the row indicates the year.
List of Figures
Figure 1. Inverse cumulative frequency distributions of US landfalling hurricanes, 1900-1997.
Figure 2. Probability distributions of U.S. hurricanes at the 5 and 95 percent confidence levels for the ENSO warm phase.
Figure 3. Probability distributions of U.S. hurricanes at the 5 and 95 percent confidence levels for the ENSO cold phase.
Figure 4. Inverse cumulative frequency distributions of U.S. hurricanes at 5 and 95 percent confidence levels for warm and cold phases of ENSO.
Figure 5. Inverse cumulative frequency distributions of major U.S. hurricanes, 1900-1997.
Table 3
Table 4
|
Figure 1 |
|
Figure 2 |
|
Figure 3 |
|
Figure 4 |
|
Figure 5 |
Copyright 1998, Bove et al. All Rights Reserved

