
Morton D. Winsberg
Melanie Simmons
No element of Florida's climate is more costly to its householders than its long and hot seasons. Hurricanes that strike Florida may cause billions of dollars of damage, but fortunately their arrival is infrequent. The state's hot season, however, arrives without fail every year, usually while the northern states are still enjoying spring. As air conditioners are turned on to cool throughout the state to counter the increasing heat, electric bills rise. Residents of northern states, however, generally pay more to keep their homes warm during the winter than Floridians pay to cool their homes in the summer.
Without air conditioning Florida could never have become the fourth most populated state in the nation, and even in the summer one of the most visited. It is inconceivable that the state would have attracted so many retirees without it, nor would Disney and other investors in theme parks have chosen the Orlando area, and elsewhere in the state, to build their facilities, which now annual attract tens of millions of visitors from elsewhere in the nation and abroad, and are among the state's major employers (Arsenault, 1984).
An examination of the difference in electric power use in Florida between winter and summer illustrates the importance of air conditioning to the state (Table 1). When combined peak monthly demand for the months of June, July and August (the hottest months) is compared to that of the combined months of December, January, and February (the coolest months), except for a handful of power companies, the demand for electricity during the three hottest months is about 20 percent higher than that for the three coolest ones. Air conditioning accounts for most of that difference. Whereas most Floridians depend on their air conditioners to heat during the winter, temperatures at that time of year, even in its north, are sufficiently mild to require much less energy for heating than in the summer for cooling.
Table 1: Peak Power Demand Winter compared to Summer
| Investor-Owned Systems 2006 | Mount Dora | 1.32 | |
| Florida Power and Light | 1.28 | New Smyrna Beach | 1.13 |
| Gulf Power | 1.21 | Newberry | 1.06 |
| Progress Energy | 1.15 | Ocala | 1.17 |
| Tampa Electric | 1.25 | Orlando | 1.79 |
| Municipal Systems | Quincy | 1.16 | |
| Alachua | 1.17 | Reedy Creek | 1.17 |
| Bartow | 1.09 | Starke | 1.17 |
| Blountstown | 1.45 | Tallahassee | 1.13 |
| Bushnell | 0.94 | Vero Beach | 1.09 |
| Chattahoochee | 1.26 | Wauchula | 1.24 |
| Clewiston | 1.09 | Winter Park | 1.26 |
| Fort Pierce | 1.23 | Rural Electric Cooperatives | |
| Gainesville | 1.28 | Central Florida | 0.92 |
| Green Cove Springs | 1.08 | Choctwahatchee | 1.08 |
| Havana | 1.38 | Florida Keys | 1.24 |
| Homestead | 1.27 | Glades | 1.04 |
| Jacksonville | 1.05 | Gulf Coast | 0.88 |
| Jacksonville Beach | 1.03 | Lee County | 1.14 |
| Key West | 1.25 | Seminole | 1.02 |
| Kissimmee | 1.33 | Sumter | 1.08 |
| Lake Worth | 1.29 | Suwannee River | 0.98 |
| Lakeland | 1.12 | Talquin | 0.86 |
| Leesburg | 1.36 | Withlacoochee River | 0.94 |
| Moore Haven | 1.20 | ||
Florida Power and Light, the major energy provider for Florida's East and Southwest coasts, generates 28 percent more electricity in the hot than the cold season, for the Tampa Bay area it is 25 percent, and for the western Panhandle (Gulf Power) 21 percent. Categorized by user, in 2006 Florida Power and Light's residential customers used 41 percent more electricity in summer than winter, while for commercial establishments it was 17 percent more, but for industry it was seven percent less. For a number of reasons the differences between winter and summer in energy production of the state's suppliers varies throughout the state (Table 2).
Table 2: Percentage Difference in Summer Energy Use With that of Winter
| Residential | Commercial | Industrial | ||
| Florida Power and Light | 41% | 17% | -7% | |
| Progressive Energy | 40 | 31 | 9 | |
| Tampa Electric | 41 | 23 | 12 | |
| Gulf Power | 59 | 47 | 34 | |
| Jacksonville Electric | 35 | 34 | 22 | |
| Orlando Utilities | 47 | 28 | 24 | |
| Tallahassee Electric | 29 | 33 | 22 | |
|
Winter: Dec, Jan, Feb. Summer, June, July, August |
||||
Degree-Days
The focus of this study is changes in the length and intensity of Florida's hot season over time. This is an issue that many Floridians who suffer through this hot and humid period give much thought to. Without air conditioning it is a very enervating period, but with air conditioning, especially with the recent huge increase in the price of energy, it has become very expensive. The study also addresses another issue increasingly important to a growing number of Floridians, global warming. Is the hots season becoming longer and hotter? The study relies heavily on the use of degree-days for its measurement.
The degree-day is an index developed by heating engineers to measure the effect of outside air temperature on building energy consumption. To calculate the daily degree-day for a weather station, it's high and low temperatures for a given day are averaged and then subtracted from a base temperature. The most widely used base temperature, which is used here, is 65° Fahrenheit (F). That temperature has become standard because it is assumed that when the outside temperature is 65° F a building needs to be neither heated nor cooled. Thus, if the high temperature for the day of the station were 85° F and the low temperature were 55° F, the average would be (70° F). By subtracting the base temperature 65° F from the station's average that day the number of degree-days is obtained (5 degrees). Since the average is above the base temperature, and cooling is deemed necessary to maintain a comfortable temperature in the building, the day is designated as a 5 cooling degree-day. If the station's average temperature for that day was 55° F, and the base temperature was 65° F, the base temperature would be 10 degrees higher than the actual temperature. Since heating is needed it is called a 10 heating degree-day. On first use many people confuse the index number as the number of days of either cooling or heating, when in fact it is the difference in the temperature average that day from the base temperature.
Controls of Florida Climate
Before interpreting the distribution of degree-days throughout the state, and the share of those degree-days that were for cooling, it is appropriate here to identify the important variables that effect heating and cooling throughout the state (Winsberg, 2003). The most important is latitude. Florida is, with the exception of Hawaii, the southernmost state in the nation. As a consequence, during both summer and winter, at noon, the sun is higher on the horizon than in states farther north. This means its rays are striking the state at a higher angle. The higher the sun is on the horizon the more it is able to heat. For example, at the time of the summer solstice (June 22), the longest period the sun is above the horizon in the northern hemisphere, the angle of the sun at noon in Orlando is 85 degrees. In New York City it is 73 degrees. On December 22nd, the date of the winter solstice, when in the northern hemisphere the daylight period is the shortest, the noon sun's rays reach Orlando at a 38 degree angle, and at New York the angle is 28. Florida stretches almost six degrees of latitude, so between north and south Florida, at any given day of the year, there is about a six degree difference at noon in the angle of the sun that reaches the earth, for example between Key West and Jacksonville.
A second factor in explaining the distribution of temperature throughout the state is that, as a peninsula, no part of Florida is very far from a large body of water, either the Atlantic Ocean or the Gulf of Mexico. Land near large water bodies reflect the temperature of the water bodies they are near, especially if there are wind systems that move air from above the water onto the land. Water loses and gains heat more slowly than land, because the rays of the sun can penetrate deeper into water than land. Conversely, water releases its heat more slowly than land. Consequently, if air modified by the Gulf or Atlantic reaches into Florida's interior in the summer it is generally cooler than the air it displaces. The reverse is true in the winter, when breezes that enter the state from the Gulf and from the Atlantic tend to be warmer than those in its interior.
This difference in temperature between a maritime and a more continental location can be illustrated by comparing the maximum temperatures of Miami Beach, whose station is directly on its shore, with that of Miami International Airport, located approximately eight miles west of it. The July average maximum temperature at the station in Miami Beach is 87.4° F while at the airport it is 89.5° F. Forty miles west of Miami Beach, in the middle of the Everglades, the 40-Mile Bend-Tamiami Trail station records a 92.0° F July average. Because land at night loses its heat more rapidly than water, temperature of the air above it falls more rapidly. Since night is usually when a station's temperature reaches its daily minimum, and the nearer the water the more water temperature controls air temperature, the reverse occurs. Looking at the same three South Florida stations, average July minimum temperature at Miami Beach is 78.4° F, for Miami International Airport it is 76.5° F, and for the Tamiami Trail station it is 73.8° F. Such differences over a relatively short distance can be found along all of Florida's coastlines.
If the temperature of the water off of Florida's coasts is changing, that change should be reflected in the temperature at stations near it? However, research by Maul and Sims (2007) suggest that there is "no geographic organization to temperature change as an indicator of Florida's coastal marine climate variability." On the other hand, research from the present study reveals that the ten weather stations in Florida which have experienced trends of the earliest dates of arrival of the hot season during the period 1950 to 2007 were coastal. If the water offshore did not change in temperature during the 58-year period, what caused the change? Since most of the ten stations were in large and rapidly growing cities the likely explanation is the "heat island effect," which will be described later.
Smaller scale wind systems called land and sea breezes facilitate the exchange of air between the sea and the land. During the daytime, particularly in the hot season, temperatures rise over the land and the warmed air at its surface rises, creating a low pressure area that draws cooler air from the sea. This is called a sea breeze, and modifies the temperature on the land near the coast. The reverse occurs at night, when the water surface temperature is higher than that of the land and air begins to rise over the water, pulling air from the land. This wind is named the land breeze, and also is most common in the summer.
Low pressure systems that cross the continent from west to east, usually following the jet stream, exert a strong and frequent influence on winter temperatures in North Florida, but decrease in both strength and frequency southward down the peninsula. If these low pressure systems pass close to or even through Florida, they can draw cold air masses from the interior of the nation, or even Canada, into Florida. Sometimes temperatures may fall well below freezing as far south as Miami. These blasts of cold air are the worst enemies of the state's vegetable and citrus farmers.
Since these low pressure systems pass over or near the state most frequently during the winter they also play a major role in defining the beginning and end of the hot season. There is great variation from year to year in the arrival of cold fronts. At a given station they may continue arriving well beyond the mean date of the season's arrival and much earlier than the mean date of the end of the season. For most Floridians the end of the hot season is the most eagerly anticipated date. After a long and exhausting hot season many Floridians long for the first few days when a cold front reaches them, lowering the temperature as well as the humidity to a more comfortable level. However, it is not uncommon for a cold wave of considerable severity to arrive early, only to be followed by many hot days.
Most who study weather accept that greenhouse gases contribute to global warming, although it is still a contentious issue as to their degree. Urbanization is usually cited as one of the leading contributors to the release of greenhouse gases into the atmosphere, and the term "urban heat island" has come into common use describing the contribution that the environment of large and dense concentrations of people effect the climates in which they live. Those who cross an asphalt paved parking lot during a hot summer day, can appreciate how the surface of a large city can be a tremendous conductor of heat.
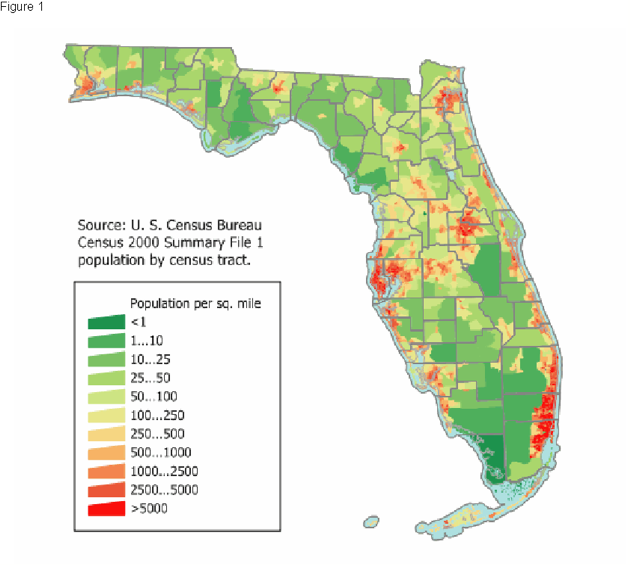
Florida's enormous population growth since the end of World War II has swelled the size of its cities. In fact, urban growth has been so rapid along its so-called "Gold Coast", which extends from Miami-Dade County north to Palm Beach County, that towns within it have merged into one huge "megalopolis" has emerged. Actually coastal towns along almost the entire east coast of the state have merged with each other to form an almost continuous urban strip from south of Miami to Jacksonville. Two others are emerging, one between Tampa-St. Petersburg and Daytona Beach, the other from Tampa-St. Petersburg to Naples (Figure 1).
|
|
The phenomenon of the Urban Heat Island of Orlando has been examined in detail (Yow and Carbone, 2006). The authors' findings can be extrapolated to other Florida urban areas. They found that during the 36-month study-period, differences between the temperature of a station in the heart of the city and one on its urban fringe often differed by as much as 14° F.
Less well-known than the Urban Heat Island's contribution to global warming is the contribution made by the disturbance of the natural landscape. Though much of Florida's natural landscape has been altered, the natural environment of one huge area, The Everglades, has come under close scrutiny. Throughout the twentieth century large portions of it have been drained and put into agriculture, particularly vegetables and sugarcane. Scientists have examined the climate of the Everglades over time and have concluded that, among other variables, there has been an increase in daytime maximum temperature (Marshall, Pielke, and Steyaert, 2004). To the north of Lake Okeechobee is the Kissimmee River, whose basin also has been radically altered from its natural state through drainage and vegetation clearance, to make room for farming and cattle ranching. It, like the Everglades, has also experienced climate change.
Data and Methodology
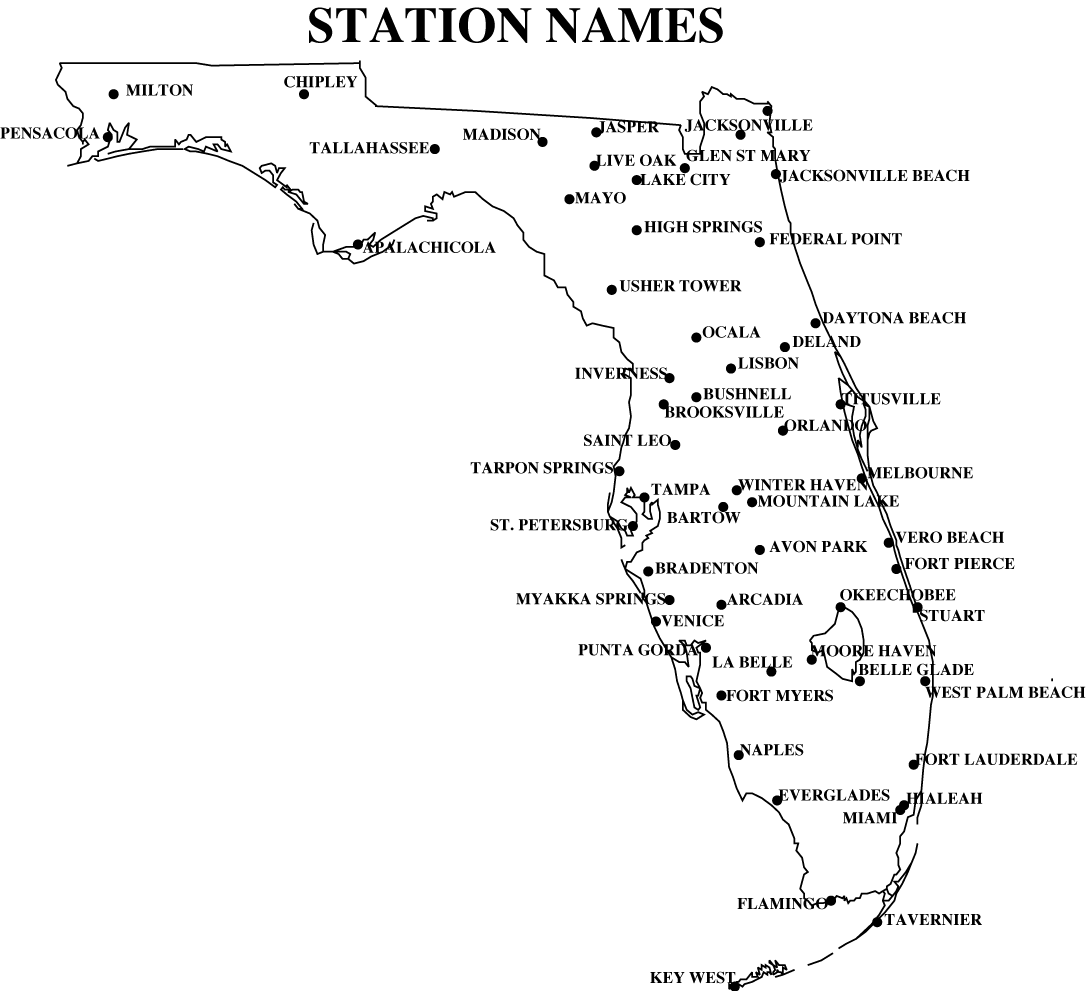
This study proposes to calculate through the use of degree-days, changes in the length and the strength of Florida's hot season between 1950 and 2007. Unfortunately, only eight weather stations within the state were able to provide complete or nearly complete daily minimum and maximum temperature for that period. The number of stations was expanded to 57 by adding 49 through the efforts of Rebecca Anne Smith (Smith, 2004) whose study on maximum and minimum temperature trends in the United States required complete daily temperature between 1948 and 2004 for 758 stations. Most of these stations had missing data, but with the help of members of the Florida State University's Department of Meteorology, Center for Atmospheric Prediction and the Florida Climate Center, Smith was able to fill in the missing temperature data for the stations to the satisfaction of her master's degree thesis committee. Since the period for this study is from 1950 to 2007, and that of the Smith study was between 1948 and 2004, her data was extended through 2007 by drawing on Weather Service data, or in their absence, from those of nearby stations. Figure 2 shows the location of all stations used in the study.
|
|
The daily minimum and maximum temperature for the 58-year period (21,170 days) was converted to degree-days, and submitted to a 14-day moving average. The beginning of the hot season is here defined as when, during the year, there were at least seven consecutive days when the cooling degree-days in the moving average reached or exceeded 10. The end of the period was the first of seven consecutive days when the cooling degree-days of the moving average fell below 10. In defense of the 10 cooling degree-day definition, for example, the minimum temperature that day might be 65° F and the maximum temperature 85° F, and the average 75° F. For most people such a temperature range would be interpreted as hot. In Florida during July and August it is common for the daily temperature range to be between 73° F and 95° F. A range of this size would produce a 19 heating degree-day. Though highly subjective, it was believed that the definition meets the demands of those interested in the length of the state's hot season.
A word about the maps used. Gradient maps were generated through Mapview software. Gradient maps display, through color, information taken from points. The point data are interpolated onto a grid. The accuracy of the map grid improves with the density of the weather stations. Unfortunately large areas of Florida, most notably the Everglades and the Kissimmee River valley, are devoid, or nearly so, of weather stations that can provide 58 years of data. The computer program assigns colors to the grid from the data points based on a selection of color spectrums provided with the software. For the maps of this study the most important factor governing the selection of the color spectrum was the one that best displayed the data. Undoubtedly, the accuracy of the software's interpretation of the data varies. In those parts of the map where stations are densest the map is most accurate.
Once the data were collected for all the days between 1950 and 2007 and all leap days eliminated, the beginning and end of the hot season were manually established for each year of the 58-year period. From this data the mean date of the beginning and end were calculated as was the mean length of the season. The degree and direction of change for these data during the 58-year period were obtained through use of simple linear regression, where the slope was assumed to be the rate of change. The trends were tested for significance, and all stations with confidence levels of .10 or better were identified on the maps and in Table 3. The fact that over sixty percent of the stations produced confidence levels of at least .10 for their beginning and end date trends, 39 percent for the length of the season supports the relevance of this investigation.
Table 3: Length and Intensity of Florida's Hot Season
| Station | Figure 5 Mean Beginning of Hot Season |
Figure 6 Mean End of Hot Season |
Figure 7 Mean Length of Hot Season |
Figure 8 Net Change in Days at Beginning of Hot Season 50-07 |
Figure 9 Net Change in Days at End of Hot Season 50-07 |
Figure 10 Change in the Length of the Hot Season 50-07 |
Figure 11 Trend in share DD>15 in Share DD>10 50-07 |
| Apalachicola | 26-May | 14-Oct | 143 | 4 | 2 | -1 | 19* |
| Arcadia | 15-May | 5-Nov | 173 | 19* | 16 | -3 | 4 |
| Avon Park | 6-May | 30-Oct | 177 | 14* | -1* | -15* | 10** |
| Belle Glade | 15-May | 2-Nov | 171 | -8** | 9* | 17* | 32* |
| Chipley | 4-Jun | 13-Oct | 131 | 15* | 10 | -6 | 4 |
| Daytona Beach | 21-May | 23-Oct | 155 | -2 | 3 | 5 | 20* |
| Everglades | 11-May | 18-Oct | 191 | 26* | 27 | 2 | -3 |
| Federal Point | 24-May | 24-Oct | 154 | 13* | 14 | 1 | 5 |
| Fernandina Beach | 30-May | 20-Oct | 143 | 22* | 17 | -6 | -2 |
| Fort Myers | 26-Apr | 5-Nov | 193 | -11* | 13* | 24* | 3 |
| Fort Pierce | 16-May | 9-Nov | 177 | 15* | 23 | 8** | 17* |
| Ft. Lauderdale | 27-Apr | 14-Sep | 318 | -12 | 21* | 33 | 12* |
| Inverness | 20-May | 27-Oct | 160 | 35* | 8* | -27* | 20* |
| Jacksonville | 23-May | 15-Oct | 144 | 16* | -2* | -13* | 10** |
| Jasper | 5-Jun | 14-Oct | 287 | 11 | 12 | 1 | 9 |
| Key West | 31-Mar | 4-Dec | 248 | 3 | 20* | 17** | 1 |
| LaBelle | 26-May | 6-Nov | 185 | 1 | 2 | 1 | 17* |
| Lake City | 2-Jun | 19-Oct | 139 | 14* | 17 | 3 | 6 |
| Lisbon | 18-May | 19-Oct | 292 | 9 | -3* | -12 | -5 |
| Madison | 20-May | 10-Oct | 143 | 12* | 4 | -7* | -4 |
| Mayo | 24-May | 11-Oct | 284 | 1 | 3 | 1 | 8 |
| Melbourne | 13-May | 31-Oct | 171 | 3 | 7 | 4 | 17* |
| Miami | 12-Apr | 24-Nov | 226 | -20* | 25* | 45 | 32* |
| Milton | 27-May | 5-Oct | 278 | 3 | 1 | -2 | 11* |
| Naples | 2-May | 11-Nov | 193 | -10** | 8* | 18* | 11* |
| Ocala | 18-May | 27-Oct | 162 | 30* | 12* | -18* | 1 |
| Orlando | 9-May | 25-Oct | 167 | -6** | -8 | -2* | 16* |
| Pensacola | 28-May | 16-Oct | 141 | 9* | 2 | 6 | 8** |
| Tallahassee | 25-May | 9-Oct | 137 | -3* | 2 | 5 | 17* |
| Tampa | 6-May | 27-Oct | 174 | -2 | 5 | 8* | 15* |
| Tarpon Springs | 16-May | 4-Nov | 172 | 6** | 25* | 19* | 15* |
| Tavernier | 30-Mar | 2-Dec | 336 | 2 | 21* | 19 | 2 |
| Titusville | 21-Jun | 23-Sep | 275 | 11 | 5* | -6 | 10** |
| Usher Tower | 31-May | 22-Oct | 144 | 11* | 16 | 5* | 6 |
| West Palm Beach | 22-Apr | 15-Nov | 208 | -9 | 14* | 23 | 4 |
| Winter Haven | 12-May | 6-Nov | 178 | 1* | 24** | 23* | 13* |
| *Significant at the .05 level or less | |||||||
| ** Significant at the .05 to .10 level | |||||||
Interpretation of Florida's Cooling and Heating Degree-Days
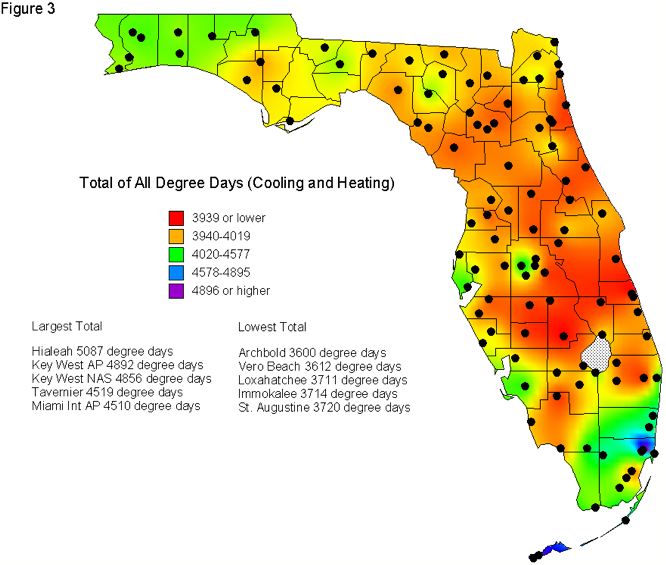
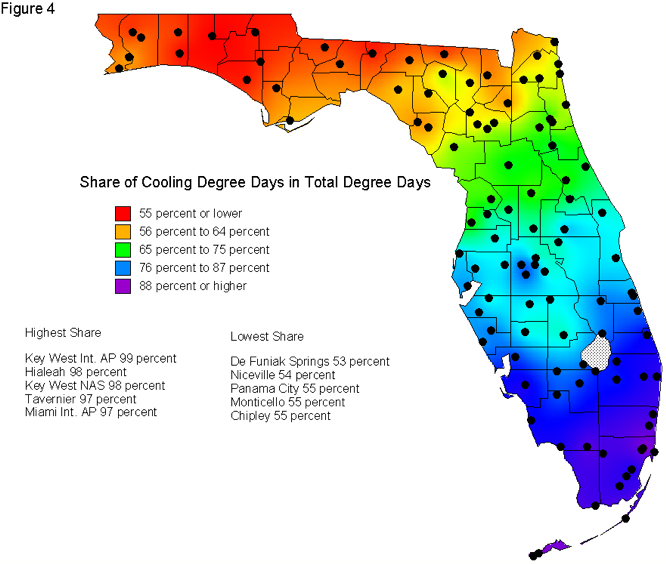
Figures 3 and 4, using a data set provided by the US Weather Service shows the distribution of degree-days throughout Florida for 106 stations based on data gathered between 1970 and 2000. It can be seen that the combined cooling and heating degree-days are highest in southeastern Florida, particularly in the most urbanized portion of the Gold Coast and the Keys. Stations in the Keys, situated on the southern end of the peninsula, have the largest number of degree-days, most of which are cooling (Figure 4). A contributing factor to the large number of cooling degree-days in Miami and neighboring Hialeah is that these stations are well within Greater Miami's urban heat island. Areas of high combined degree-days extend up the Gulf Coast and include the Fort Myers area and that of St. Petersburg. It should be noted that there are no such areas along the state's Atlantic Coast north of Palm Beach County, despite the fact that there are a number of large population concentrations. In part this is because of the moderating influence of the Gulf Stream on east coast weather stations, and the fact that the Gulf of Mexico's water temperature during the hot months at the same latitude as that of a station along the Atlantic Coast, tends to be warmer.
|
|
|
|
Slightly east of St. Petersburg, in the interior of the peninsula, are several stations in and around Lakeland with moderately high numbers of combined degree-days. The cause of this anomaly is difficult to explain, but it might result from the urban heat island effect and the high level of industrialization and mining in the area.
The western Panhandle, from Pensacola to DeFuniak Springs also has a large number of combined degree-days. Its long cool season is the major explanation. Whereas it is typical throughout most of peninsular Florida for the share of cooling degree-days in the total to be 75 percent or higher, by the Gainesville area the share falls to 70 percent, and in the western Panhandle it almost reaches down to 60 percent. Figure 4 identifies another important climatic divide within Florida, the division between Florida's continental and peninsular climate. The divide runs approximately between St. Augustine and Cedar Key. North of this divide, during the winter, freezing temperatures, which arrive from the interior of the North American continent are frequent. South of the line the marine influence on both the east and west side of the Peninsula rapidly dissipate the strength of the cold fronts causing the frequency of freezes to rapidly drop.
The combined heating and cooling degree-days of most Florida weather stations is roughly the same as found at weather stations located between Atlanta, Georgia and Norfolk, Virginia. Of course, a far higher percentage of the degree-days in Florida are cooling. For example, whereas the share of cooling degree-days in the total for the North Florida city of Tallahassee is 61 percent, for Atlanta, Georgia it is 36 percent. For cities in the northern United States from which many retirees come to live in Florida, the share is much lower; Washington, DC 28 percent, New York 18 percent, Boston 11 percent, Chicago 10 percent, and Milwaukee 6 percent.
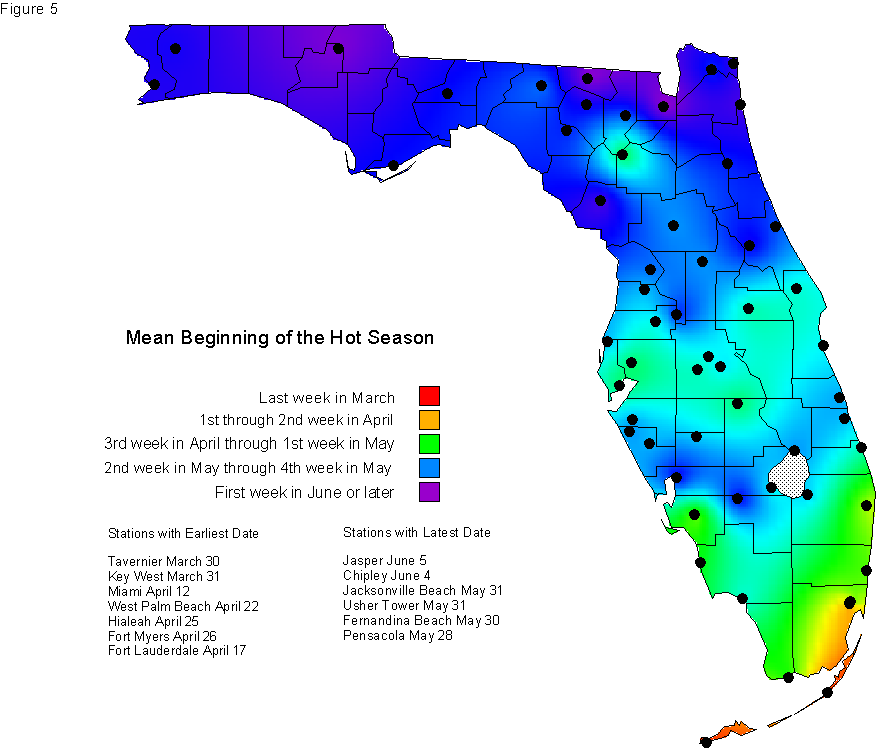
The beginning, the end and the length of the hot season was determined and the mean for each during the 58-year period was established for all 57 stations. Variation from the mean date of arrival and departure of the hot season increases from northern to southern Florida, since the timing, frequency and strength of cold fronts from the interior of the nation vary greatly from year to year. For example, residents of Tallahassee can expect, with a high degree of confidence, that at approximately the end of May the hot season will begin, and close to the beginning of October it will end. Residents of cities farther south cannot be nearly so confident of the arrival and departure of their hot seasons.
Acknowledging this variation, of the 57 stations here examined, the mean hot season begins in the Keys on March 30th and proceeds northward until on June 5th it reaches Jasper, nearly at the Georgia state line (Figure 5). The marine influence and dense urban development contribute to the arrival being earlier along the southeast coast than in the interior. This is especially true of stations in the urban complex from Miami to West Palm Beach. Here the urban heat island effect is probably stronger than elsewhere in Florida. However, the Gulf Coast's Fort Myers, now a moderately large urban area, also has an early arrival date.
West of Lake Okeechobee is an area of Florida where the hot season begins later than the surrounding area. The explanation for this is not known to the author. However, the area's vegetable farmers are familiar with their unusual temperature situation, and recognize that their farming operations face a higher vulnerability to frosts than do farmers elsewhere in the southern part of the Florida peninsula.
|
|
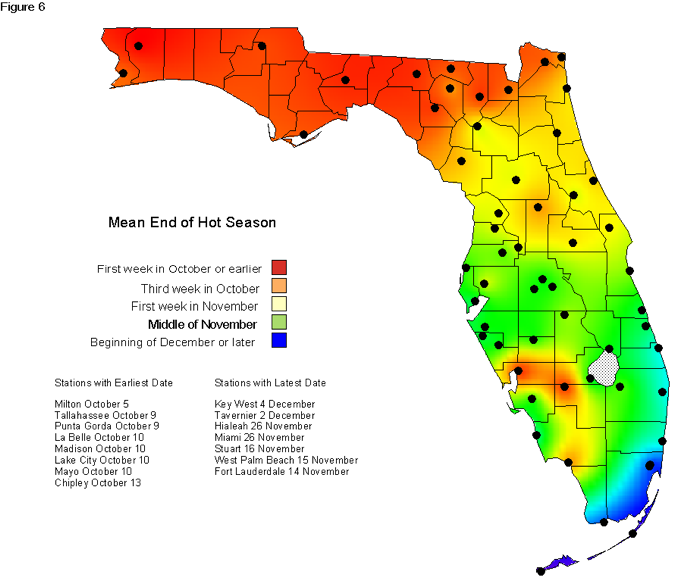
The mean end of the hot season begins in North Florida in late September or early October, usually proceeded by the arrival of a cold front from the nation's interior. The week of the end moves southward until, in early December, it reaches Key West (Figure 6). It arrives earlier on the Atlantic coast than that of the Gulf. This difference is difficult to explain because in the fall the surface water temperature in the Gulf of Mexico drops more rapidly than that of the Atlantic at the same latitude. The season anomaly west of Lake Okeechobee, previously identified on the map showing the beginning of the hot season, can be seen on the map that shows the end. Here the end occurs in early October, while the end comes to the area surrounding it in November.
|
|
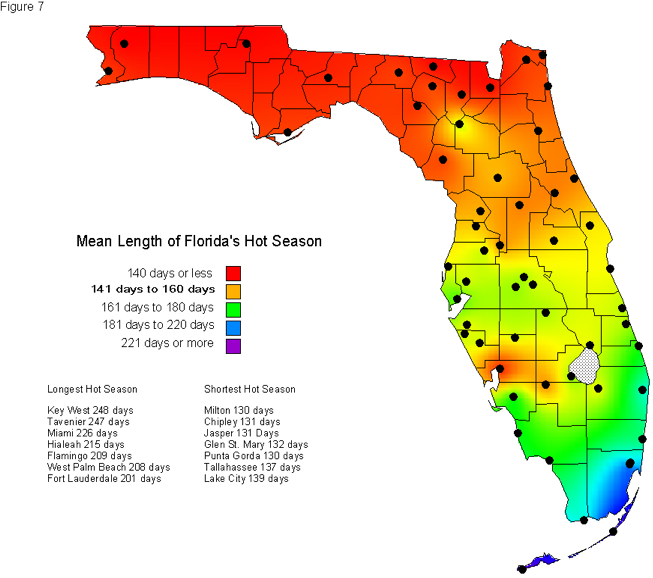
There are no surprises when the length of the hot season is examined (Figure 7). The longest Florida hot season is experienced in the southern part of the state, extending up both the Atlantic Coast to a little beyond West Palm Beach and up the Gulf Coast to Fort Myers. LaBelle, situated southwest of Lake Okeechobee in the previously mentioned zone of a temperature anomaly, has a length far shorter than stations nearby.
|
|
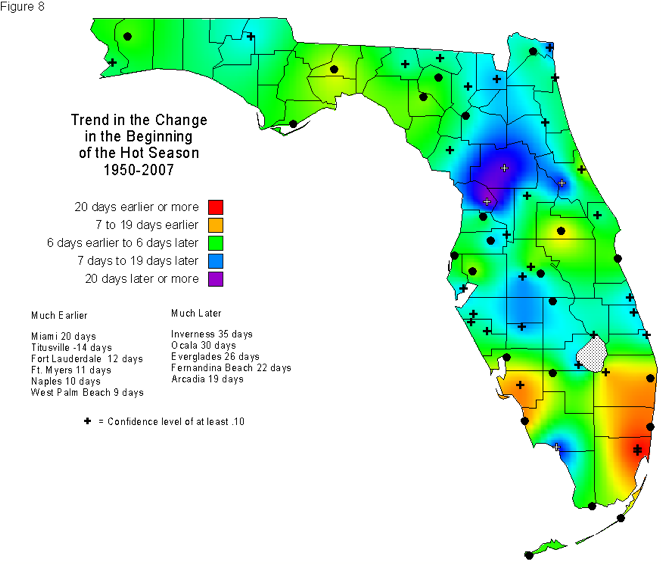
Changes in the beginning and end of the hot season are explained by a number of factors. Most of the stations where there has been a trend toward an earlier arrival of the hot season during the 58-year period are located in urban areas, notably the Fort Myers, Naples, West Palm Beach and Miami stations (Figure 8). The Belle Glade station, as explained by its present keeper, is situated in an area that during the 1960s was drained and converted to sugarcane production. It is more difficult to explain why, during the 58-year period, at some stations the hot season has been arriving later. The most notable examples are the stations in Ocala and Inverness, both of which have seen a great increase in years where the season has been arriving later than the mean. In the absence of any physical explanation it might be explained by a change in the location of their stations. The stations have been relocated, but the distance is small. Unless they were moved to local environments that were radically different than where they previously had been located this does not explain the late arrival in this part of Florida.
|
|
The pattern of change of the map identifying the end of the hot season also presents problems of interpretation (Figure 9). Perhaps the most difficult to explain is that of the Orlando station, where the trend has been toward the season to end much earlier than in the past. One possible explanation is that in early 1974 the station moved a few miles north to a new site. The summer maximum temperature average at the new station is almost 5° F higher than at the old one, and the average minimum temperature is almost 2° F lower. Perhaps these data offer a clew in the explanation. Other stations in the interior of the Florida Peninsula have experienced earlier ends of the hot season over time, but the trend for Orlando is the greatest. The Panhandle is another anomaly, since several stations there have been experiencing earlier than normal ends of their hot season.
|
|
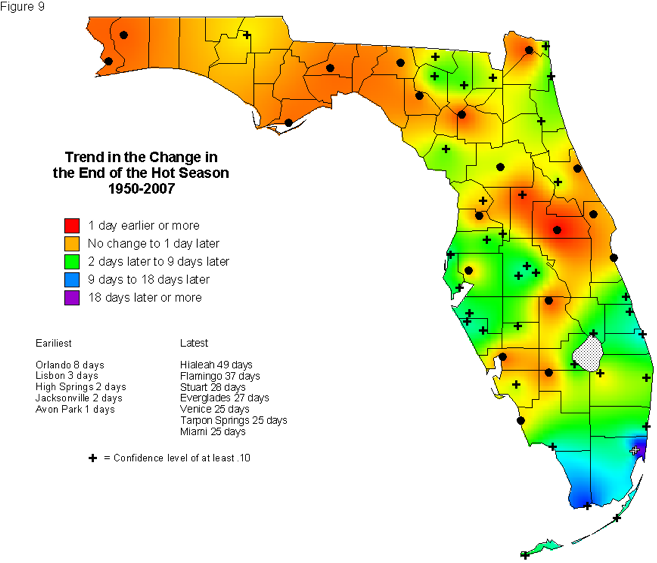
In much of the rest of Florida the end of the hot season over time has been arriving at a later date than the mean. This is particularly true of South Florida. The explanation is not entirely due to the intensification of the urban environment, though it probably is the major reason for the extension of the season along the Gold Coast, particularly Miami. However, stations in the Keys, where population growth has not nearly been so rapid, have also experienced late extensions of their hot seasons.
|
|
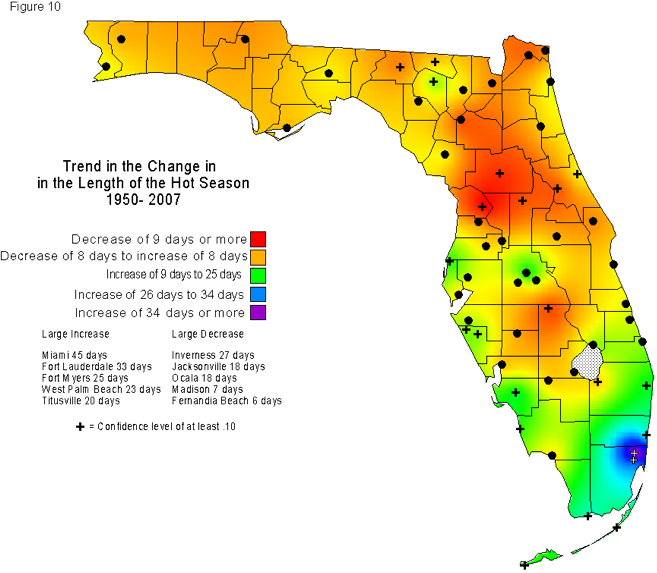
Figure 10 identifies the net change of the length of the hot season between 1950 and 2007. Most of the stations that have experienced a large growth are situated on the state's Gold Coast, and undoubtedly the urban heat island effect is the major contributing factor. Miami and Hialeah, both stations close to each other, in particular have witnessed a much earlier beginning of their hot seasons during the 58-year period, but an even longer increase of their end. Most of the South Florida stations, including the two in the Keys owe their increase in length more to an extension of the hot season into the fall, rather than an extension of the season into the cooler spring season. Since Belle Glade, in the Everglades, and the two Key stations are not located in highly urbanized areas, other unexplained factors must account for the season's greater expansion at the season's end, rather than an earlier beginning. The greatest decrease in the hot season was at the Inverness and Ocala stations. At both stations the hot season has been beginning much later, and ended earlier than in the past. The same is true, but to a lesser degree of the station at the Jacksonville airport. However, the station at nearby Jacksonville Beach, while experiencing a trend toward a later arrival of the hot season during the 57 year period, experienced a later arrival at the end of the season. The explanation for the decrease in length of the hot season of these stations also remains elusive. The length of the hot season at most stations in the Panhandle has remained stable during the 58-year period, there being little change in the arrival and departure of the hot season or that changes in one have tended to cancel out the changes in the other.
Changes in the Intensity of the Hot Season
The search for a way to measure change in the intensity of the hot season over time through the use of cooling degree-days led to an examination of the share each year over the 58-year period of the degree-days that were 15 or higher in the total degree-days 10 or higher (Figure 11). A degree day of 15 or higher, which normally occurs at the height of the hot season, assuredly can be considered a "dog day," a popular southern term for one that is especially enervating. To achieve such a high degree-day the minimum temperature would have to be 70° F and the maximum 90° F, or some other combination to produce an average of 80° F.
|
|
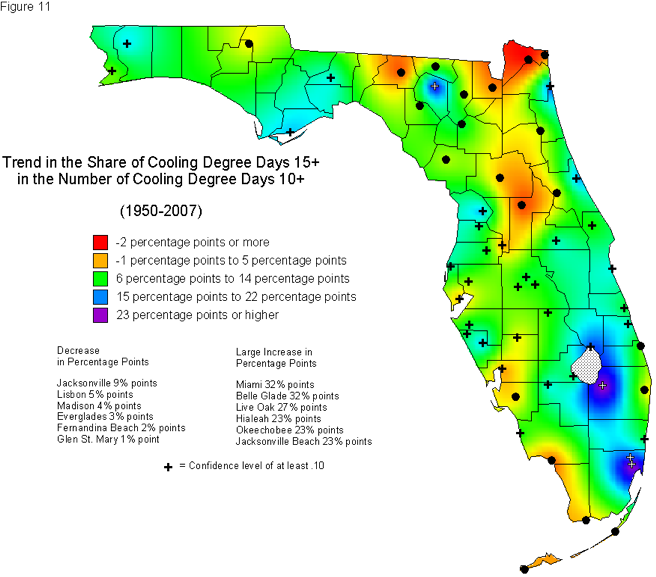
Only six of the 57 stations during the 58-year period experienced a decrease in the share of 15 degree-days in the total degree-days 10 or higher. Five of the six were in the northern half of the state. Lest the reader concludes from this concentration that the decrease in the share of especially hot days can be regionalized, it should be pointed out that the trends of all six were not statistically significant, even at the .10 confidence level. Among the 57 stations there were two where there was neither an increase nor decrease in the change of "dog days." Of the remaining 49 stations for which there was an increase they appear to be widely dispersed throughout the state. Of the eight that experienced at least a 20 percentage point increase, all their trends were significant at least at the .05 confidence level or even higher. Furthermore, half of them (Miami, Belle Glade, Hialeah, and Okeechobee were situated in the southern half of the peninsula.
As a variable to measure global warming, however, the trend in the share of 15 cooling degree days in the total cooling degree days 10 cooling degree days is not very reliable. The trends of Miami and Hialeah can be explained through the growth of the urban concentration in which they are located, and perhaps that of Daytona Beach as well. The explanation for that of Belle Glade station probably results from the radical alteration of the natural environment for crop production However there are a number of stations which have experienced neither urbanization or environmental alteration for crop production that also have seen considerable increases in their share of especially hot days. For want of a more precise explanation the answer for such growth may emerge from local variables such as station relocation and changes in instrumentation.
An interesting local variation that remains unexplained despite considerable effort to identify the reason is the huge difference in trends between Jacksonville and Jacksonville Beach, located quite close to each other. Jacksonville's station is situated at its airport approximately 15 miles from the Atlantic coast. That of Jacksonville Beach is virtually on the coast. Why the former experienced a 9 percentage point decline in its share of especially hot days and the latter a 23 percentage point increase remains unexplained. Whatever the explanations, whether it is urbanization, drainage or other land alteration, station change, or global warming, a majority of Florida stations have been experiencing an increase in the intensity of their hot season. Whether this warming trend can be attributed to "global" as opposed to more "local" or even "regional" factors, remains to be determined.
Conclusions
Florida's hot season begins in Key West in late March and arrives in North Florida in early June. It ends first in North Florida in early October and reaches the Florida Keys in early December. There is a slight geographic variation in the beginning and end of the season brought about by proximity to the Gulf of Mexico and Atlantic Ocean, both of which exert their influence by slightly advancing the beginning compared to stations in the interior and retarding the end compared to stations in the interior. An unexplained anomaly to this generality is an area found on the west side of Lake Okeechobee where the hot season begins later than the area surrounding it, and ends earlier.
This study has established that at most of the 57 weather stations examined the length of the hot season increased, and in 23 the increase was by at least a week. Of the seven stations that experienced at least a three week increase, five were in large cities (Hialeah, Miami, Ft. Lauderdale, Ft. Myers, and West Palm Beach). The trends of all five had confidence levels of .05 and higher. All have experienced rapid population growth since 1950, and were in the southern one-third of the Florida Peninsula.
Most stations (46) experienced a later beginning of the hot season during the 58-year period, and at 18 stations the trend was for a beginning to come later by at least two weeks. No regional concentration of this trend was identified. Seven stations experienced a trend for an earlier beginning of their season by at least a week. Among them were Hialeah, Miami, Ft. Lauderdale, Ft. Myers and Naples, all urban areas that have had large population increases since 1950. For all but Naples the confidence level of their trends was .05 or higher.
Increase in the length of the hot season has been mainly due to the end arriving later, not the beginning arriving earlier. Actually there were only five stations where there was a trend during the 58-year period toward an earlier arrival of the end of the season. Among those stations with a later arrival there were 19 where the trend was at least three weeks later. Among them were Hialeah, Miami, and Ft. Lauderdale, all Gold Coast cities which have experienced rapid population growth. The trend for an earlier arrival and late end of the hot season was also experienced by the Gold Coast city of West Palm Beach and Ft. Myers on the west coast, but not nearly to the degree of the aforementioned Gold Coast cities.
It is extremely difficult to assign responsibility for these changes in the hot season during the 58-year period. Many variables seem to be involved in the explanation, and no single variable, for example an increase in carbon dioxide levels in the atmosphere, can be applied to all of them. If global warming were the most important variable we would have seen a greater homogeneity in changes in the hot seasons among these stations. However, the large number of Florida's weather stations situated in highly urbanized areas that have experienced great changes in the beginning, the end, and the length of their hot seasons easily leads one to the conclusion that the urban heat island must exert a powerful influence in their changes over time.
Bibliography
Arsenault, Raymond, "The end of the Long Hot Summer: The Air Conditioner and Southern Culture," Journal of Southern History, Vol. No. 1 (November, 1984) 597-628.
Marshall, C.H. Jr., R.A. Pielke Sr., L.T. Steyaert, and D.A. Willard, 2004: The Impact of Anthropogenic land-cover change on the Florida Peninsula sea breezes and warm season sensible weather. Monthly Weather Review, Vol. 132, No. 1 (January, 2004) 28-52.
Maul, George A. and Harold J. Sims, "Florida Coastal Temperature Trends: Comparing Independent Datasets," Florida Scientist, Vol. 70, No. 1 (January, 2007) 71-82.
National Climate Data Center (2004) Monthly Station Normals of Temperature, Precipitation, and Heating and Cooling Degree Days 1971-2000, Climatography of the United States Number 81, Florida.
Pielke, R.A., R.L. Walko, L. Steyaert, P.L. Vidale, G.E. Liston, and W.A. Lyons, 1999: The Influence of anthropogenic landscape changes on weather in South Florida. Monthly Weather Review, 127, 1663-1673.
Schmidt, N., E.K. Lipp, J.B. Rose, and M.E. Luther, 2001: ENSO influences on seasonal rainfall and river discharge in Florida, Journal of Climate, Vol. 14, 615-628.
Smith, Rebecca, (2007) "Trends in Maximum and Minimum Temperature Deciles in Selected Regions of the United States" Master's Thesis, Department of Meteorology, Florida State University.
Winsberg, Morton D. Florida Weather (2nd Edition), Gainesville, Fl: University Press of Florida.
Yow, Donald M. and Gregory Carbone, :The Urban Heat Island and Local Temperature Variation in Orlando, Florida, Southeastern Geographer. Vol. 46, No. 2 (November, 2006) 297-321.