
Morton D. Winsberg
Department of Geography
Florida State University
Tallahassee, FL 32306
This email address is being protected from spambots. You need JavaScript enabled to view it.
(Associate of the Florida Climate Center)
Abstract
Florida is situated within a part of the United States where torrential rain is a common occurrence. Torrential rain is here defined as at least 3 inches in a single day. Rain of at least this magnitude is far more frequent along Florida's coasts than in its interior. The Panhandle and the Gold Coast experience such weather events more than elsewhere in the state. Except for North Florida, rainstorms are heavily concentrated in the warm months. Mid- latitude low pressure systems, that pass over or near North Florida in the winter, often produce heavy rain. As a consequence that part of the state has no seasonal concentration. The distribution of torrential rain throughout the state is much more uneven during years when they are most frequent than when few such storms occur. During the 51 years of daily observations for 48 weather stations no cyclical pattern of torrential rain was discerned. However, when data were organized by Enso phase it was shown that during the La Niña phase torrential rainfall, especially of 5 inches or more in a day, was more frequent than during the phase named El Niño. This was most true of South Florida stations.
|
|
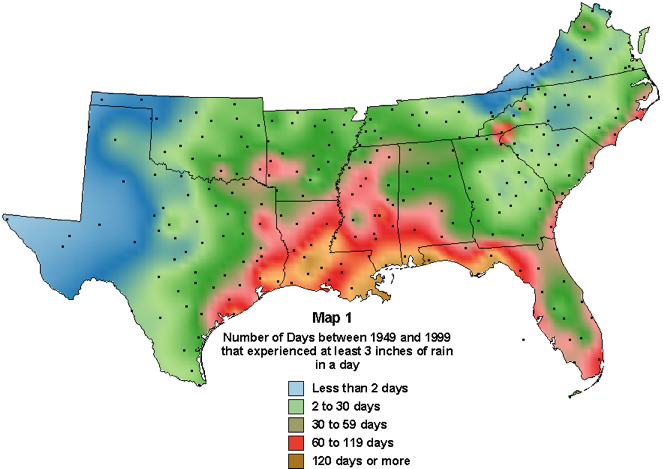
Florida lies within a broad region along the Gulf and Atlantic coastal plains of the southeastern U.S. that experiences frequent episodes of torrential rain (Map 1). Torrential rain in Florida is here defined as three inches or more in one calendar day. Rain of this magnitude contributes approximately ten percent of the total precipitation that falls on the state, more in some parts of it, less in others. Along the coasts of both northwestern and southeastern Florida torrential rain makes the heaviest contribution, while in the interior of the peninsula it contributes the least. For several decades a Florida weather station held the nations record for the most rain to fall in a 24-hour period. Yankeetown, a small fishing port on the northwestern side of the peninsula, during September 5th, 1950 was swamped by 38.7 inches of rain. The village retained the national record until July 25th-26th, 1979 when 43 inches fell on Alvin, Texas, situated between Houston and Galveston. This record still stands.
Torrential rain, since it is usually accompanied by intense atmospheric turbulence, has the potential of causing much property damage, as well as the destruction of agricultural crops and livestock. Florida is especially vulnerable to flooding because it is both low and flat. Although the sandy soils of the Peninsula are capable of absorbing water rapidly, their ability to absorb large amounts is limited because the water table is normally very close to the surface. Most of the state's densely populated areas are situated on the shore of either the Atlantic Ocean or the Gulf of Mexico, and are especially vulnerable to rainstorms. Not only are such storms more frequent than in the interior of the state, but a large share of the urban area is covered by pavement and roofs, which concentrate runoff into low areas. Most of Florida's cities today have adequate storm drainage systems to meet the demands of a sudden intense downpour, but flooding, sometimes on a major scale, does occur.
This study seeks to better understand the significance of heavy rainfall within Florida. First heavy torrential rains are defined. This is followed by a discussion of the relative importance of torrential rainstorms of different magnitudes. Geographical variation throughout the state in the frequency of heavy rainfall is then explored. Finally, in the interest of predicting heavy rainfall, as well as ascertaining the relationship between this weather event and global warming, an effort is made to determine whether there is any correlation between these episodes and temperature change. Since the weather phenomenon Enso is an important control of precipitation as well as temperature, the degree of correlation between heavy rain and its phases (El Niño, La Niña, and the neutral period) is calculated.
Definition of Torrential Rain and the Data
Torrential rain is here defined as at least three inches in one day. Although admittedly arbitrary, that lower limit was chosen because below 3 inches few places in the state are likely to be flooded. Furthermore, if the lower limit were raised, even an inch higher, there would be so few occurrences that the resulting data would be difficult to interpret. Daily precipitation data used in this study were obtained from the National Climatic Data Center files, which are available online from the Southeast Regional Climate Center in Chapel Hill, North Carolina.
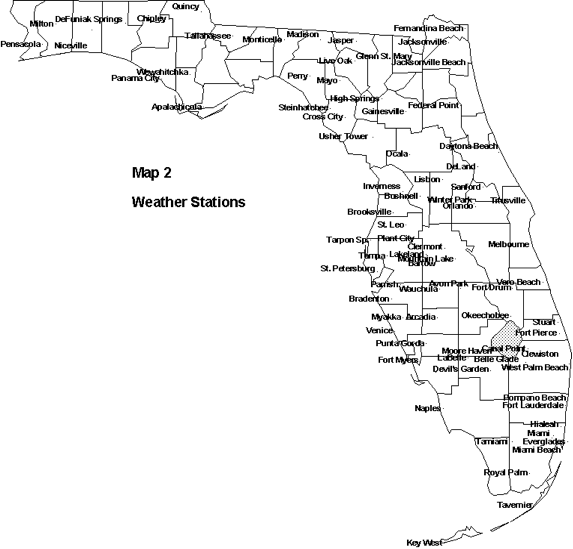
Several criteria were used in the selection of stations. Their period of observations had to be long, since torrential rain, as previously stated, is an infrequent occurrence. The daily records had to be close to 100 percent complete and there geographical distribution had to be sufficient so all parts of the state were represented. Sixteen weather stations had mostly complete precipitation records from 1932 to the present, but it was felt that these were too few in number and too geographically concentrated to draw any meaningful spatial conclusions about the state's heavy rain. There were 76 stations for which there was largely complete data from 1966 to the present, but the number of years seemed too small to draw conclusions. It was decided to use the 48 weather stations whose daily precipitation records between January 1, 1949 and December 31st, 1999 (51 years) were at least 94 percent complete (Map 2). In fact, the records of 20 of them were 99 percent complete or even higher. All sections of the state were well represented by these stations.
|
|
The reader should be aware that the amount of daily precipitation, especially from the cooperative weather stations, which constitute the majority, is not necessarily that which fell between one midnight and another. Cooperative weather stations usually depend heavily on non-professional volunteers who read the gauges when it is convenient, hopefully each day at a time agreed upon. Few are read at or near midnight. Only a small number of Florida stations record hourly precipitation. Consequently, a rainstorm may begin during one calendar day and end in another. The total rainfall of the storm would then be shared by two days, and although it may be higher than three inches, if no calendar day had a total of three inches it would not be counted.
Torrential Rainfall in Florida
Florida is one of the wettest states in the nation, but also earns the right to be called the Sunshine State. Based on the 51 years of data from the 48 weather stations here examined, the average weather station in the state has 252 days during the year in which there is no rain, or 69 percent of the year. There are 36 days in which there is barely measurable precipitation (.001 inches to .10 inches), and 42 days with .10 to .49 inches. Thereafter the number falls off very rapidly; 19 with .5 to .99 inches, 12 with 1 to 1.99 inches, 3 with 2 to 2.99 inches. Truly torrential rain, which here begins at 3 to 3.99 inches, occurs only one time in an average year. Above the 3 to 3.99 inch interval the average is so small that it must be stated in multiple years. Approximately every three years a storm that produces 4 to 4.99 inches of rain in a single day occurs, in a little less than every 8 years there is one of 5 to 5.99 inches, and typically 13 years must elapse for both a storm that produces 6 to 6.99 inches and 7 inches or greater. These are averages, however, and as will be shown, there is considerable variation among the stations throughout the state.
Torrential rain in Florida primarily results from the passing of low pressure systems through or close to it. The most well known low pressure system is the tropical hurricane, which is capable of producing truly enormous amounts of precipitation over a short period of time. These and the weaker, but much more frequent tropical waves and storms, from which hurricanes evolve, also are capable of producing heavy rainfall. These storms originate in the Atlantic, the Caribbean, the Gulf of Mexico, and on rare occasions the Pacific (first passing through Mexico). They most frequently occur from May through November, although they may be experienced during any of the other months.
Other low pressure systems also are capable of producing deluges. During summer days the surface in the interior of the peninsula becomes hot, and the air above it rises. The low pressure system that results draws moist air from the Gulf and the Atlantic onto the peninsula and where the two air masses converge the air rises. If the air masses are large enough, and they rise to a high enough altitude for the water vapor within them to condense, they are capable of producing prodigious amounts of rain in a short period. Mid-latitude low pressure systems also are capable of producing heavy rainfall, most frequently in the colder months when the mid-latitude jet streams sometimes swing deeply into the South. These low pressure systems draw moist air into them, commonly from the Gulf of Mexico. When they meet cold air masses from the north they rise over them, and during their ascent water vapor within them may condense producing heavy rain over a short period, especially if they stall or move slowly. Since the jet streams that move these streams seldom reach far down the peninsula, North Florida experiences more torrential rain from mid-latitude low pressure systems than South Florida.
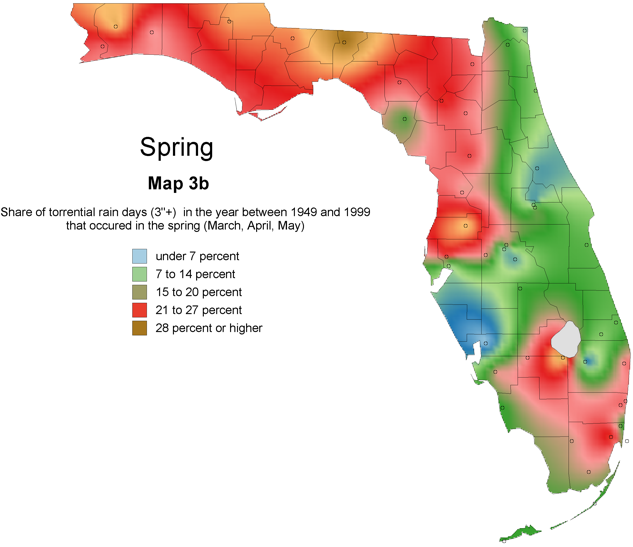
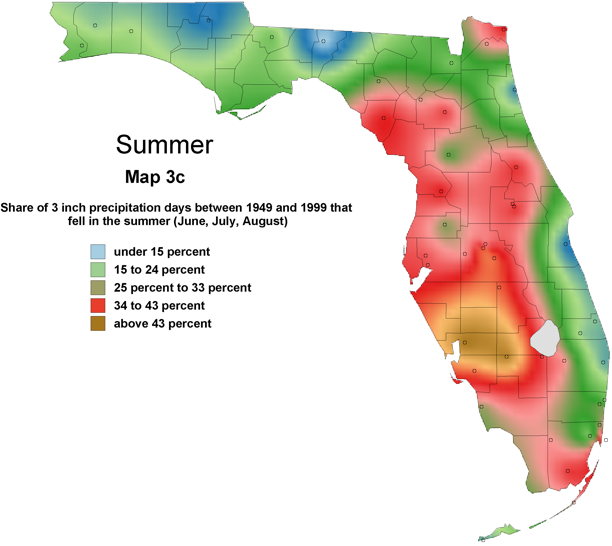
The close association of heat and Florida's heavy rain is clearly shown through an examination of the frequency of torrential rain at the 48 weather stations (Table 1a), by season (Table 1b) and by month Table 1c). During the period December through February, here designated the winter months, between 1949 and 1999 only 11 percent of the total storms at the 48 weather stations occurred. In the spring (March through May) the share was 21.4, for summer (June through August) the share was 33.7 percent, and in the fall (September through November) it reached 33.9 percent share. September was the month with the largest share of these rainstorms (16.7 percent), followed by June (15.1 percent) and October (11.3 percent. During the winter months the weather was most calm, for December the share was (3.3 percent), for January (3.5 percent), and for February (4.2 percent).
It should be noted that the monthly frequencies of torrential rain, if graphed, do not conform to a bell shaped curve, increasing to a peak in the hottest month of the year. Instead, the curve is bi-modal, there being two peaks, one in June and the other in September. It is presumed that the June peak is the result of the state then coming strongly under the influence of the intertropical convergence zone, and the September peak is due to the greater frequency in that month of tropical low pressure systems such as tropical storms reaching the state.
|
|
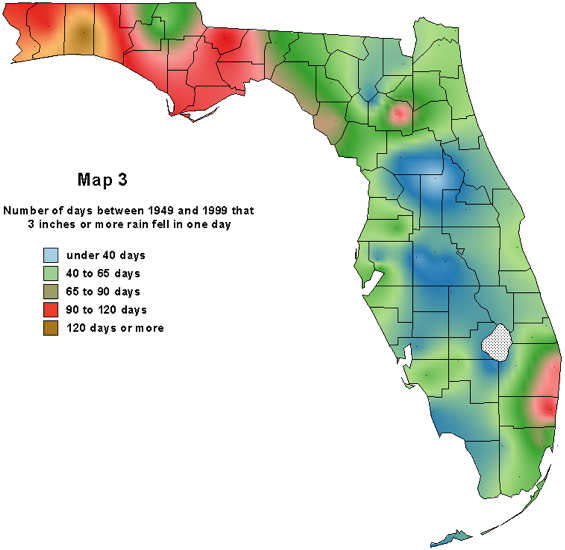
Since the controls of precipitation differ in their importance throughout the state there is great geographical variation in the frequency of torrential rain. In two sections of the state heavy rainstorms are most frequent, the Panhandle and the Gold Coast (Map 3). The paths of tropical waves, tropical storms, and hurricanes more frequently pass through these two areas than elsewhere in the state. In addition, in the Panhandle during the winter, mid-latitude low pressure systems pass through, some of which are capable of producing tremendous amounts of rain during a short period. To ascertain if the controls that produce truly heavy rainstorms, those with 5 inches or more of rain, differ from those that produce storms of 3 to 3.99 inches, the frequencies of both for the 48 weather stations were compared. The resultant correlation (r=70) was impressive and suggests that the meteorological controls that generate these storms are similar for storms of various intensities.
|
|
|
|
|
|
|
|
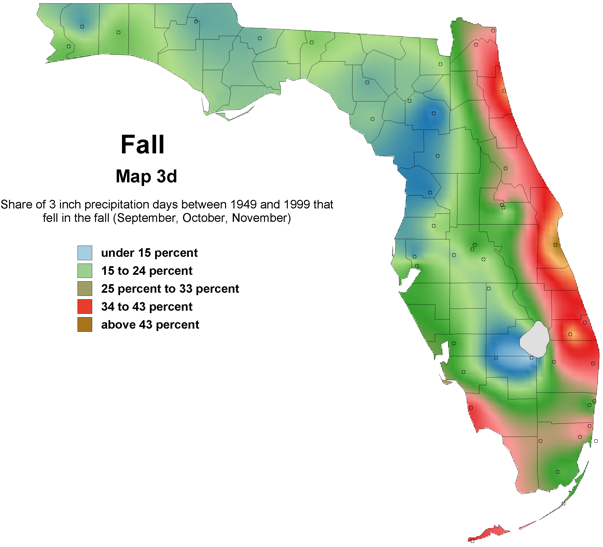
The distribution of frequencies of rainstorms shown on Maps 3a-3d, also illustrate another characteristic of Florida's rainstorms. They are far more frequent close to the sea than in the interior. Storms that enter the state from these waterbodies rapidly dissipate there ability to produce rain as they progress into its interior. With few exceptions those weather stations in which there were the fewest rainstorms were located in the interior of the peninsula.
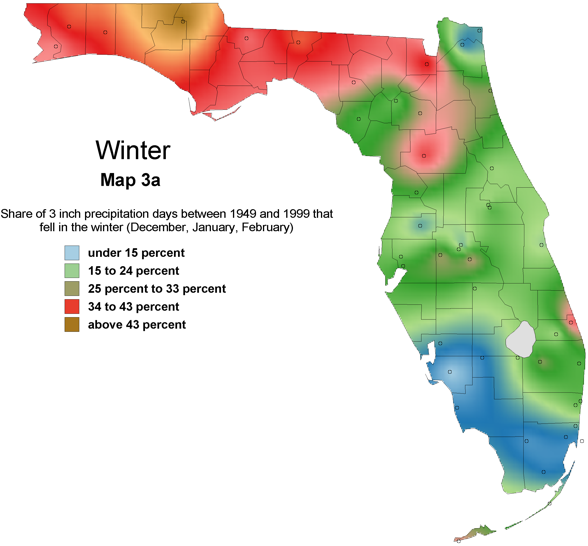
Further evidence of the variation in the importance of weather controls throughout Florida can be seen in differences throughout the state in the season of greatest frequency of torrential storms ( Maps 3a-d). For most of the state the warm months are those that most frequently experience heavy rain. Half (24) of the stations reported the summer as having the most rainstorms. 31 percent of the stations had a fall maximum. Some weather stations had extraordinarily high concentrations of rainstorms during the summer, most notably those on the west side of the peninsula and in the interior. Around 45 percent of all torrential rainstorms at the stations in Avon Park, Fort Myers, La Belle, and Mountain Lake occurred between June and August. For those at Everglades and Punta Gorda it was even higher, 53 percent. Several stations on the East Coast had extremely high heavy rain concentrations in the fall. For Fort Pierce and St. Augustine it was slightly over half, and for Key West it was almost 45 percent. These high shares, no doubt, are a consequence of the frequency of hurricanes and other tropical storms during this period.
Table 1a: Frequency of Rain in Florida 1949-1999
| No rain | .001" - .099" | .100" - .499" | .500" - .999" | 1.0" - 1.99" | 2.0" - 2.99" | 3.0" - 3.99" | 4.0" - 4.99" | 5.0" - 5.99" | 6.0" - 6.99" | 7.0" + | |
| Apalachicola | 13273 | 1704 | 1921 | 813 | 622 | 172 | 56 | 24 | 14 | 7 | 8 |
| Avon Park | 13047 | 1595 | 2237 | 929 | 615 | 136 | 34 | 11 | 5 | 3 | 2 |
| Belle Glade | 12174 | 2387 | 2280 | 942 | 625 | 138 | 48 | 11 | 5 | 3 | 1 |
| Chipley | 12830 | 1777 | 2058 | 1051 | 681 | 148 | 45 | 17 | 3 | 4 | 3 |
| Clermont | 13110 | 1595 | 2233 | 926 | 533 | 159 | 39 | 14 | 4 | 1 | 1 |
| Clewiston | 13173 | 1766 | 2126 | 845 | 523 | 136 | 24 | 12 | 6 | 1 | 2 |
| Cross City | 13134 | 1496 | 2082 | 972 | 670 | 164 | 64 | 15 | 9 | 4 | 4 |
| Deland | 12646 | 1685 | 2400 | 1011 | 675 | 137 | 34 | 17 | 6 | 1 | 2 |
| Everglades | 12709 | 1951 | 2154 | 963 | 621 | 142 | 47 | 17 | 5 | 3 | 2 |
| Fernandina Beach | 12917 | 1903 | 2159 | 885 | 532 | 147 | 40 | 15 | 8 | 5 | 3 |
| Ft. Lauderdale | 12104 | 2086 | 2453 | 1030 | 651 | 169 | 74 | 22 | 13 | 6 | 7 |
| Ft. Myers | 12964 | 1744 | 2113 | 936 | 639 | 143 | 47 | 15 | 9 | 3 | 2 |
| Ft. Pierce | 11912 | 2623 | 2332 | 947 | 582 | 144 | 52 | 12 | 7 | 3 | 1 |
| Gainesville | 12805 | 1881 | 2230 | 915 | 572 | 148 | 43 | 16 | 3 | 2 | 0 |
| Glen St.Mary | 13310 | 1171 | 2309 | 954 | 641 | 164 | 41 | 12 | 6 | 4 | 2 |
| High Spring | 13266 | 1547 | 2008 | 902 | 663 | 176 | 32 | 8 | 7 | 4 | 1 |
| Inverness | 13078 | 1537 | 2149 | 1022 | 621 | 147 | 45 | 6 | 4 | 3 | 2 |
| Jacksonville | 12740 | 2021 | 2160 | 904 | 578 | 143 | 40 | 14 | 5 | 4 | 6 |
| Key West | 13146 | 2312 | 1961 | 691 | 362 | 89 | 31 | 10 | 5 | 4 | 4 |
| La Belle | 13047 | 1688 | 2098 | 920 | 612 | 173 | 50 | 18 | 4 | 4 | 1 |
| Lake Alford | 13034 | 1745 | 2158 | 885 | 581 | 150 | 48 | 9 | 4 | 0 | 1 |
| Lakeland | 12573 | 2265 | 2125 | 879 | 598 | 132 | 32 | 7 | 2 | 3 | 0 |
| Mayo | 13132 | 1528 | 2093 | 980 | 643 | 160 | 47 | 20 | 7 | 3 | 3 |
| Melbourne | 13240 | 1748 | 2025 | 867 | 552 | 111 | 48 | 10 | 9 | 2 | 2 |
| Miami | 12932 | 2382 | 1484 | 937 | 625 | 163 | 51 | 22 | 4 | 7 | 8 |
| Miami Beach | 12541 | 2457 | 2233 | 716 | 454 | 136 | 44 | 18 | 8 | 5 | 2 |
| Milton | 13541 | 1793 | 1084 | 1145 | 735 | 198 | 63 | 24 | 10 | 6 | 14 |
| Monticello | 12688 | 1954 | 2109 | 977 | 639 | 164 | 51 | 18 | 8 | 8 | 0 |
| Mountain Lake | 12827 | 1881 | 2234 | 898 | 575 | 151 | 35 | 13 | 0 | 1 | 0 |
| Naples | 12574 | 2147 | 2172 | 885 | 625 | 156 | 23 | 21 | 4 | 8 | 0 |
| Niceville | 13838 | 898 | 1817 | 942 | 705 | 262 | 80 | 33 | 17 | 7 | 16 |
| Ocala | 12533 | 2032 | 2296 | 983 | 581 | 137 | 33 | 13 | 1 | 2 | 2 |
| Orlando | 12726 | 1972 | 2231 | 944 | 560 | 127 | 39 | 10 | 4 | 1 | 1 |
| Pensacola | 12969 | 1643 | 2012 | 984 | 686 | 190 | 70 | 34 | 16 | 5 | 5 |
| Pompano | 12193 | 2084 | 2421 | 915 | 714 | 184 | 46 | 8 | 11 | 11 | |
| Punta Gorda | 13313 | 1506 | 2106 | 900 | 592 | 139 | 33 | 17 | 0 | 7 | 2 |
| Royal Palm | 12073 | 2426 | 2331 | 941 | 583 | 185 | 39 | 20 | 10 | 0 | 7 |
| St. Augustine | 12912 | 1955 | 2067 | 893 | 569 | 147 | 38 | 19 | 8 | 2 | 4 |
| St. Leo | 12939 | 1689 | 2207 | 924 | 634 | 152 | 44 | 14 | 4 | 3 | 5 |
| St. Petersburg | 13658 | 1235 | 1991 | 912 | 586 | 149 | 54 | 17 | 6 | 3 | 4 |
| Stuart | 11683 | 2337 | 2734 | 994 | 648 | 153 | 36 | 15 | 4 | 5 | 5 |
| Tallahassee | 12743 | 1795 | 2075 | 1001 | 699 | 187 | 69 | 26 | 12 | 4 | 6 |
| Tamiami | 12451 | 2016 | 2358 | 980 | 582 | 166 | 36 | 18 | 5 | 2 | 1 |
| Tampa | 13199 | 1900 | 1966 | 837 | 543 | 116 | 37 | 9 | 4 | 0 | 3 |
| Tavernier | 13826 | 1437 | 1875 | 775 | 489 | 124 | 40 | 25 | 10 | 7 | 5 |
| Titusville | 13172 | 1299 | 2346 | 911 | 655 | 169 | 37 | 11 | 7 | 3 | 4 |
| Winter Haven | 12704 | 1993 | 2209 | 931 | 595 | 146 | 22 | 9 | 4 | 2 | 0 |
| W. Palm Beach | 11827 | 2353 | 2528 | 1010 | 628 | 161 | 58 | 21 | 13 | 7 | 8 |
| Average | 12858 | 1855 | 2140 | 927 | 606 | 154 | 45 | 16 | 7 | 4 | 4 |
Table 1b: Share of Torrential Rain by Season (based on records between 1949 and 1999
| Winter | Spring | Summer | Fall | Total | |
| Apalachicola | 0.101 | .0183 | 0.367 | 0.349 | 1.000 |
| Avon Park | 0.093 | 0.185 | 0.444 | 0.278 | 1.000 |
| Belle Glade | 0.132 | 0.103 | 0.368 | 0.397 | 1.000 |
| Chipley | 0.257 | 0.300 | 0.186 | 0.257 | 1.000 |
| Clermont | 0.085 | 0.119 | 0.458 | 0.339 | 1.000 |
| Clewiston | 0.089 | 0.333 | 0.400 | 0.178 | 1.000 |
| Cross City | 0.106 | 0.191 | 0.426 | 0.277 | 1.000 |
| Deland | 0.086 | 0.121 | 0.414 | 0.379 | 1.000 |
| Everglades | 0.028 | 0.155 | 0.521 | 0.296 | 1.000 |
| Fernandina Beach | 0.058 | 0.130 | 0.420 | 0.391 | 1.000 |
| Ft. Lauderdale | 0.101 | 0.244 | 0.328 | 0.328 | 1.000 |
| Ft. Myers | 0.013 | 0.224 | 0.447 | 0.316 | 1.000 |
| Ft. Pierce | 0.080 | 0.160 | 0.240 | 0.520 | 1.000 |
| Gainesville | 0.141 | 0.234 | 0.274 | 0.290 | 1.000 |
| Glen St. Mary | 0.194 | 0.242 | 0.274 | 0.290 | 1.000 |
| High Spring | 0.098 | 0.275 | 0.353 | 0.275 | 1.000 |
| Inverness | 0.119 | 0.220 | 0.424 | 0.237 | 1.000 |
| Jacksonville | 0.043 | 0.188 | 0.362 | 0.406 | 1.000 |
| Key West | 0.148 | 0.185 | 0.222 | 0.444 | 1.000 |
| La Belle | 0.041 | 0.233 | 0.521 | 0.205 | 1.000 |
| Lake Alford | 0.066 | 0.213 | 0.377 | 0.344 | 1.000 |
| Lakeland | 0.136 | 0.227 | 0.364 | 0.273 | 1.000 |
| Mayo | 0.156 | 0.247 | 0.338 | 0.260 | 1.000 |
| Melbourne | 0.072 | 0.174 | 0.188 | 0.565 | 1.000 |
| Miami | 0.043 | 0.283 | 0.272 | 0.402 | 1.000 |
| Miami Beach | 0.065 | 0.182 | 0.338 | 0.416 | 1.000 |
| Milton | 0.197 | 0.316 | 0.239 | 0.248 | 1.000 |
| Monticello | 0.202 | 0.345 | 0.143 | 0.310 | 1.000 |
| Mountain Lake | 0.143 | 0.122 | 0.449 | 0.286 | 1.000 |
| Naples | 0.037 | 0.185 | 0.333 | 0.444 | 1.000 |
| Niceville | 0.197 | 0.224 | 0.259 | 0.320 | 1.000 |
| Ocala | 0.176 | 0.255 | 0.314 | 0.255 | 1.000 |
| Orlando | 0.1090 | 0.200 | 0.418 | 0.273 | 1.000 |
| Pensacola | 0.156 | 0.242 | 0.281 | 0.320 | 1.000 |
| Pompano | 0.102 | 0.235 | 0.286 | 0.378 | 1.000 |
| Punta Gorda | 0.055 | 0.073 | 0.527 | 0.345 | 1.000 |
| Royal Palm | 0.041 | 0.219 | 0.411 | 0.329 | 1.000 |
| St. Augustine | 0.130 | 0.159 | 0.203 | 0.507 | 1.000 |
| St. Leo | 0.057 | 0.314 | 0.329 | 0.300 | 1.000 |
| St. Petersburg | 0.119 | 0.143 | 0.393 | 0.345 | 1.000 |
| Stuart | 0.172 | 0.172 | 0.234 | 0.422 | 1.000 |
| Tallahassee | 0.162 | 0.291 | 0.282 | 0.265 | 1.000 |
| Tamiami | 0.033 | 0.217 | 0.367 | 0.383 | 1.000 |
| Tampa | 0.094 | 0.264 | 0.396 | 0.245 | 1.000 |
| Tavernier | 0.096 | 0.181 | 0.349 | 0.373 | 1.000 |
| Titusville | 0.066 | 0.115 | 0.410 | 0.410 | 1.000 |
| Winter Haven | 0.083 | 0.111 | 0.389 | 0.417 | 1.000 |
| W. Palm Beach | 0.106 | 0.240 | 0.221 | 0.433 | 1.000 |
| Average | 0.110 | 0.214 | 0.337 | 0.339 | 1.000 |
An effort was made to determine for all 48 weather stations which season of the year could be thought of as being truly one of rainstorms. Although arbitrary, the season chosen had to have at least one-third of the rainstorms during the 51-year period. This resulted in seventeen weather stations that have two rather than one season with one-third of the total. Of those stations that had two seasons, all but one had a summer and fall concentration. In half of them the largest of the two concentrations was the summer. The Clewiston station, situated on the southwestern shore of Lake Okeechobee, is the only station with a spring and summer concentration. Of those stations in which only one season dominated, summer had the larger share. Nine stations reported no season as having at least one-third of a year's torrential rain, six of them in North Florida (seven if Ocala is included among them). The absence of a rainstorm season in North Florida is because the frequency of heavy rain is almost as great in the cold months as in the warmer ones. Two North Florida weather stations< Chipley and Milton were notable exceptions. Over half the heavy rainstorms at both that occurred during the 51-year period were in the winter and spring.
Table 1c: Frequency of Torrential Rains by Month (based on records between 1949 and 1999)
| Jan | Feb | Mar | Apr | May | Jun | Jul | Aug | Sep | Oct | Nov | Dec | Total | |
| Apalachicola | 3 | 5 | 6 | 8 | 6 | 9 | 13 | 18 | 25 | 12 | 1 | 3 | 109 |
| Avon Park | 1 | 3 | 3 | 2 | 5 | 14 | 5 | 5 | 8 | 4 | 3 | 1 | 54 |
| Belle Glade | 5 | 0 | 3 | 3 | 1 | 10 | 7 | 8 | 11 | 10 | 6 | 4 | 68 |
| Chipley | 7 | 6 | 10 | 7 | 4 | 5 | 5 | 3 | 8 | 4 | 6 | 5 | 70 |
| Clermont | 3 | 0 | 4 | 2 | 1 | 12 | 6 | 9 | 13 | 2 | 5 | 2 | 59 |
| Clewiston | 2 | 1 | 4 | 3 | 8 | 13 | 1 | 4 | 1 | 5 | 2 | 1 | 45 |
| Cross City | 3 | 2 | 4 | 9 | 5 | 9 | 16 | 15 | 20 | 5 | 1 | 5 | 94 |
| Deland | 3 | 2 | 2 | 2 | 3 | 5 | 9 | 10 | 11 | 10 | 1 | 0 | 58 |
| Everglades | 0 | 1 | 3 | 2 | 6 | 24 | 6 | 7 | 13 | 4 | 4 | 1 | 71 |
| Fernandina Beach | 0 | 2 | 2 | 2 | 5 | 6 | 8 | 15 | 15 | 9 | 3 | 2 | 69 |
| Ft. Lauderdale | 2 | 5 | 3 | 9 | 17 | 23 | 7 | 9 | 15 | 17 | 7 | 5 | 119 |
| Ft. Myers | 0 | 0 | 7 | 1 | 9 | 20 | 4 | 10 | 14 | 7 | 3 | 1 | 76 |
| Ft. Pierce | 0 | 4 | 5 | 4 | 3 | 5 | 3 | 10 | 17 | 17 | 5 | 2 | 75 |
| Gainseville | 2 | 3 | 3 | 6 | 6 | 11 | 3 | 12 | 9 | 5 | 0 | 4 | 64 |
| Glen St. Mary | 2 | 5 | 3 | 7 | 5 | 7 | 3 | 7 | 10 | 7 | 1 | 5 | 65 |
| High Spring | 0 | 3 | 3 | 5 | 6 | 7 | 4 | 7 | 9 | 3 | 2 | 2 | 51 |
| Inverness | 2 | 2 | 7 | 1 | 5 | 10 | 5 | 10 | 7 | 5 | 2 | 3 | 59 |
| Jacksonville | 0 | 3 | 5 | 2 | 6 | 8 | 5 | 12 | 21 | 7 | 0 | 0 | 69 |
| Key West | 5 | 1 | 1 | 3 | 6 | 7 | 1 | 4 | 10 | 9 | 5 | 2 | 54 |
| La Belle | 3 | 0 | 7 | 1 | 9 | 21 | 9 | 8 | 5 | 7 | 3 | 0 | 73 |
| Lake Alford | 3 | 1 | 5 | 3 | 5 | 13 | 6 | 4 | 13 | 3 | 5 | 0 | 61 |
| Lakeland | 1 | 3 | 3 | 3 | 4 | 6 | 6 | 4 | 7 | 0 | 5 | 2 | 44 |
| Mayo | 4 | 7 | 8 | 6 | 5 | 6 | 8 | 12 | 11 | 8 | 1 | 1 | 77 |
| Melbourne | 3 | 2 | 6 | 1 | 5 | 5 | 3 | 5 | 14 | 14 | 11 | 0 | 69 |
| Miami | 0 | 2 | 4 | 6 | 16 | 17 | 2 | 6 | 13 | 16 | 8 | 2 | 92 |
| Miami Beach | 1 | 3 | 0 | 4 | 10 | 16 | 2 | 8 | 12 | 14 | 6 | 1 | 77 |
| Milton | 7 | 10 | 16 | 11 | 10 | 14 | 9 | 5 | 12 | 12 | 5 | 6 | 117 |
| Monticello | 3 | 9 | 11 | 14 | 4 | 5 | 6 | 1 | 14 | 8 | 4 | 5 | 84 |
| Mountain Lake | 2 | 4 | 2 | 0 | 4 | 12 | 4 | 6 | 7 | 3 | 4 | 1 | 49 |
| Naples | 2 | 0 | 5 | 1 | 4 | 11 | 3 | 4 | 15 | 7 | 2 | 0 | 54 |
| Niceville | 7 | 13 | 9 | 16 | 8 | 13 | 14 | 11 | 22 | 17 | 8 | 9 | 147 |
| Ocala | 3 | 3 | 4 | 6 | 3 | 10 | 3 | 3 | 4 | 7 | 2 | 3 | 51 |
| Orlando | 3 | 1 | 6 | 4 | 1 | 11 | 6 | 6 | 7 | 4 | 4 | 2 | 55 |
| Pensacola | 8 | 9 | 18 | 7 | 6 | 15 | 10 | 11 | 19 | 15 | 7 | 3 | 128 |
| Pompano Beach | 2 | 5 | 5 | 6 | 12 | 13 | 7 | 8 | 10 | 20 | 7 | 3 | 98 |
| Punta Gorda | 2 | 0 | 2 | 0 | 2 | 15 | 7 | 7 | 13 | 4 | 2 | 1 | 55 |
| Royal Palm S. | 1 | 2 | 0 | 5 | 11 | 18 | 5 | 7 | 13 | 8 | 3 | 0 | 73 |
| St. Augustine | 1 | 5 | 5 | 5 | 1 | 3 | 2 | 9 | 18 | 11 | 6 | 3 | 69 |
| St. Leo | 0 | 2 | 11 | 1 | 10 | 11 | 6 | 6 | 14 | 3 | 4 | 2 | 70 |
| St. Petersburg | 4 | 3 | 4 | 3 | 5 | 11 | 12 | 10 | 23 | 2 | 4 | 3 | 84 |
| Stuart | 3 | 3 | 4 | 1 | 6 | 10 | 2 | 3 | 6 | 14 | 7 | 5 | 64 |
| Tallahassee | 4 | 7 | 16 | 7 | 11 | 12 | 15 | 6 | 15 | 9 | 7 | 8 | 117 |
| Tamiami | 0 | 2 | 3 | 3 | 7 | 13 | 3 | 6 | 12 | 9 | 2 | 0 | 60 |
| Tampa | 2 | 2 | 6 | 2 | 6 | 5 | 9 | 7 | 10 | 0 | 3 | 1 | 53 |
| Tavernier | 5 | 1 | 0 | 4 | 11 | 18 | 5 | 6 | 7 | 15 | 9 | 2 | 83 |
| Titusville | 2 | 1 | 3 | 3 | 1 | 8 | 8 | 9 | 13 | 9 | 3 | 1 | 61 |
| Winter Haven | 0 | 2 | 2 | 0 | 2 | 3 | 6 | 5 | 8 | 1 | 6 | 1 | 36 |
| W. Palm Beach | 7 | 0 | 8 | 9 | 8 | 13 | 2 | 8 | 16 | 16 | 13 | 4 | 104 |
| Total | 123 | 150 | 251 | 210 | 294 | 533 | 291 | 366 | 590 | 398 | 208 | 117 | 3531 |
Predicting Torrential Rain
Much can be learned about future weather through an analysis of weather history. A study of daily precipitation for 51 years for 48 Florida weather stations has made it possible to draw a number of general conclusions as to the frequency of Florida rainstorms over time, both yearly and monthly, as well as within space. Some of these generalities make it possible to draw conclusions about where and how often future rainstorms will occur.
|
|
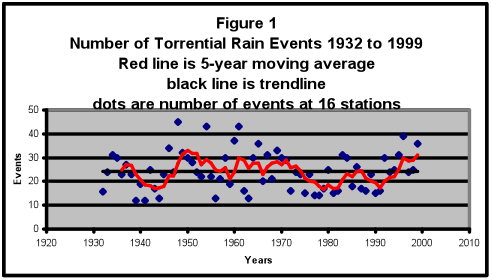
More problematic is the use of the past to identify cyclical trends to enable those who must prepare for severe weather to better predict the future. To ascertain whether, over the 51-year weather records for 16 stations for which daily weather data were at least 90 percent complete in order to ascertain if there were discernable cycles of rainstorm frequency (Figure 1). A five year moving average was also added. The high fluctuation from year to year of the actual frequency is typical of storms in tropical and subtropical climates. However, when the curves are smoothed by submitting the actual data to a five-year average it can be seen that for most of the period the annual differences was relatively small, between about 15 and 30 storms. Except for the period between 1965 and 1971, when there was a substantial increase in the number of severe rainstorms, there appear to be no regular oscillations of the frequencies nor were any regularities identified when the data were organized by decade (Table 5).
Table 4: Percentage Chance of Torrential Rain (3 inches or more in one day) in an Average Year Between 1949 and 1999 by ENSO Phases (base: 48 Florida Weather Stations)
| Phase | # Years | None | 1 Times | 2 Times | 3 Times | 4 Times | 5 Times | 6 Times | 7 Times | Total |
| El Niño | 13 | 32.05% | 32.53% | 17.79% | 9.78% | 5.61% | 1.76% | .48% | None | 100.00 |
| Neutral | 26 | 25.64 | 33.25 | 19.47 | 13.06 | 4.82 | 2.40 | .64 | .72 | 100.00 |
| La Niña | 12 | 27.95 | 28.82 | 21.70 | 12.85 | 5.03 | 1.91 | .87 | .87 | 100.00 |
| Total | 51 | 27.82 | 32.03 | 19.57 | 12.17 | 5.07 | 2.12 | .65 | .57 | 100.00 |
The ENSO (El Niño Southern Oscillation) phenomenon, which has been given much justified attention in recent years, is now generally regarded as being able to influence climate over a huge area of the world. It would be irresponsible to ignore the possibility that it could influence the frequency of Florida rainstorms. To ascertain if there is a relationship the three phases of Enso (El Niño, La Niña, and the neutral phase) the frequency of rainstorms were calculated by ENSO phase (Table 4). There does appear to be a relationship, and it doesn't seem to be spurious. The share of the 48 Florida weather stations that reported no torrential rainstorms during a year is somewhat higher during the El Niño phase than the other two. The share of stations that reported only one storm during the years of the El Niño phase also was higher than the share of those that were reported in the La Niña phase. Thereafter, except for the shares of the 'four storm' category, the La Niña phase produced more torrential storms than the El Niño phase. In South Florida, It has become generally accepted that in La Niña years precipitation is generally wetter than during the El Niño phase. From the data we might conclude that weather controls that become important during this phase also promote a higher frequency of torrential rain. The neutral phase of Enso has little to no effect upon the frequency of Florida's rainstorms, some neutral years producing many more episodes of torrential rain than others.
In conclusion it would be derelict not to address the issue of the relationship between the frequency of torrential rain in Florida and global warming. In studies of the consequence of global warming on climate the possibility of greater climatic extremes has been predicted, including storms that could produce large amounts of precipitation. This is usually based on the assumption among other factors, that the temperature of the water of the oceans would rise, heating the air above them, increasing evaporation and the air's ability to hold water vapor and consequently its ability to produce more powerful rainstorms.
Table 5: Number of times 48 Florida weather stations experienced at least 3" of rainfall for five decades between 1950 and 1999.
| none | 1 time | 2 times | 3 times | 4 times | 5 times | 6 times | 7+ times | 3"+freq | |
| 1950-59 | 168 | 164 | 75 | 37 | 26 | 8 | 2 | 0 | 312 |
| 1960-69 | 108 | 130 | 109 | 75 | 36 | 15 | 4 | 3 | 372 |
| 1970-79 | 130 | 168 | 88 | 63 | 17 | 9 | 3 | 2 | 350 |
| 1980-89 | 131 | 176 | 94 | 45 | 18 | 10 | 2 | 4 | 349 |
| 1990-99 | 134 | 129 | 102 | 68 | 27 | 10 | 5 | 5 | 346 |
| Ave. | 134.2 | 153.4 | 93.6 | 57.6 | 24.8 | 10.4 | 3.2 | 2.8 |
To ascertain if Florida has been experiencing an increase in the number of storms that produce torrential rain the torrential storm data for the 48 stations within the state which became the primary data source for this study were divided into the five decades between 1950 and 1999 (Table 5). When the average for the 50-year period is compared to the frequency by decade no trend is discovered. When the frequency in earlier decades is compared with the later ones there also appears to be no trend. For example, between 1950 and 1969, during that 20-year period there were 684 episodes at the 48 Florida weather stations in which 3 inches or more rain fell in one day, while in the 20-year period between 1980 and 1999 there were 695 episodes, a difference of only eleven episodes. The frequency of episodes during the year was also examined. An examination reveals, for example, that there were 23 stations between 1950 and 1969 that reported five episodes during the 20-year period, and between 1980 and 1999 the number fell to 20. Such a small drop does not suggest an increase in torrential rain over time.