
Prepared by Florida Climate Center
The Florida State University
Tallahassee, FL

Summary:
- Average monthly temperatures in March were above normal.
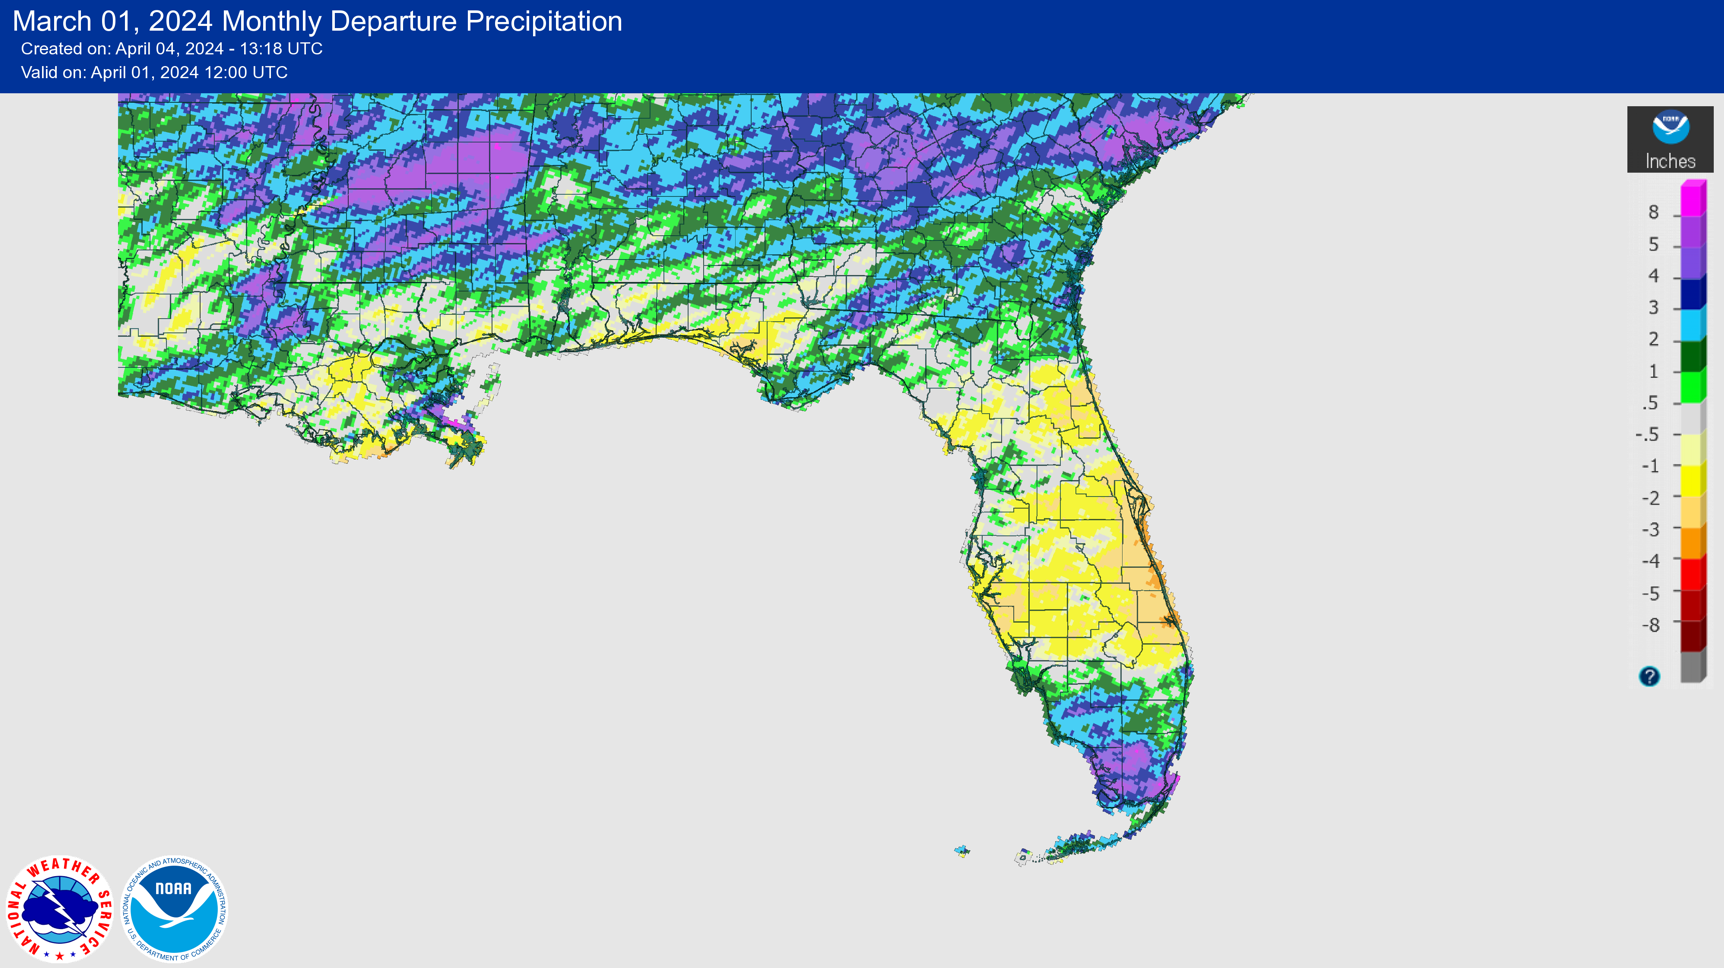
- Monthly precipitation totals in March were variable, with above normal rainfall in South Florida and parts of North Florida, while central Florida and parts of the Panhandle had below normal rainfall.
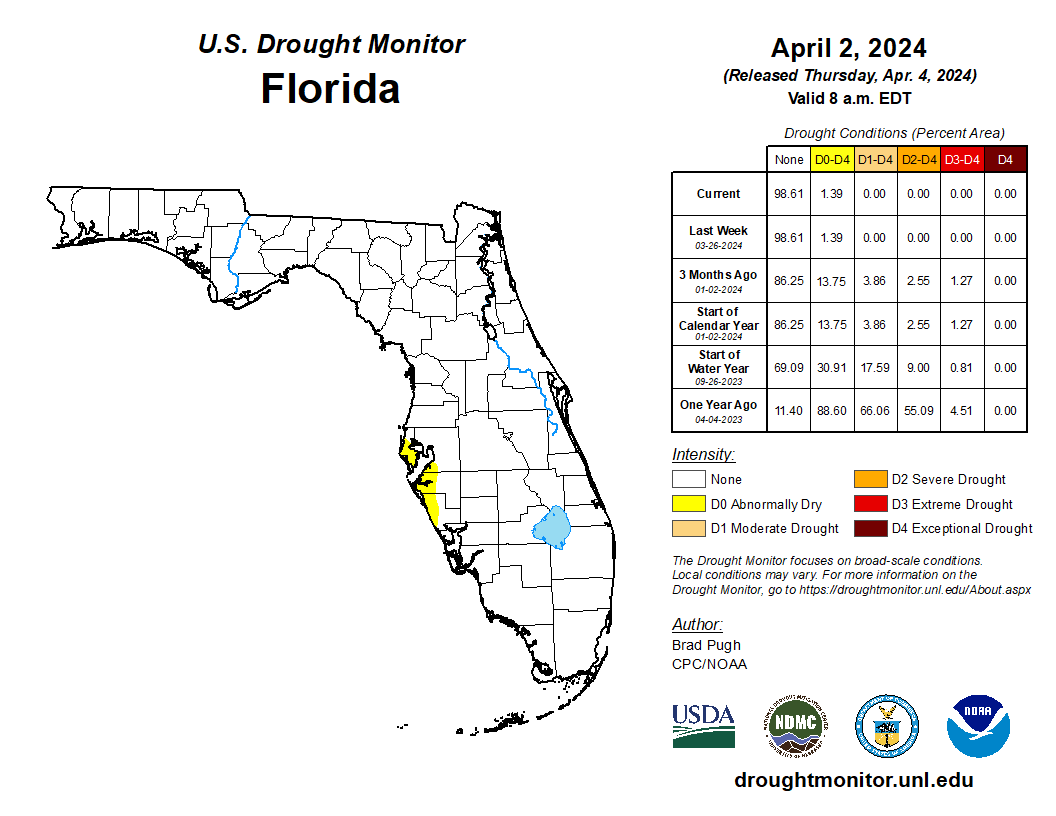
- Florida remained drought free in March, with abnormally dry conditions lingering in coastal west-central Florida.
- A transition to ENSO-neutral conditions is expected April-June 2024 (83% chance), with a good chance of a transition to La Niña during August-October (82% chance).
Average monthly temperatures in March were above normal. Average temperature departures from normal ranged from +0.7 ̊F in Pensacola to +4.4 ̊F in Orlando for the month (see Table 1 and Appendix 1 for select cities). Southern and central Florida were the warmest areas of the state in March; Key West and Ft. Lauderdale had their 3rd-warmest March on record, and March 2024 ranked in the top five warmest on record for several other locations. Several daily high maximum and high minimum temperature records were broken during the month.
Table 1. March average temperatures and departures from normal ( ̊F) for selected cities.
| Station | Mean Temperature | Departure from Normal |
| Pensacola | 63.0 | +0.7 |
| Tallahassee | 64.9 | +3.5 |
| Jacksonville | 65.5 | +3.1 |
| Orlando | 71.7 | +4.4 |
| Tampa | 71.7 | +3.1 |
| Miami | 75.8 | +2.7 |
| Key West | 77.6 | +3.2 |
Monthly rainfall totals in March were variable across Florida. The monthly precipitation departures from normal ranged from -1.64 inches in Orlando to +3.40 inches in Key West (see Table 2 and Appendix 1 for select locations). Areas that received the most rainfall during the month were in South Florida and around Apalachicola in the Panhandle. The driest areas of the state were in east-central Florida. While this year’s El Niño has brought ample rainfall in Florida, we have not seen as much rain compared with past strong El Niño events.
Table 2. March precipitation totals and departures from normal (inches) for selected cities.
| Station | Total Rainfall | Departure from Normal |
| Pensacola | 5.25 | 0.00 |
| Tallahassee | 7.67 | +2.43 |
| Jacksonville | 5.69 | +2.40 |
| Orlando | 1.39 | -1.64 |
| Tampa | 2.57 | +0.05 |
| Miami | 4.78 | +2.32 |
| Key West | 4.39 | +3.40 |
Figure 1. A graphical depiction of the monthly rainfall departure from normal (inches) for March (courtesy of NOAA, NWS).
El Niño Advisory.
El Niño conditions, the warm phase of the El Niño Southern Oscillation climate pattern in the tropical equatorial Pacific Ocean, continued but the coupled ocean-atmosphere system reflects a weakening El Niño. A transition to ENSO-neutral conditions is expected this spring during April-June 2024 (83% chance). There are increasing chances of a La Niña developing during June-August (62% chance), which increases to 82% during August-October 2024.
Hazardous Weather Events in March.
According to the Local Storm Reports issued by the local National Weather Service offices serving Florida, there were 226 individual local reports of hazardous weather events recorded across the state during the month of March (see Table 4 for a breakdown by event type). Storms in late March moved through the panhandle, with 2-inch sized hail reported in Gulf County and over 9 inches of rain reported at Lake Lamonia in Leon County. One fatality occurred due to rip currents in Panama City.
Table 3. Breakdown of storm reports submitted in Florida during the month of March (compiled from Iowa State University/Iowa Environmental Mesonet).
| Report Type | Number of Reports |
| Heavy Rain | 23 |
| Flood | 4 |
| Flash Flood | 2 |
| Coastal Flood | 0 |
| Hail | 38 |
| Marine Thunderstorm Wind | 10 |
| Non-Thunderstorm Wind Gust | 80 |
| Non-Thunderstorm Wind Damage | 0 |
| Tornado/Waterspout/Funnel Cloud | 1/1/2 |
| Thunderstorm Wind Damage | 7 |
| Thunderstorm Wind Gust | 55 |
| Rip Currents | 1 |
| Lightning | 2 |
Daily Record Events in March.
Table 4. Summary of daily records broken or set in Florida in March (source: NCEI Daily Weather Records).
| Category | Number of Records |
| Highest daily max. temp. | 21 |
| Highest daily min. temp. | 38 |
| Lowest daily max. temp. | 1 |
| Lowest daily min. temp. | 1 |
| Highest daily precipitation | 24 |
| Total | 85 |
Weather/Climate Highlights of the Month: Early hurricane season forecasts predict an extremely active Atlantic hurricane season this year.
Colorado State University recently released its April forecast for the 2024 Atlantic hurricane season, which calls for a near-record active hurricane season with 23 named storms, 11 hurricanes, and 5 major hurricanes. Accumulated cyclone energy, a measure of the overall energy from all named systems during the season, is predicted to be 210, or 171% of average. The likelihood of a transition to La Nina conditions in the eastern tropical Pacific Ocean around the time of peak hurricane season in combination with record warm ocean temperatures in the tropical and subtropical Atlantic and Gulf of Mexico regions are the main driving factors behind predictions for a hyperactive season. More information can be found on the CSU seasonal hurricane forecasting page: https://tropical.colostate.edu/forecasting.html
Drought-Related Impacts.
Ample rainfall over the past few months has led to drought removal in Florida. During mid-March, approximately 1.4% of the state had abnormally dry (D0) conditions and this had not changed by the end of the month, according to the U.S. Drought Monitor (see Figure 3 below).
As of March 31, the Lake Okeechobee water level was 15.22 ft. above sea level (Feet-NGVD29), which is above average for this time of year. At the first of the month, the water level was 16.15 ft. above sea level.
Figure 2. A graphical depiction of the latest drought conditions in Florida according to the U.S. Drought Monitor (courtesy of the National Drought Mitigation Center, University of Nebraska-Lincoln).
Agriculture-Related Impacts.
Average temperatures were above normal for the month, and a late March frost in northern parts of the state was not severe with only limited damage observed. Rainfall was variable during the month, but much of the state received moderate to heavy amounts of rainfall. Warmer temperatures and rainfall improved pasture and range conditions since February. Overall cattle remained in fair to good condition. Heavy rain, wind, and hail in west-central Florida caused total crop loss for some strawberry and melon producers. Sugarcane operations are near completion, and citrus has started to bloom. Other crops planted and harvested include tomatoes, sweet corn, squash, peppers, avocado, and other tropical fruits. For more information, consult the Crop Progress State Stories, which is published by the USDA’s National Agricultural Statistics Service December through March.
Appendix 1
Additional March departures from normal data for select Florida locations (Source: NWS).
| Station | Average Temperature (˚F) | Departure from Normal (˚F) | Total Rainfall (in.) | Departure from Normal (in.) |
| Gainesville | 65.8 | +3.1 | 3.20 | -0.29 |
| Ocala | 69.2 | +3.9 | 4.27 | +0.59 |
| Sarasota | 71.9 | +3.8 | 1.04 | -1.81 |
| Naples | 73.9 | +3.6 | 5.34 | +3.46 |
| Fort Myers | 73.6 | +3.3 | 2.80 | +0.73 |
| West Palm Beach | 74.3 | +3.2 | 8.01 | +4.70 |