
Prepared by Florida Climate Center
The Florida State University
Tallahassee, FL

Summary:
- Average monthly temperatures in December were generally near to above normal.
- 2023 became the hottest year on record for many stations across the state.
- Monthly precipitation totals in December were above normal, except in the extreme western Panhandle and in central Florida where precipitation was near normal.
- Fort Lauderdale had its wettest year on record in 2023, with 113.61 inches of rainfall which was +52.66 inches above normal; Sarasota had its driest year on record in 2023, with 27.13 inches of rainfall which was -29.15 inches below normal.
- El Niño is expected to persist through the Northern Hemisphere winter, with a 54% chance of a “historically strong” event for the November-January season. A transition to ENSO-neutral conditions is favored during April-June 2024 (60% chance).
Average monthly temperatures in December were generally near to above normal. Average temperature departures from normal ranged from -1.0 ̊F in Key West to +2.2 ̊F in Gainesville for the month (see Table 1 and Appendix 1 for select cities). More moderate temperatures during December meant that no monthly temperature records were set. However, 2023 ended up being the hottest year on record for many stations in the state. See below for more details about where 2023 set an annual record. Select daily high maximum temperature records tied or broken during the month are also provided in Appendix 2.
Table 1. December average temperatures and departures from normal ( ̊F) for selected cities.
| Station | Mean Temperature | Departure from Normal |
| Pensacola | 56.5 | +1.0 |
| Tallahassee | 56.2 | +1.8 |
| Jacksonville | 57.3 | +0.6 |
| Orlando | 65.1 | +1.8 |
| Tampa | 64.9 | 0.0 |
| Miami | 71.2 | 0.0 |
| Key West | 72.0 | -1.0 |
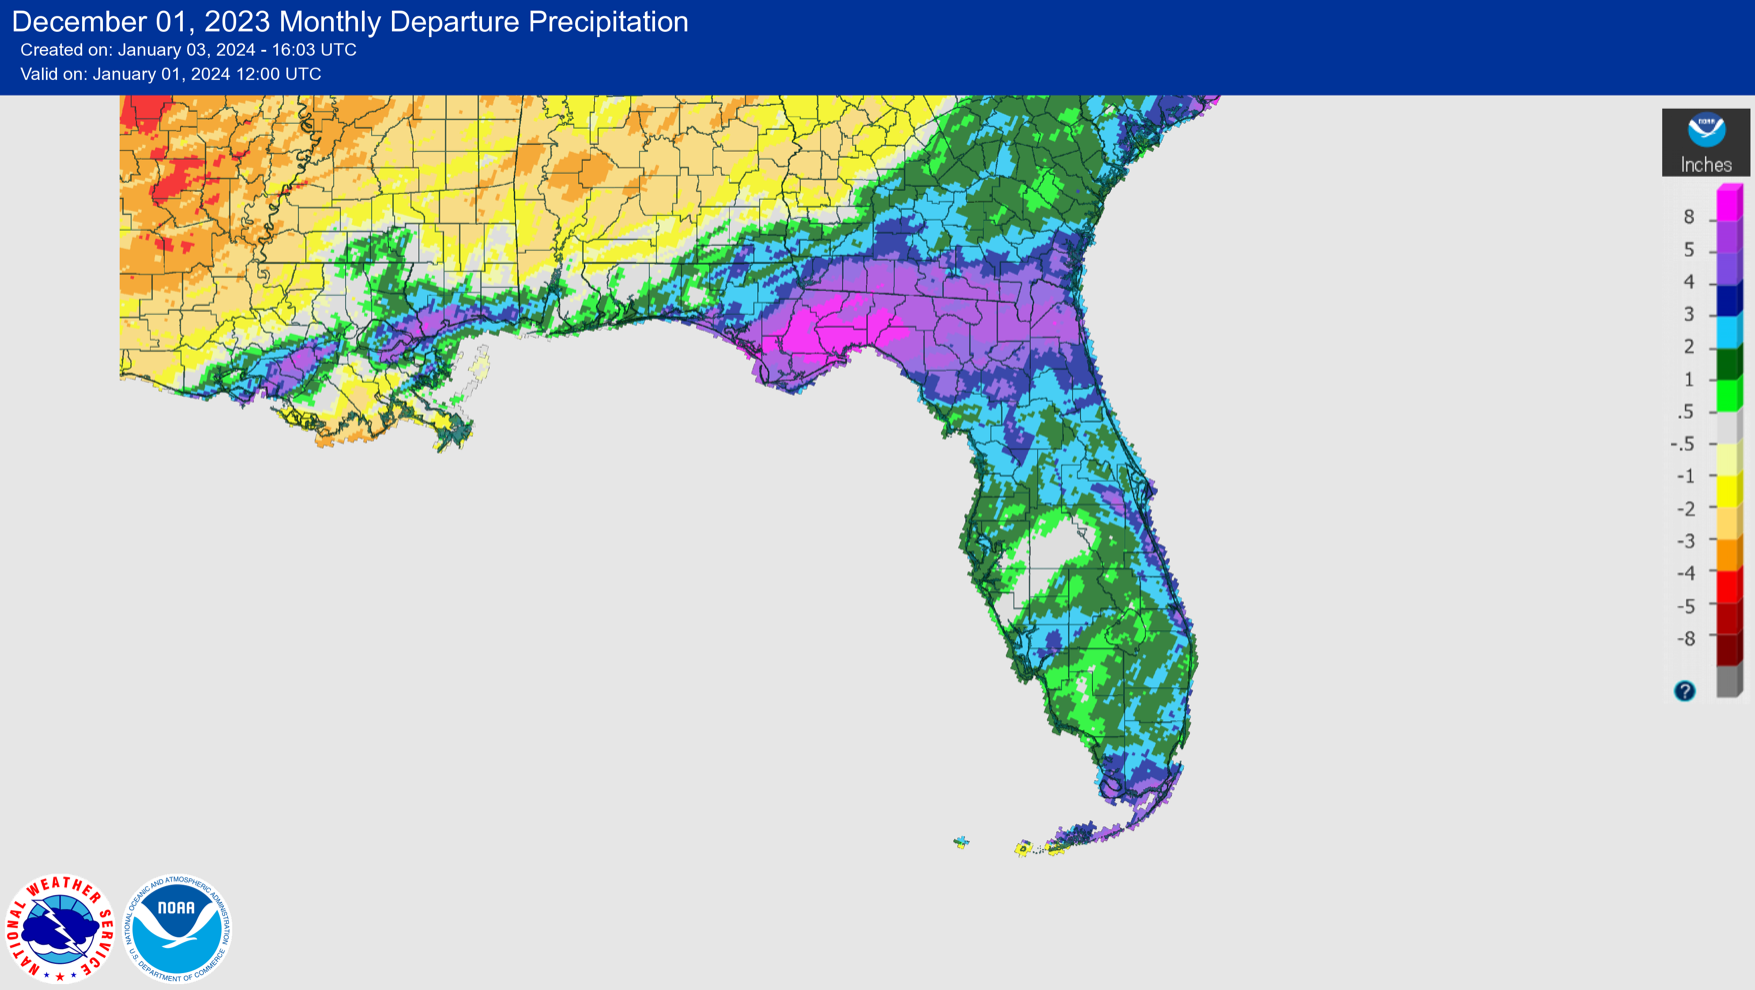
Monthly rainfall totals in December were above normal, except in the extreme western Panhandle and central Florida where it was near normal. The monthly precipitation departures from normal ranged from -0.67 inches in Pensacola to +6.66 inches in Tallahassee (see Table 2 and Appendix 1 for select locations). December was wet and many stations saw one of their top 10-wettest Decembers on record. The wettest area of the state overall was North Florida and the eastern Panhandle, where monthly rainfall totals were over 300% of normal for the month. Southwest Florida also received some much-needed rainfall, which helped to improve drought conditions along southern coastal areas. However, December monthly rainfall totals were not enough to pull the area out of substantial rainfall deficits for the year, and 2023 became a record dry year for southwestern coastal areas.
Table 2. December precipitation totals and departures from normal (inches) for selected cities.
| Station | Total Rainfall | Departure from Normal |
| Pensacola | 4.73 | -0.67 |
| Tallahassee | 10.90 | +6.66 |
| Jacksonville | 6.81 | +4.03 |
| Orlando | 3.67 | +1.19 |
| Tampa | 4.59 | +2.03 |
| Miami | 3.85 | +1.41 |
| Key West | 5.88 | +3.72 |
Figure 1. A graphical depiction of the monthly rainfall departure from normal (inches) for December (courtesy of NOAA, NWS).
El Niño Advisory.
El Niño conditions, the warm phase of the El Niño Southern Oscillation climate pattern in the tropical equatorial Pacific Ocean, is expected to persist through the Northern Hemisphere winter. A transition to ENSO-neutral conditions is favored during April-June 2024, with a 60% chance. The coupled ocean-atmosphere system reflected a strong El Niño during the past month, and there is now a 54% chance of a “historically strong” El Niño (≥ 2.0°C in Niño-3.4) during the November-January season.
Hazardous Weather Events in December.
According to the Local Storm Reports issued by the local National Weather Service offices serving Florida, there were 336 individual local reports of hazardous weather events recorded across the state during the month of December (see Table 4 for a breakdown by event type). Heavy rainfall affected the Panhandle early in the month, with widespread heavy rainfall on the 2nd. Some of the heaviest rainfall reports were in Bay County, with 12.84 inches in Cedar Grove, 8.44 inches in Parker (CoCoRaHS station), and over 7 inches in Panama City. Heavy rainfall was also reported in Gadsden County, including 8.53 inches in Quincy (CoCoRaHS), Leon County with 7.12 inches in Tallahassee (CoCoRaHS), and in Wakulla County, with 8.05 inches in Crawfordville (CoCoRaHS). Mid-month, a Gulf low pressure system crossed over the state bringing another round of locally heavy rainfall, and strong wind gusts of 40-50+ mph were reported.
Table 3. Breakdown of storm reports submitted in Florida during the month of December (compiled from Iowa State University/Iowa Environmental Mesonet).
| Report Type | Number of Reports |
| Heavy Rain | 91 |
| Flood | 27 |
| Flash Flood | 4 |
| Coastal Flood | 9 |
| Non-Thunderstorm Wind Gust | 151 |
| Non-Thunderstorm Wind Damage | 13 |
| Tornado/Waterspout/Funnel Cloud | 3/2/1 |
| Thunderstorm Wind Damage | 7 |
| Thunderstorm Wind Gust | 28 |
Daily Record Events in December.
Table 4. Summary of daily records broken or set in Florida in December (source: NCEI Daily Weather Records).
| Category | Number of Records |
| Highest daily max. temp. | 6 |
| Highest daily min. temp. | 15 |
| Lowest daily max. temp. | 1 |
| Lowest daily min. temp. | 0 |
| Highest daily precipitation | 63 |
| Total | 85 |
Weather/Climate Highlight of the Month: 2023 ends record warm, and record dry for some on west coast.
2023 was the hottest year globally in the observational record dating back to 1850. In Florida, 2023 was the hottest year on record for many locations, based on annual average mean temperatures. This includes Pensacola, Daytona Beach, Orlando, Tampa, Lakeland, Venice, Fort Myers, Miami, and Key West, all with a 60-year instrumental record or longer. Many other locations had one of their top 5 hottest years on record. Western coastal stations ended up with a record dry year in 2023, while the Southeast was among the wettest. The maps below show the station-specific rankings based on annual average mean temperatures (top) and total annual precipitation (bottom), courtesy of the Southeast Regional Climate Center’s Climate Perspectives Tool.
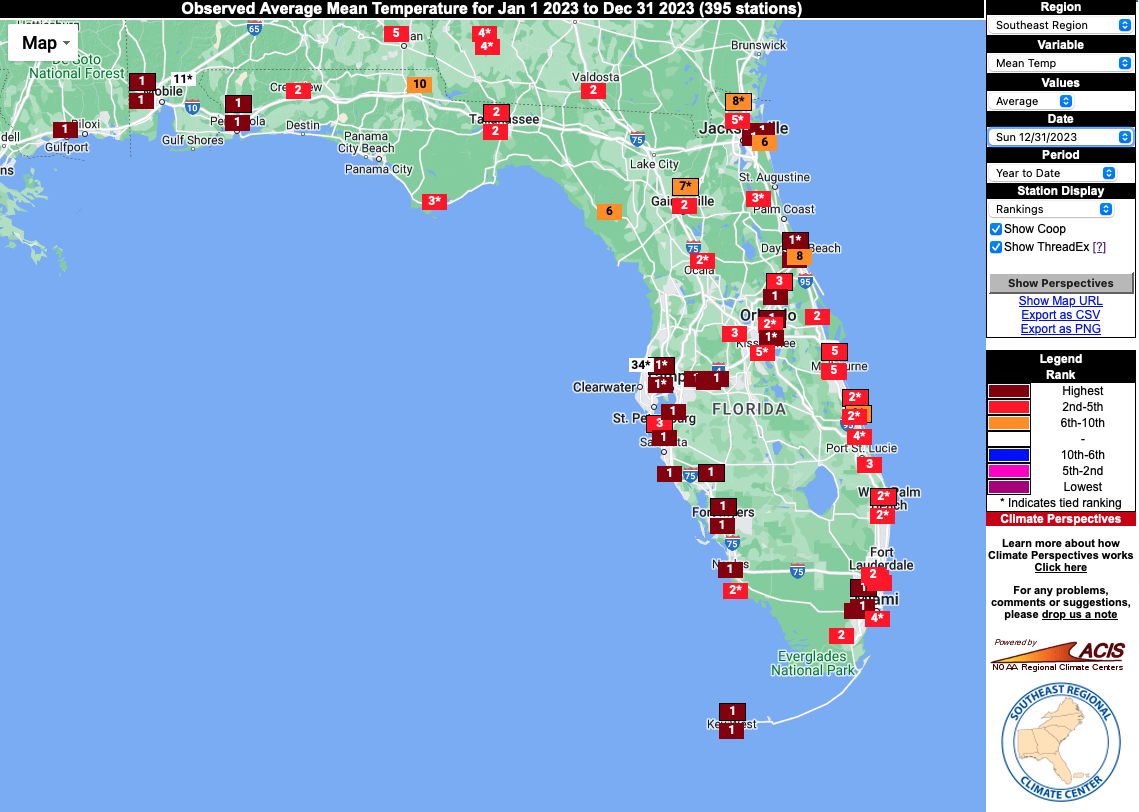
2023 annual average temperature station rankings (Source: Southeast Regional Climate Center's Climate Perspectives Tool).
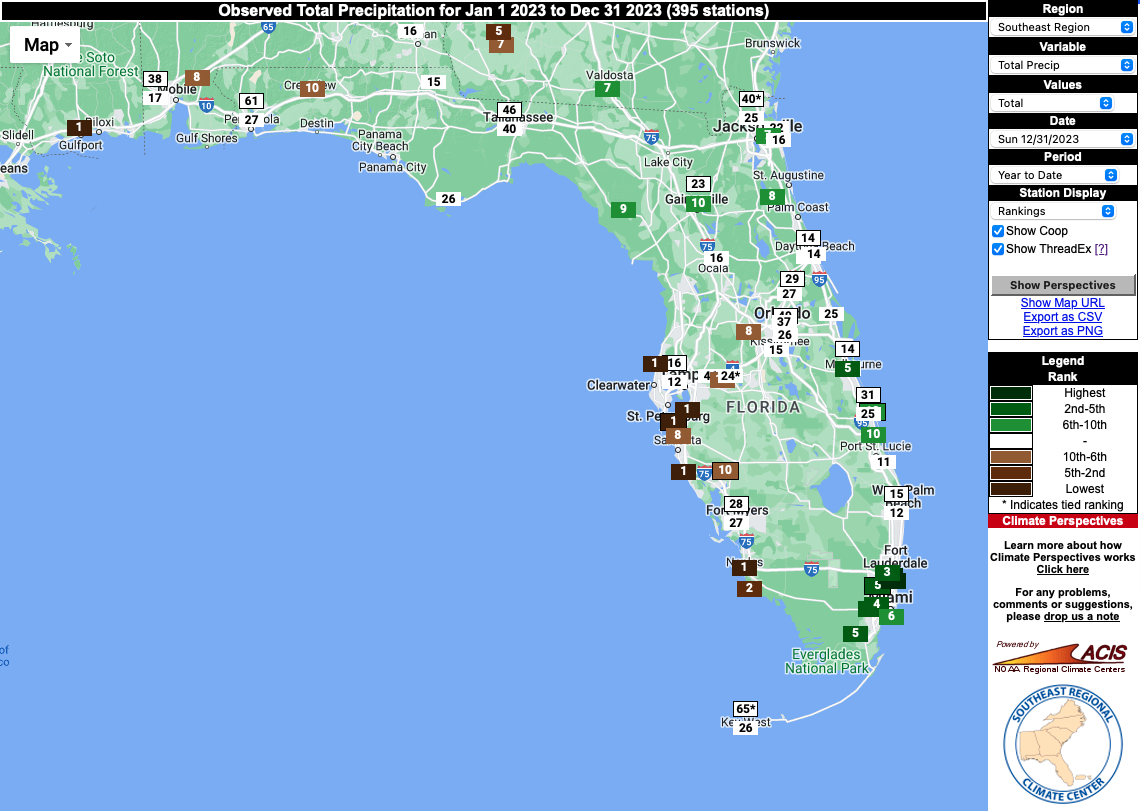
2023 annual total precipitation station rankings (Source: Southeast Regional Climate Center's Climate Perspectives Tool).
Drought-Related Impacts.
Drought conditions improved across the western Panhandle throughout the month as multiple systems generated ample rainfall. Conditions along western coastal areas also improved during the month; however, extreme drought hung on for west-central Florida where many have seen their driest year on record.
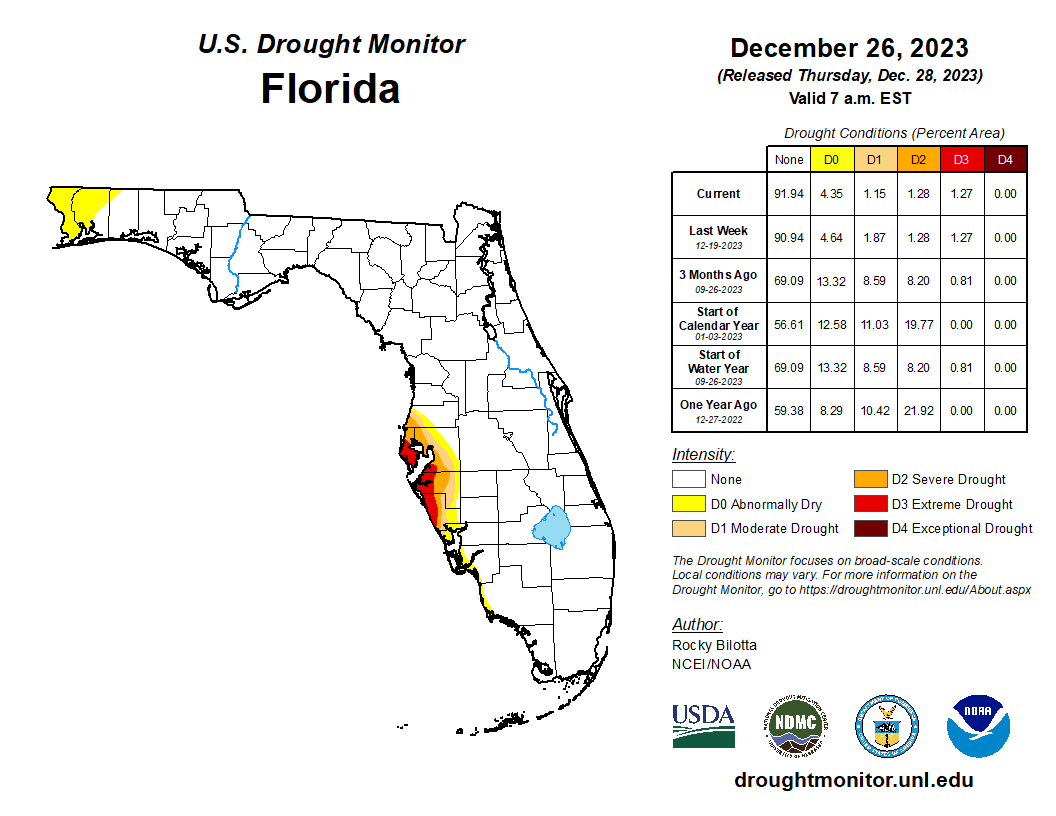
By December 12th, roughly 1.3% of the state was in extreme drought (D3), 1.3% was in severe drought (D2), 2% was in moderate drought (D1), and 8% was abnormally dry (D0), according to the U.S. Drought Monitor. By the end of the month, 1.3% of the state continued to be in extreme drought (D3) and in severe drought (D2), while only 1% was in moderate drought (D1) and 4% was abnormally dry (D0) (see Figure 2 below). Drought removal along Florida’s west-central coast is likely in January.
As of December 31, the Lake Okeechobee water level was 15.98 ft. above sea level (Feet-NGVD29), which is above average for this time of year. The water level did not change much from the start of the month.
Figure 2. A graphical depiction of the latest drought conditions in Florida according to the U.S. Drought Monitor (courtesy of the National Drought Mitigation Center, University of Nebraska-Lincoln).
Agriculture-Related Impacts.
In December, moderate amounts of rainfall improved overall drought conditions in the state. Pasture conditions were fair to good with much-needed rainfall. Sugarcane planting and harvest progressed well during the month. Among the crops that were planted and harvested include sugarcane, green beans, yellow squash, sweet corn, peppers, avocado, and tropical fruits. For more information, consult the Crop Progress State Stories, which is published by the USDA’s National Agricultural Statistics Service December through March.
Appendix 1
Additional December departures from normal data for select Florida locations (Source: NWS).
| Station | Average Temperature (˚F) | Departure from Normal (˚F) | Total Rainfall (in.) | Departure from Normal (in.) |
| Gainesville | 59.5 | +2.2 | 5.90 | +3.02 |
| Sarasota | 66.4 | +1.2 | 3.62 | +1.29 |
| Naples | 67.8 | -0.4 | 2.89 | +1.57 |
| Fort Myers | 67.4 | +0.1 | 4.18 | +2.28 |
| West Palm Beach | 69.2 | +0.2 | 3.98 | +0.50 |
Appendix 2
Select daily record high maximum temperatures (°F) broken or tied during December (compiled from NOAA).
| Location | Date | Record | Broken/Tied | Last |
| Miami | 1 | 85 | Tied | 85 in 2019 |
| Canal Point | 2 | 88 | Broken | 87 in 1991 |
| Homestead | 2 | 87 | Tied | 87 in 2010 |
| Miami | 2 | 86 | Tied | 86 in 2018 |
| Archbold Bio Stn | 3 | 89 | Tied | 89 in 2018 |
| Fort Lauderdale | 3 | 86 | Tied | 86 in 2018 |
| Miami | 3 | 89 | Broken | 88 in 2009 |
| Lakeland | 3 | 87 | Tied | 87 in 2018 |
| Vero Beach | 4 | 86 | Broken | 84 in 1994 |
| Miami | 4 | 86 | Broken | 85 in 2018 |
| Orlando | 4 | 82 | Tied | 82 in 2016 |
| Homestead | 5 | 89 | Tied | 89 in 2018 |
| Fort Lauderdale | 6 | 86 | Broken | 84 in 2020 |
| Pensacola | 25 | 77 | Broken | 75 in 2008 |
| Homestead | 27 | 85 | Tied | 85 in 2015 |