
Prepared by Florida Climate Center
The Florida State University
Tallahassee, FL

Key Points:
- Monthly average temperatures were above normal in April for the fourth month in a row this year; Florida is experiencing its hottest year on record so far (January – April).
- April monthly precipitation totals were generally above normal in Florida, except along the western Gulf Coast region. Extreme rainfall occurred in and around Fort Lauderdale on April 12-13.
- Drought conditions improved in some places by the end of the month. Moderate to severe drought persisted across much of the Peninsula, and a pocket of extreme drought developed along the west-central Gulf Coast from Levy to Pinellas Counties.
- An El Niño Watch has been issued, with a 62% chance of a transition to El Niño in summer (May–July).
Average monthly temperatures in April were above normal across the state. Average temperature departures from normal ranged from +1.8 ̊F in Key West to +4.2 ̊F in Orlando for the month (see Table 1 and Appendix 1 for select cities). Many locations across the Peninsula experienced one of their warmest Aprils on record. Sarasota and Lakeland had their top record warmest April on record, while many other locations had one of their top 5 warmest Aprils on record, including Naples, Fort Myers, Tampa, Orlando, Daytona Beach, Miami, and West Palm Beach. April marks the fourth month in a row with above normal monthly average temperatures. Since the beginning of the year, Florida is experiencing its warmest year on record to date. Appendix 2 provides select daily high maximum temperature records tied or broken during the month.
Table 1. April average temperatures and departures from normal ( ̊F) for selected cities.
| Station | Mean Temperature | Departure from Normal |
| Pensacola | 70.4 | +2.1 |
| Tallahassee | 70.2 | +2.9 |
| Jacksonville | 70.7 | +2.6 |
| Orlando | 76.4 | +4.2 |
| Tampa | 77.0 | +3.1 |
| Miami | 79.4 | +2.7 |
| Key West | 79.7 | +1.8 |
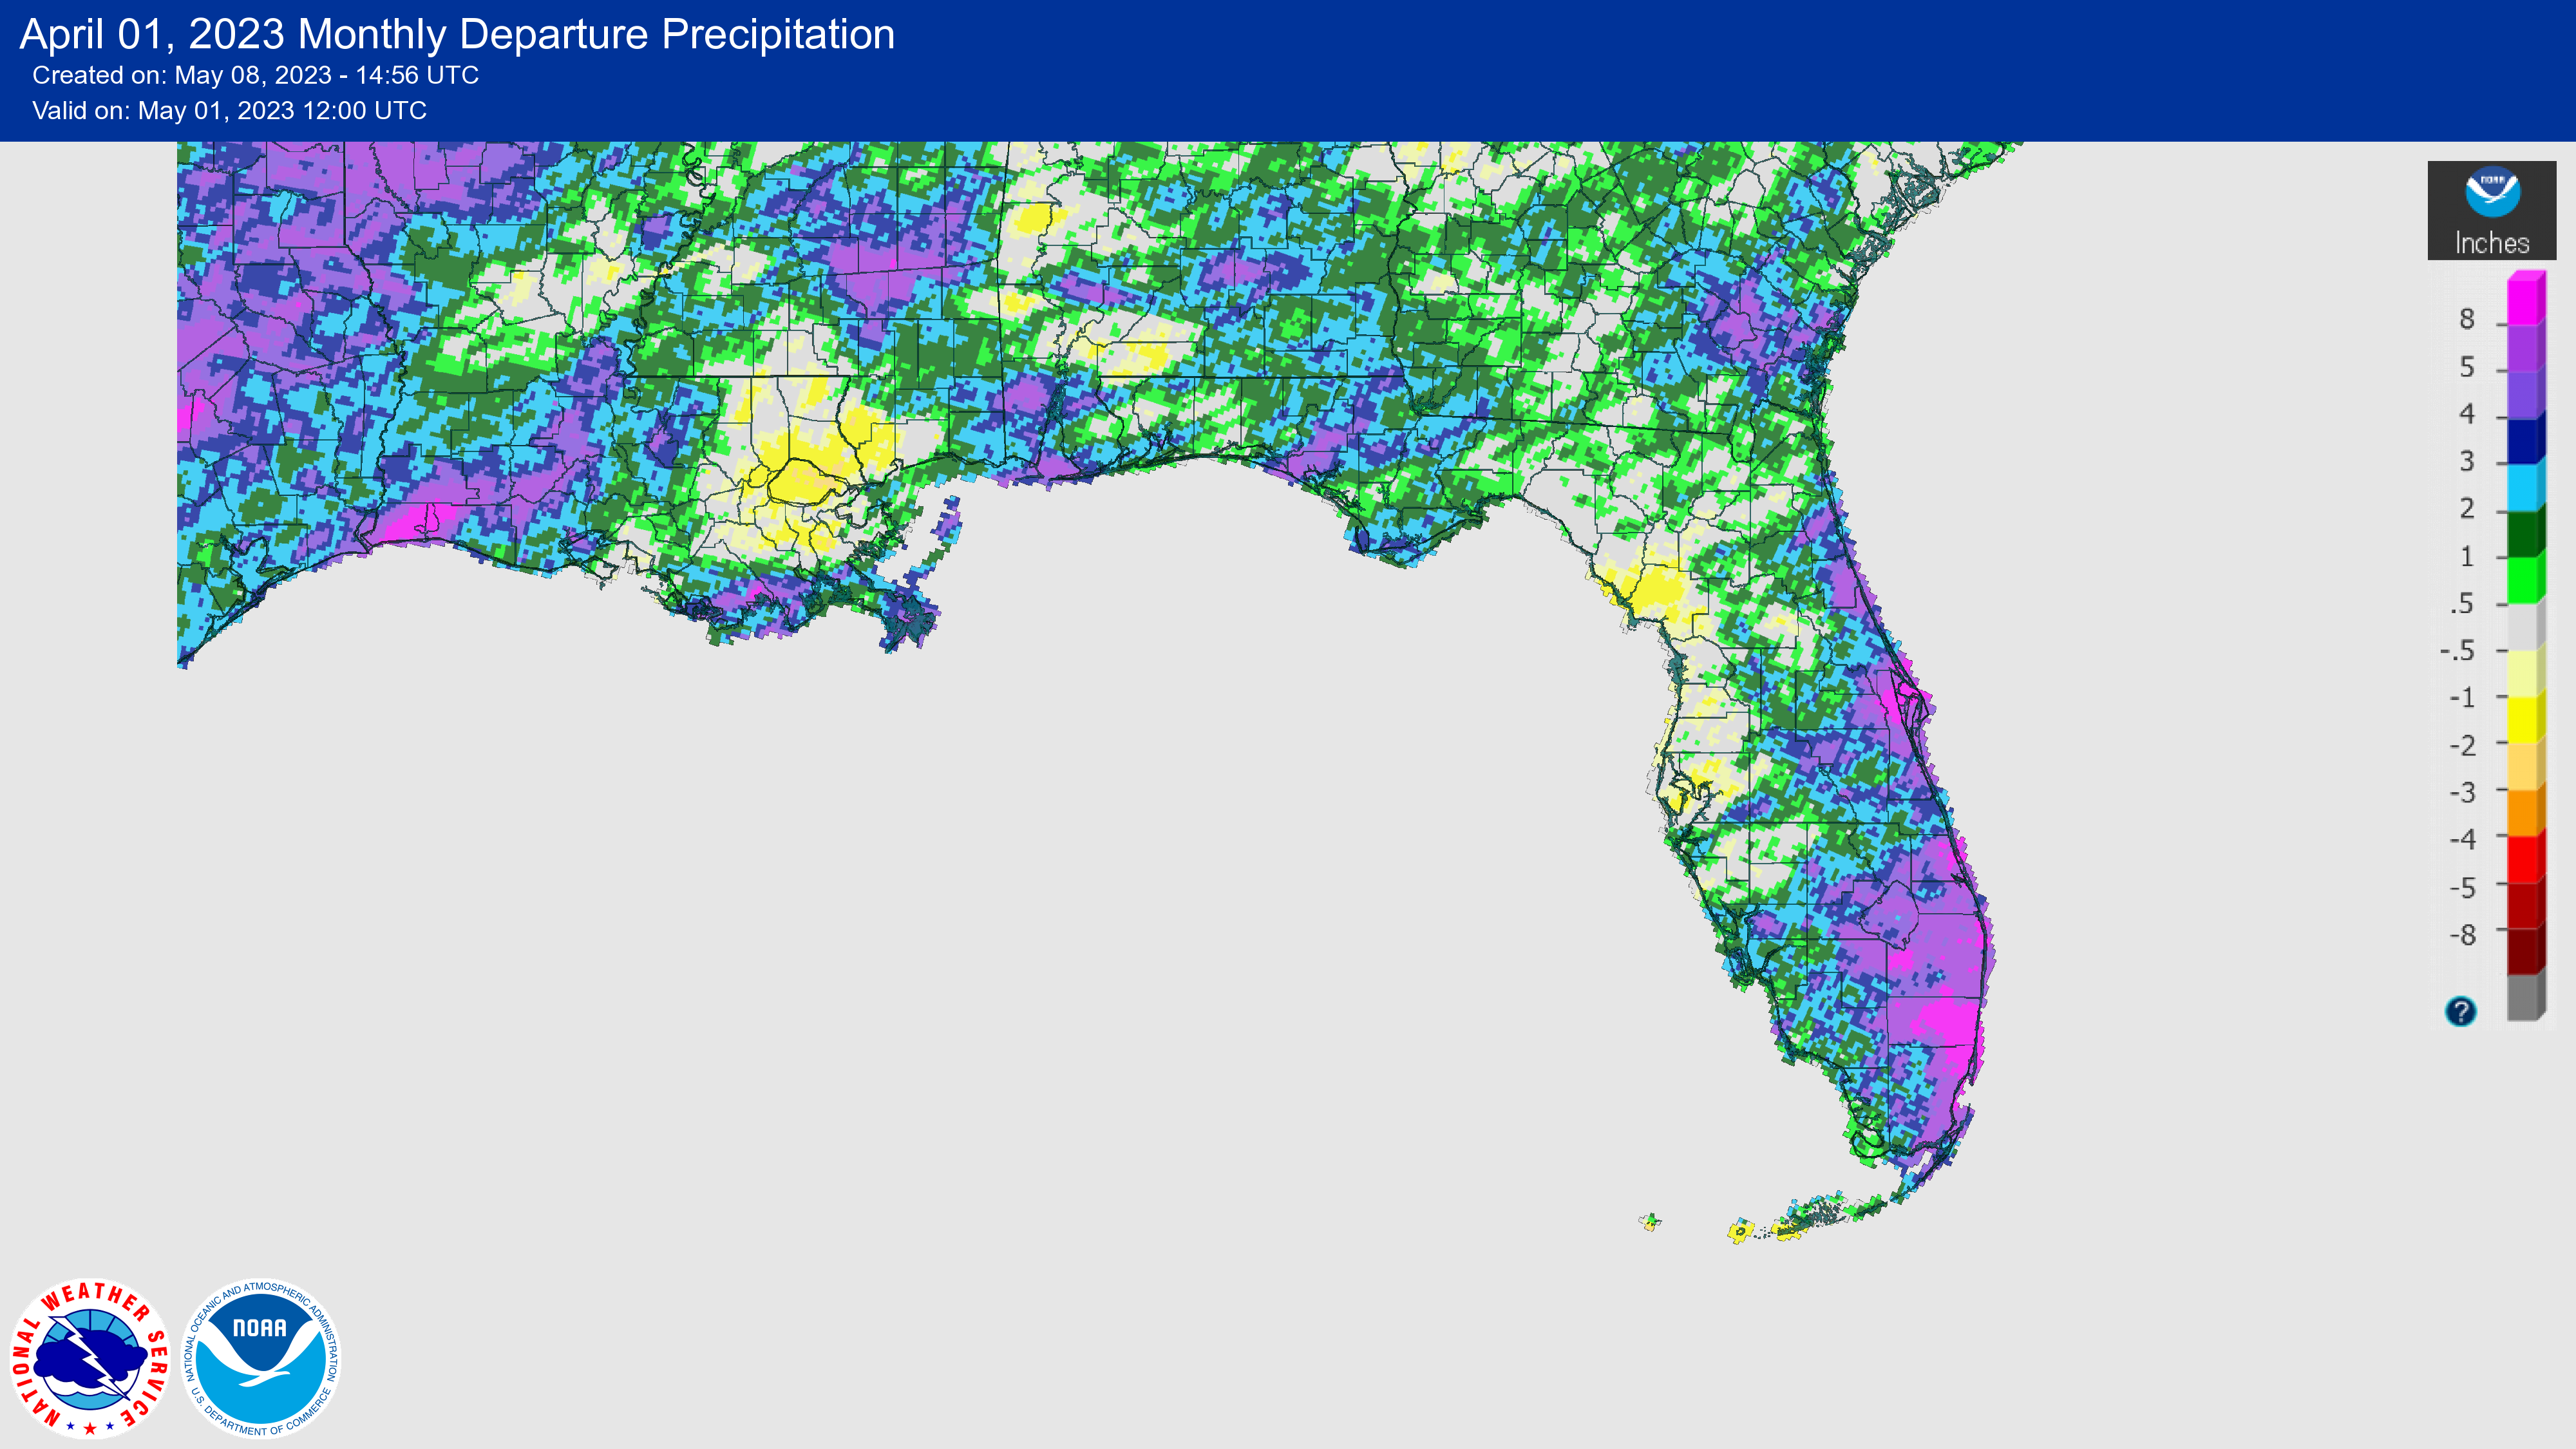
Monthly precipitation totals in April were variable, with above normal monthly rainfall across eastern Florida and the central Panhandle and below normal rainfall across the western Gulf Coast. The monthly precipitation departures from normal ranged from -1.67 inches in Tampa to +6.59 inches in Miami (see Table 2 and Appendix 1 for additional locations). Other locations in Southeast Florida were well above normal, with excess rainfall for the month on the order of +7.45 inches in West Palm Beach to +25.34 inches in Fort Lauderdale. Fort Lauderdale’s rainfall total of 25.87 inches on April 12-13 was a record 1-day rainfall, and Fort Lauderdale, Hollywood, and Miami all recorded their wettest April on record. In addition, Stuart recorded its wettest April on record, with a total of 10.59 inches for the month, and Titusville had its wettest April with 11.03 inches for the month (based on a 105-year record at this station).
Table 2. April precipitation totals and departures from normal (inches) for selected cities.
| Station | Total Rainfall | Departure from Normal |
| Pensacola | 7.34 | +1.82 |
| Tallahassee | 3.36 | -0.17 |
| Jacksonville | 3.05 | +0.12 |
| Orlando | 3.92 | +1.34 |
| Tampa | 0.88 | -1.67 |
| Miami | 9.95 | +6.59 |
| Key West | 1.69 | -0.38 |
Figure 1. A graphical depiction of the monthly rainfall departure from normal (inches) for April (courtesy of NOAA, NWS).
El Niño Watch.
The current ENSO-neutral conditions in the equatorial Pacific Ocean are expected to continue through the Northern Hemisphere spring. Over the past month, above-average sea surface temperatures dominated across the equatorial Pacific Ocean. The Niño 1 + 2 index value was at +2.7 ̊C, indicating warming along the South American Coast. There is the potential of a strong El Niño by the end of the year, with a decrease in trade winds and an increase in oceanic heat content, which have led to increased confidence in El Niño in coming months. However, the range of possibilities toward the end of the year remain wide – from a strong El Niño to no El Niño. There is a 62% chance of El Niño developing during summer (May-July 2023).
Hazardous Weather Events in April.
According to the Local Storm Reports issued by the local National Weather Service offices serving Florida, there were 614 individual local reports of hazardous weather events recorded across the state during the month of April (see Table 4 for a breakdown by event type). There were several reports of large hail throughout the month, including golf ball sized hail on the 16th near Port St. Lucie and baseball sized hail (2.75 inches) in Lake County on the 25th. A 3-inch hail stone was reported on the 24th in Antioch in Hillsborough County, which is only the 19th such occurrence dating back to 1950, according to National Weather Service data obtained from the North Carolina State Climate Office Severe Storm Reports Tool. A tornado outbreak occurred on the 27th, with 7 tornadoes reported across the Panhandle on that day alone. A peak wind gust of 76 mph was reported near Lynn Haven in Bay County.
Table 3. Breakdown of storm reports submitted in Florida during the month of April (compiled from Iowa State University/Iowa Environmental Mesonet).
| Report Type | Number of Reports |
| Heavy Rain | 1 |
| Flood | 12 |
| Flash Flood | 9 |
| Coastal Flood | 3 |
| Hail | 140 |
| Marine Thunderstorm Wind | 97 |
| Non-Thunderstorm Wind Gust | 42 |
| Non-Thunderstorm Wind Damage | 2 |
| Tornado/Waterspout/Funnel Cloud | 17/11/10 |
| Thunderstorm Wind Damage | 102 |
| Thunderstorm Wind Gust | 158 |
| Rip Currents | 1 |
| Wildfire | 7 |
Daily Record Events in April.
Table 4. Summary of daily records broken or set in Florida in April (source: NCEI Daily Weather Records).
| Category | Number of Records |
| Highest daily max. temp. | 35 |
| Highest daily min. temp. | 44 |
| Lowest daily max. temp. | 5 |
| Lowest daily min. temp. | 2 |
| Highest daily precipitation | 40 |
| Total | 126 |
Weather/Climate Highlight of the Month:
A cluster of stationary thunderstorms developed and sat over the Fort Lauderdale area on April 12-13, producing copious amounts of rainfall over the region. A local record 24-hour rainfall total of approximately 25.8 inches was recorded at a WeatherStem station near the Ft. Lauderdale Airport. This rainfall total could set a new record 24-hour rainfall for Florida, and is under investigation by the State Climate Extremes Committee. Much of this rainfall in Fort Lauderdale and surrounding areas fell in a 6- to 12-hour period. A CoCoRaHS observer recorded 18.16 inches in Hollywood on that day. The storm caused flash flooding, which flooded roadways and closed the airport. The current 24-hour rainfall record in Florida is 23.28 inches in Key West, set on November 11-12, 1980.
Drought-Related Impacts.
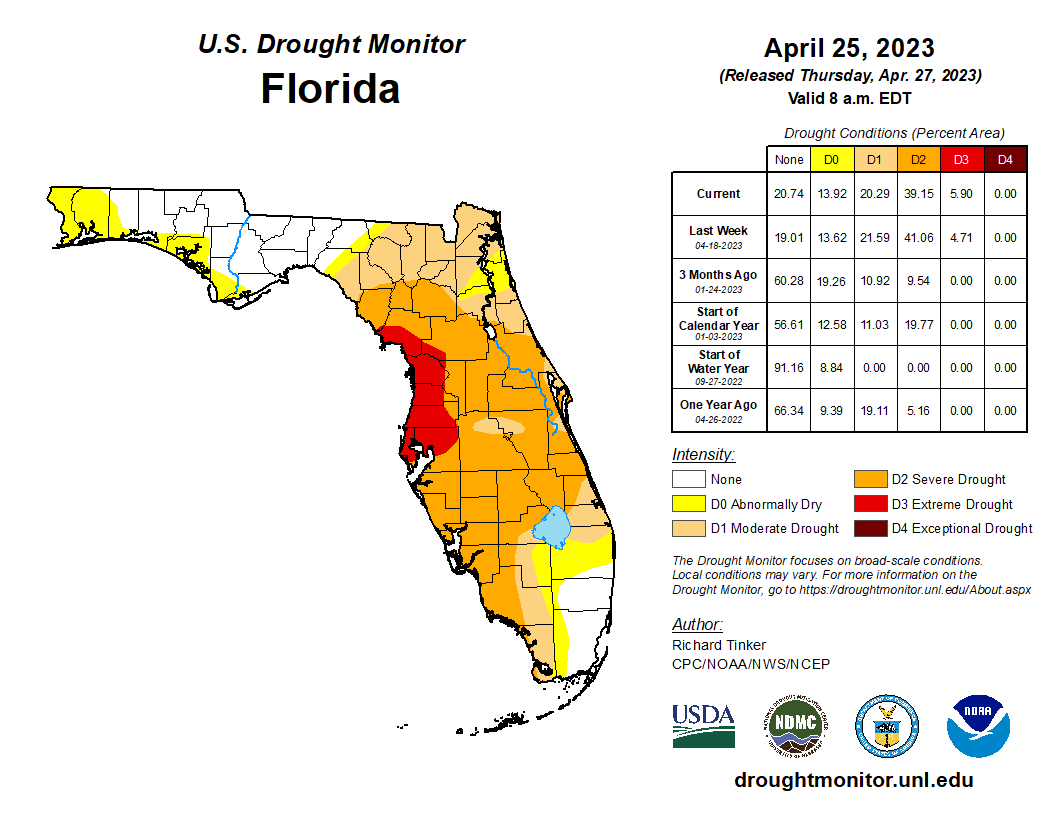
In mid-April, extreme drought (D3) had shifted northward to the west-central Gulf counties of Pinellas, Hillsborough, Pasco, Hernando, and Citrus Counties. About 4.7% of the state was in extreme drought (D3), 41% was in severe drought (D2), 22% was in moderate dry (D1), and 14% was abnormally dry, according to the U.S. Drought Monitor. Toward the end of the month, conditions had not changed much. The area of extreme drought extended slightly further north to include coastal Levy County. As of April 25, about 5.9% of the state was in extreme drought (D3), 39% was in severe drought (D2), 20% of the state was in moderate drought (D1), and 14% remained abnormally dry (Figure 2).
As of April 30, the Lake Okeechobee water level was 14.33 ft. above sea level (Feet-NGVD29), which is just above average for this time of year. At the first of the month, the water level was 14.52 ft. above sea level.
Figure 2. A graphical depiction of the latest drought conditions in Florida according to the U.S. Drought Monitor (courtesy of the National Drought Mitigation Center, University of Nebraska-Lincoln).
Agriculture-Related Impacts.
In mid-April, topsoil moisture conditions were adequate in 45% of the state, short in 27%, and very short in 18% of the state, while 10% of the state had surplus moisture conditions. By the end of April, topsoil moisture had begun to improve with levels adequate in 60% of the state, short in 21%, and very short in 8% of the state; 11% of the state was in surplus. For more information, consult the Crop Progress and Conditions Report, which is published by the USDA’s National Agricultural Statistics Service.
Appendix 1
Additional April departures from normal data for select Florida locations (Source: NWS).
| Station | Average Temperature (˚F) | Departure from Normal (˚F) | Total Rainfall (in.) | Departure from Normal (in.) |
| Fort Lauderdale | 77.4 | +2.5 | 29.03 | +25.34 |
| Gainesville | 71.5 | +3.0 | 4.60 | +1.86 |
| Sarasota | 76.2 | +3.6 | 3.63 | +1.17 |
| Melbourne | 75.8 | +2.7 | 4.72 | +2.43 |
| Fort Myers | 79.0 | +4.2 | 3.99 | +1.55 |
| West Palm Beach | 78.2 | +3.3 | 11.13 | +7.45 |
Appendix 2
Select daily record high maximum temperatures (°F) broken or tied during April (compiled from NOAA).
| Location | Date | Record | Broken/Tied | Last |
| Kissimmee | 1 | 90 | Tied | 90 in 2021 |
| Orlando | 1 | 92 | Tied | 92 in 1974 |
| Jacksonville | 1 | 90 | Broken | 89 in 1974 |
| Pensacola | 1 | 86 | Broken | 84 in 2012 |
| Sanford | 3 | 91 | Tied | 91 in 2017 |
| Vero Beach | 3 | 88 | Broken | 87 in 2017 |
| Fort Pierce | 4 | 92 | Broken | 91 in 1977 |
| Orlando | 4 | 93 | Broken | 92 in 1974 |
| Gainesville | 4 | 90 | Broken | 89 in 2011 |
| Fort Myers | 4 | 93 | Broken | 90 in 2022 |
| Crestview | 4 | 88 | Broken | 86 in 2017 |
| Bradenton | 5 | 91 | Broken | 89 in 2022 |
| Clermont | 5 | 94 | Broken | 91 in 2012 |
| Kissimmee | 5 | 92 | Broken | 90 in 2017 |
| Usher Tower | 5 | 91 | Broken | 90 in 1999 |
| Venice | 5 | 93 | Broken | 89 in 1997 |
| Cross City | 5 | 90 | Broken | 87 in 2010 |
| Fort Myers | 5 | 94 | Broken | 91 in 2022 |
| Tampa | 5 | 91 | Broken | 89 in 1964 |
| Fort Myers | 6 | 93 | Broken | 91 in 1999 |
| Tampa | 6 | 92 | Broken | 89 in 1999 |
| Crestview | 6 | 88 | Broken | 86 in 2022 |
| Clermont | 7 | 95 | Broken | 92 in 2022 |
| Cross City | 7 | 90 | Broken | 88 in 1954 |
| Plant City | 8 | 94 | Broken | 93 in 1967 |
| Kissimmee | 9 | 91 | Broken | 89 in 2020 |
| Key West | 9 | 86 | Tied | 86 in 1965 |
| Miles City | 15 | 97 | Broken | 95 in 2015 |
| Fort Myers | 15 | 93 | Broken | 92 in 2020 |
| Clermont | 16 | 93 | Broken | 92 in 1967 |
| Wauchula | 16 | 94 | Broken | 93 in 1945 |
| Lakeland | 16 | 92 | Tied | 92 in 1994 |
| Clermont | 17 | 91 | Broken | 90 in 2022 |