
Prepared by Florida Climate Center
The Florida State University
Tallahassee, FL

November Key Points:
- Temperatures were below normal across the state for the month.
- Precipitation in the Florida Panhandle was below normal in November, the first time in 7 months for some places in the region, while precipitation in the rest of the state was above normal.
- Abnormally dry conditions emerged in the northern Panhandle region toward the end of the month.
- The 2021 Atlantic Hurricane Season officially ended as the third most active year on record.
- The December outlook favors above normal temperatures and continued dryness with below normal precipitation.
Average temperatures in November were below normal across the state. Average temperature departures ranged from -4.3 ̊F in Jacksonville to -0.4 ̊F in Orlando for the month (see Table 1 and Appendix 1 for select cities). Much of the state experienced cooler-than-normal temperatures during the month and especially during the first half of the month. Only one daily high maximum temperature record was set, and no daily high minimum temperature records were set during the month; however, there were several daily low maximum temperature records set, particularly early in the month.
Table 1. November average temperatures and departures from normal ( ̊F) for selected cities.
| Station | Mean Temperature | Departure from Normal |
| Pensacola | 59.8 | -1.6 |
| Tallahassee | 57.2 | -3.0 |
| Jacksonville | 58.0 | -4.3 |
| Orlando | 67.8 | -0.4 |
| Tampa | 68.4 | -1.4 |
| Miami | 73.1 | -1.7 |
| Key West | 73.9 | -2.7 |
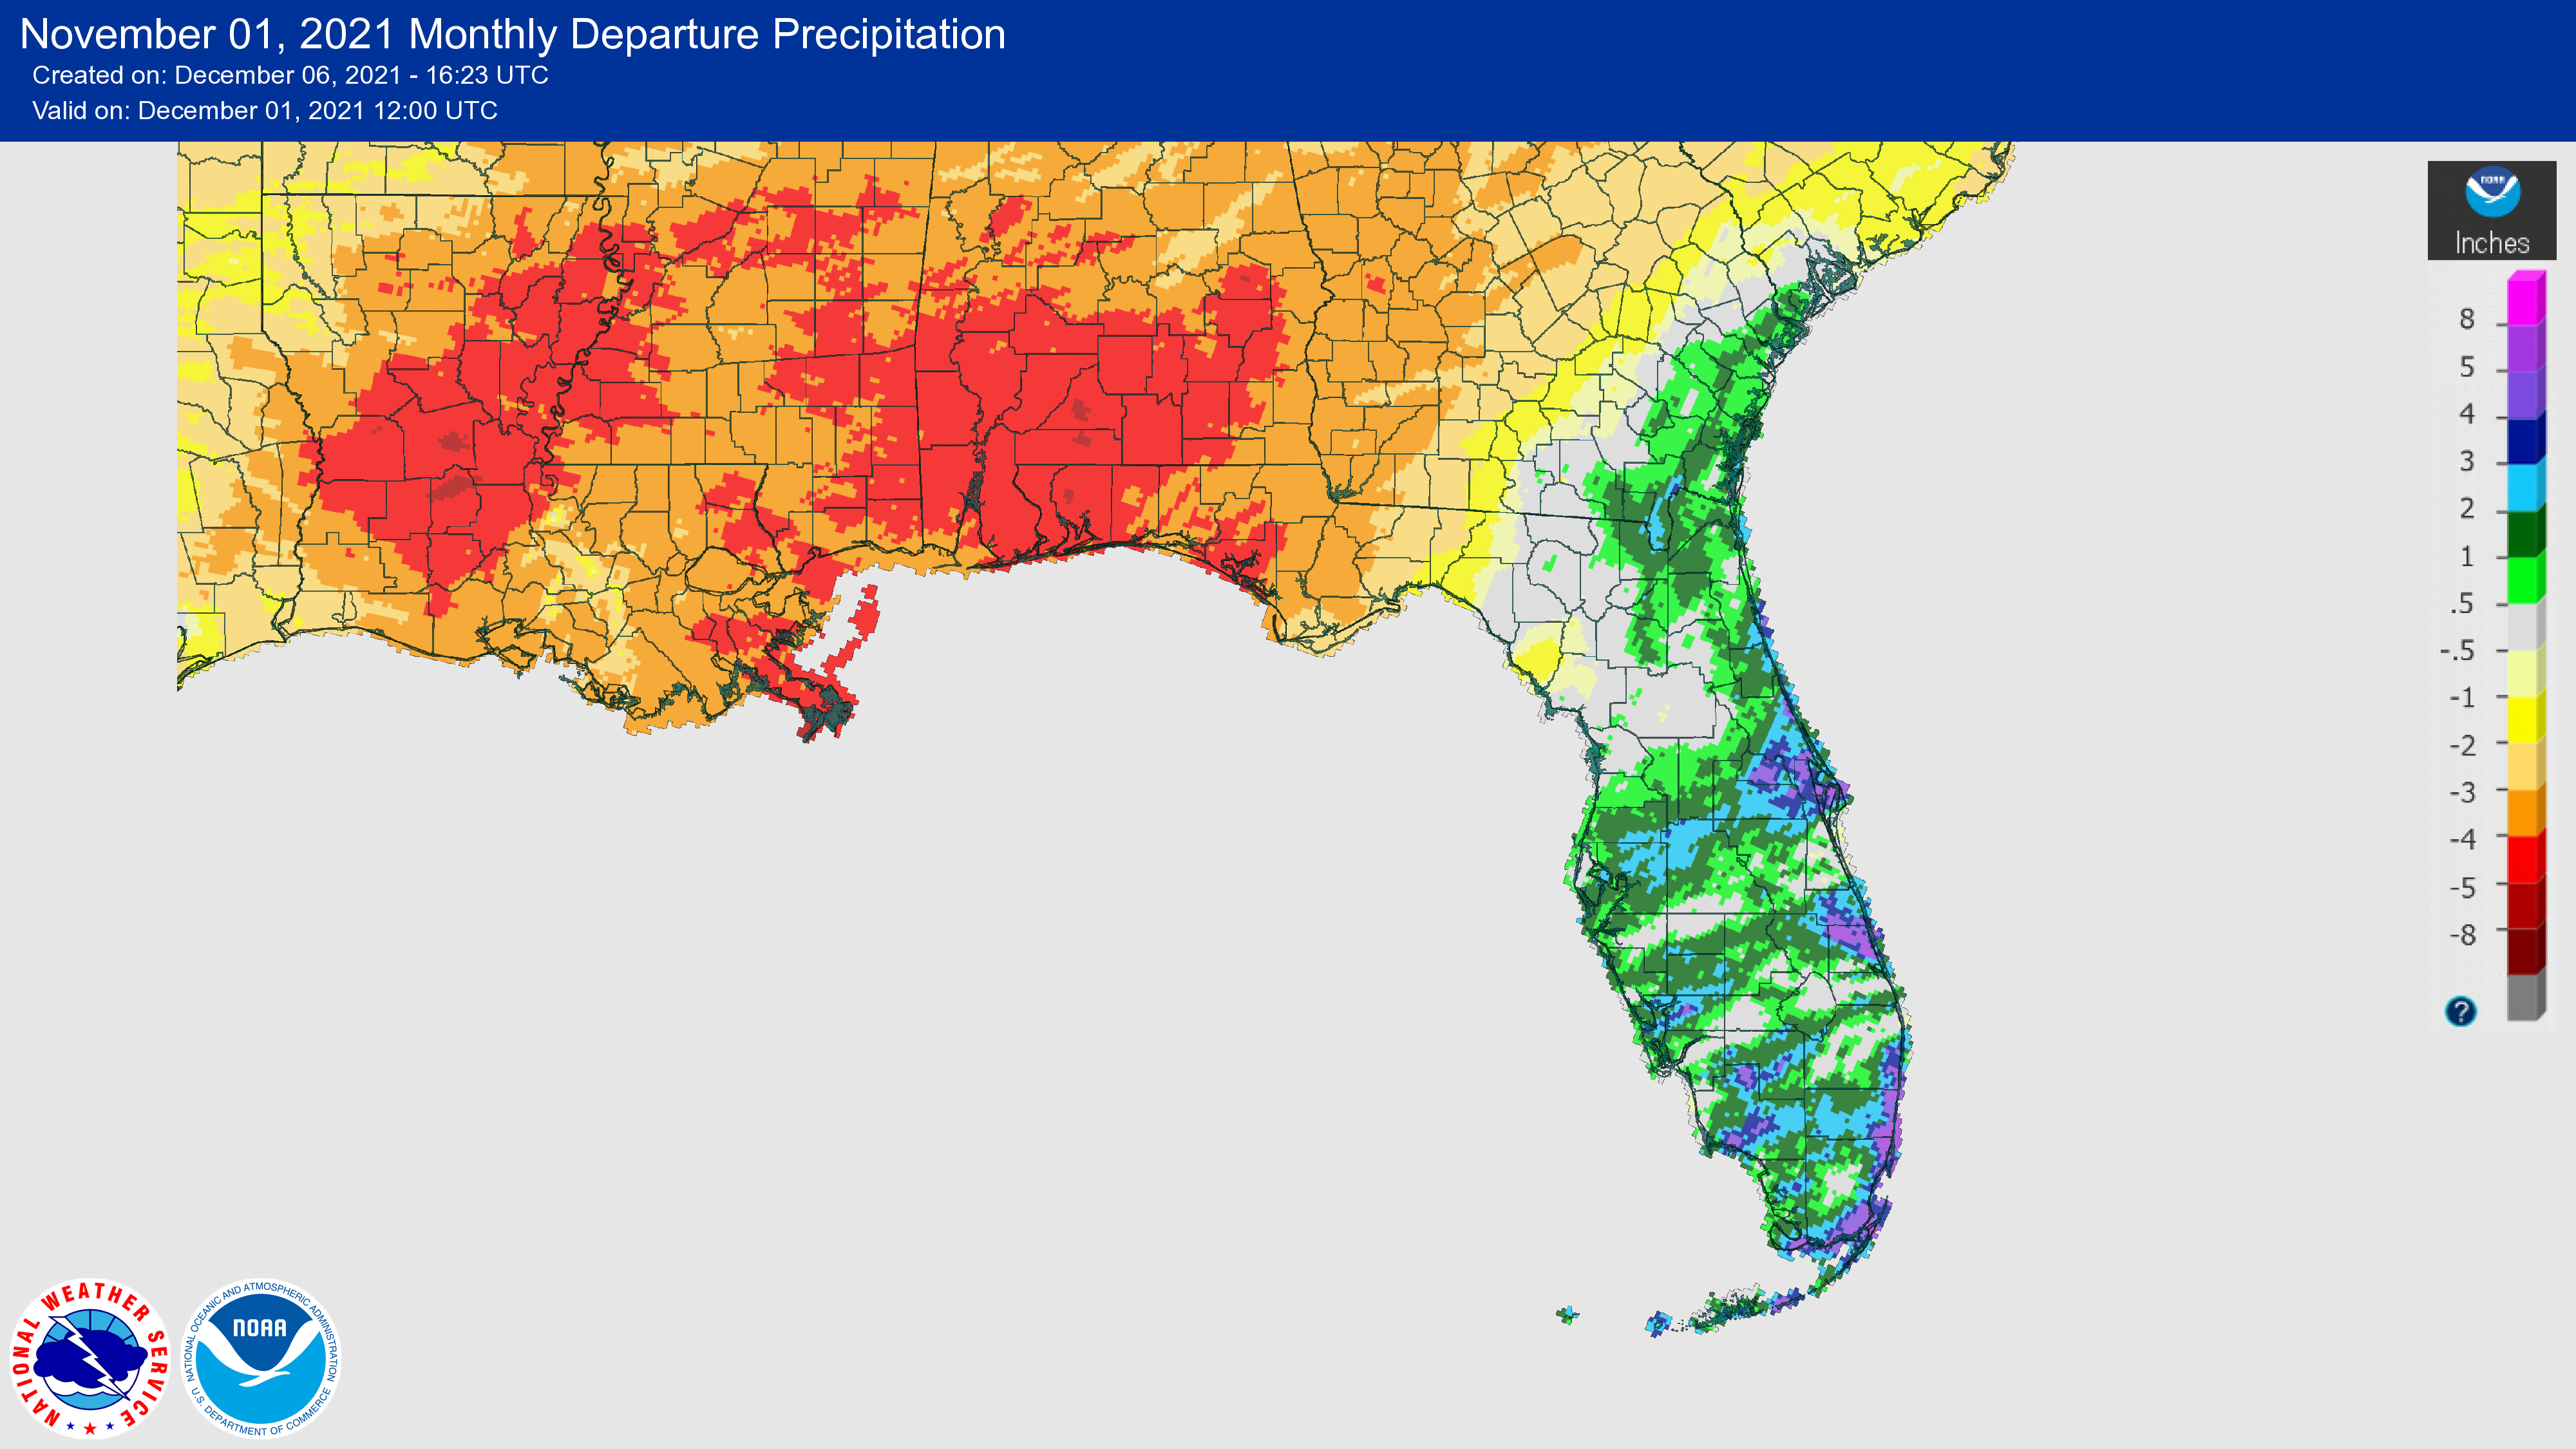
Rainfall totals in November were below normal in the Panhandle and above normal across the Peninsula (Figure 1). Monthly departures from normal ranged from -4.11 inches in Pensacola to +2.41 inches in Orlando (Table 2 and Appendix 1). Much of the Panhandle was drier than normal, and the western Panhandle broke its wet streak with above normal precipitation for the past several months. Pensacola has had wetter than normal conditions since April, but it experienced its fourth driest November on record. Pensacola maintains a surplus in annual rainfall due to excessive rainfall in prior months with an annual total of 86.65 inches so far, which is just shy of 24 inches above normal to date. Venice and Hollywood had their second wettest Novembers on record.
Table 2. November precipitation totals and departures from normal (inches) for selected cities.
| Station | Total Rainfall | Departure from Normal |
| Pensacola | 0.31 | -4.11 |
| Tallahassee | 0.58 | -2.52 |
| Jacksonville | 3.19 | +1.19 |
| Orlando | 4.20 | +2.41 |
| Tampa | 3.52 | +2.12 |
| Miami | 4.38 | +0.85 |
| Key West | 2.80 | +0.75 |
Figure 1. A graphical depiction of the monthly rainfall departure from normal (inches) for November (courtesy of NOAA, NWS).
La Niña Advisory.
La Niña conditions, the cool phase of the ENSO climate pattern, returned to the tropical Pacific Ocean in October. Below-average subsurface temperatures (averaged from 180-100°W) strengthened significantly over the past month, as negative anomalies were observed at depth across most of the central and eastern Pacific Ocean. There is now a 90% chance of La Niña conditions continuing in the Northern Hemisphere winter, and it is likely to continue into spring 2022 (~50% during March-May). At its peak, a moderate-strength La Niña is favored. ENSO-neutral conditions could potentially return during April-June 2022.
Hazardous Weather Events in November.
According to the Local Storm Reports issued by the local National Weather Service offices serving Florida, there were 209 individual local reports of hazardous weather events recorded across the state during the month of November (see Table 4 for a breakdown by event type). Heavy rain affected several parts of the state on the 5th and 6th, including Volusia and Collier Counties which experienced over 7 and 9 inches of rainfall, respectively. Further, high water levels caused coastal flooding in several places across the state on the 7th. The Mayport tide gauge in Duval County reached its 6th highest water level on record at 2.51 feet above MHHW, and the Fernandina Beach tide gauge reached its 7th highest water level on record, reaching 2.93 feet above MHHW. These are the highest water levels ever to occur with a non-tropical weather system. Heavy rainfall again affected parts of the state later in the month. On the 21st, 10-11 inches of rain fell in parts of St. Lucie County near River Park.
Table 4. Breakdown of storm reports submitted in Florida during the month of November (compiled from Iowa State University/Iowa Environmental Mesonet).
| Report Type | Number of Reports |
| Coastal Flood | 67 |
| Flash Flood | 15 |
| Flood | 21 |
| Dense Fog | 1 |
| Heavy Rain | 30 |
| Marine Thunderstorm Wind | 5 |
| Non-Thunderstorm Wind Gust | 54 |
| Non-Thunderstorm Wind Damage | 8 |
| Tornado/Waterspout/Funnel Cloud | 0/1/0 |
| Thunderstorm Wind Damage | 0 |
| Thunderstorm Wind Gust | 6 |
| Lightning | 0 |
| High Surf | 1 |
Drought-Related Impacts.
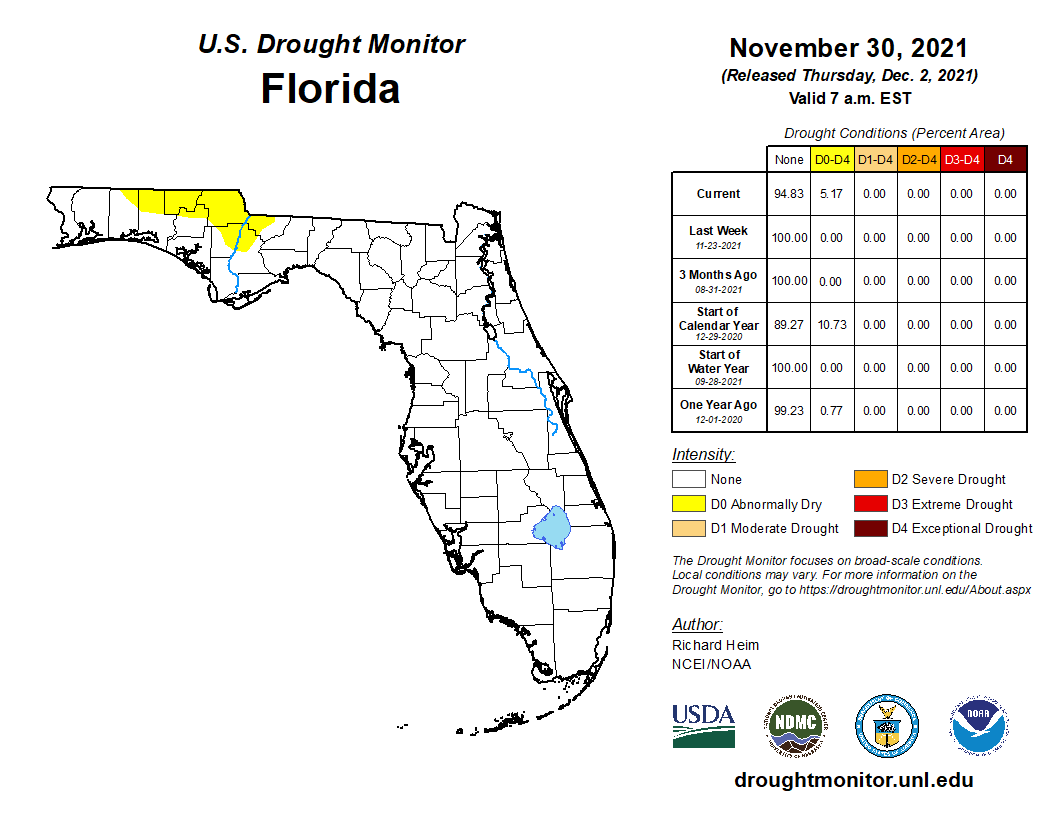
Much of November remained drought free across the state. Northeast Florida experienced abnormally dry conditions (D0) in early November but was drought free by mid-month. By November 30, abnormally dry conditions emerged in northern sections of the Panhandle, with 5.2% of the state experiencing abnormally dry conditions according to the U.S. Drought Monitor.
As of November 30, the Lake Okeechobee water level was at 15.94 ft. above sea level (Feet-NGVD29), which is above the average for this time of the year. The water level remained above average throughout the month. At the first of the month, the water level was 15.85 ft. above sea level.
Agriculture-Related Impacts.
During mid-November, topsoil moisture levels were adequate for 72% of the state, short in 10%, and very short in 1% of the state; 17% of the state was in surplus. By the end of November, topsoil moisture levels were adequate in 65% of the state, short in 24%, and very short in 2%; 9% of the state was in surplus. For more information, consult the weekly Crop Progress and Conditions report published by the USDA's National Agricultural Statistics Service.
Appendix 1
Additional November departures from normal data for select Florida locations (Source: NWS).
| Station | Average Temperature (˚F) | Departure from Normal (˚F) | Total Rainfall (in.) | Departure from Normal (in.) |
| Gainesville | 59.8 | -2.9 | 3.36 | +1.57 |
| Sarasota | 67.6 | -2.5 | 1.44 | -0.37 |
| Melbourne | 67.0 | -3.7 | 4.20 | +1.65 |
| Fort Myers | 70.8 | -0.7 | 2.45 | +0.67 |
| West Palm Beach | 71.5 | -1.5 | 6.54 | +2.92 |