
Prepared by Florida Climate Center
The Florida State University
Tallahassee, FL

August Key Points:
- Average temperatures were near or above normal during the month.
- Rainfall totals in August were mixed, with many northern locations receiving above normal rainfall and central to southern locations receiving below normal rainfall.
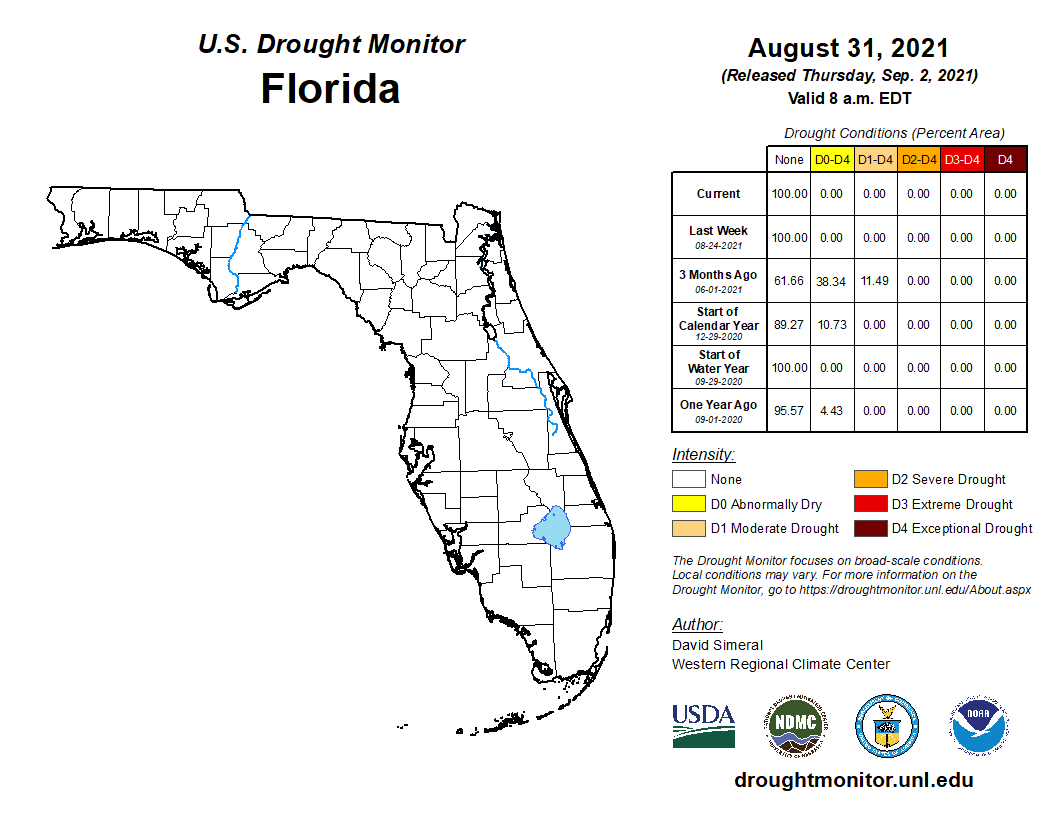
- Drought conditions did not impact any part of the state during the month.
- Tropical Storm Fred impacted much of the Panhandle on the 16th with reports of localized rainfall of 7.0+ inches, flash flooding, and wind gusts.
Average temperature departures in August were near or above normal across the state. Average temperature departures ranged from -0.8 ̊F in Key West to +2.2 ̊F in Orlando for the month (see Table 1 and Appendix 1 for select cities). Clermont had its warmest August on record; Jacksonville Beach and Lakeland had their second warmest Augusts on record; Orlando, Lakeland, and Tampa had their third warmest Augusts on record. Several daily high maximum and daily high minimum temperature records were set during the month (see Appendices 2 and 3).
Table 1. August average temperatures and departures from normal ( ̊F) for selected cities.
| Station | Mean Temperature | Departure from Normal |
| Pensacola | 83.8 | +0.8 |
| Tallahassee | 82.4 | 0 |
| Jacksonville | 81.9 | -0.2 |
| Orlando | 84.8 | +2.2 |
| Tampa | 85.0 | +1.0 |
| Miami | 84.8 | +0.6 |
| Key West | 84.7 | -0.8 |
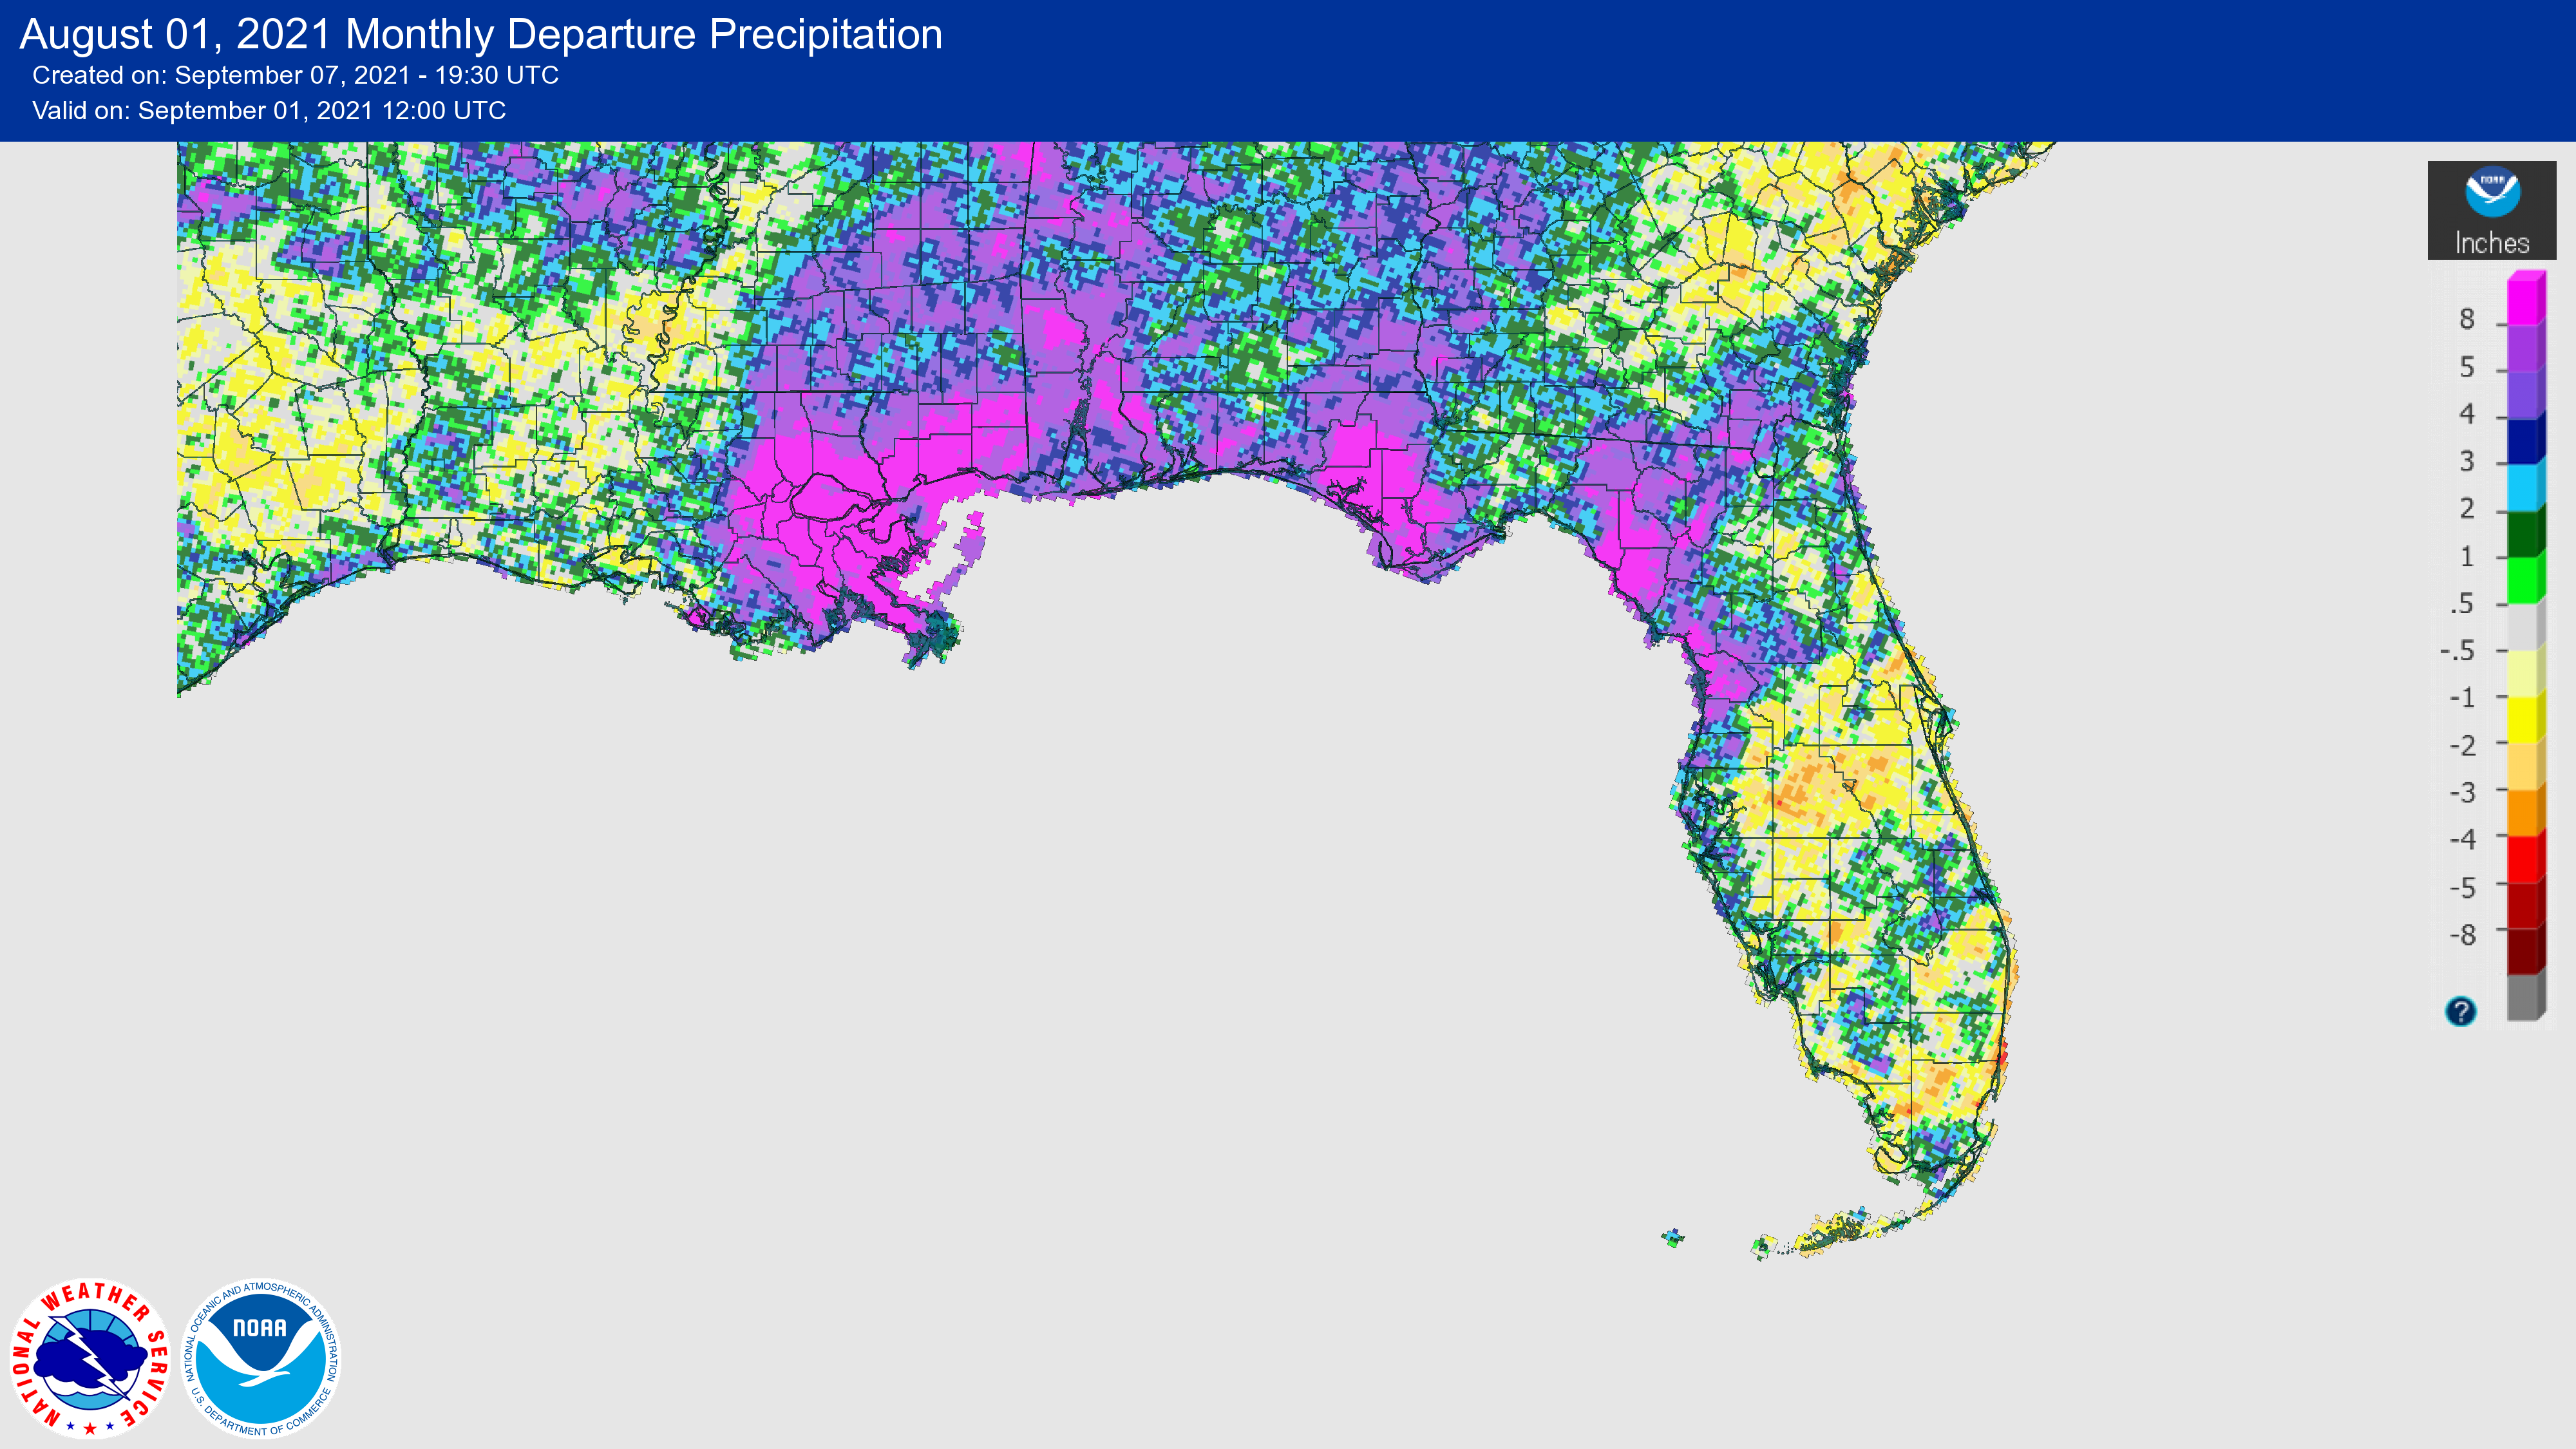
Rainfall totals in August were mixed, with above normal rainfall in the western Panhandle and north Florida regions and below normal rainfall across much of the central and southern portions of the state. Precipitation departures from normal ranged from -2.29 inches in Miami to +3.49 inches in Pensacola (Table 2 and Appendix 1 for select cities). Lakeland observed its driest August on record, and Fort Lauderdale recorded its third driest August on record. Daytona Beach had its second wettest August on record at 10.96 inches. Tropical Storm Fred, which impacted the Panhandle region on the 16th, resulted in flash flooding and heavy rain. Rainfall of 4.27 inches in 6 hours was reported at Alligator Point in Franklin County and 7.22 inches over 24 hours was reported in Bay County on the 16th. In the Pensacola area, annual rainfall to date is just shy of 15 inches above normal.
Table 2. August precipitation totals and departures from normal (inches) for selected cities.
| Station | Total Rainfall | Departure from Normal |
| Pensacola | 10.99 | +3.49 |
| Tallahassee | 5.55 | -2.05 |
| Jacksonville | 7.48 | +0.60 |
| Orlando | 6.14 | -1.55 |
| Tampa | 7.43 | -1.60 |
| Miami | 7.29 | -2.29 |
| Key West | 4.14 | -1.23 |
Figure 1. A graphical depiction of the monthly rainfall departure from normal (inches) for August (courtesy of NOAA, NWS).
La Niña Watch.
A transition from ENSO-neutral to La Niña is favored in the next couple of months, with a 70-80% chance of La Niña during the Northern Hemisphere winter 2021-22. Over the last month, ENSO-neutral conditions continued with near-to-below average sea surface temperatures persisting in the central and eastern equatorial Pacific. The latest Niño index values ranged from -0.2 °C to -0.3 °C. As of now, forecasters anticipate La Niña to be of weak strength (seasonal average Niño-3.4 index values between -0.5°C to -0.9°C).
Hazardous Weather Events in August.
According to the Local Storm Reports issued by the local National Weather Service offices serving Florida, there were 700 individual local reports of hazardous weather events recorded across the state during the month of June (see Table 4 for a breakdown by event type). There were many reports of strong thunderstorm wind gusts and flooding throughout the month. Tropical Storm Fred impacted much of the Florida Panhandle on August 16 with rain bands and strong wind gusts of more than 50 mph in places. One injury was reported in Bay County when a tree fell on a car. Lightning strikes resulted in several injuries during the month. Two people were hospitalized with injuries after being struck by lightning at Saint Petersburg Beach on the 12th and two more people suffered injuries after being struck by lightning in Clearwater and Safety Harbor on the 13th. A fatality resulted when a kitesurfer was blown off course and launched into a building at Fort Lauderdale Beach due to strong thunderstorms with gusty winds in the area.
Table 4. Breakdown of storm reports submitted in Florida during the month of August (compiled from Iowa State University/Iowa Environmental Mesonet).
| Report Type | Number of Reports |
| Flood | 33 |
| Flash Flood | 39 |
| Hail | 6 |
| Heavy Rain | 26 |
| Marine Thunderstorm Wind | 243 |
| Non-Thunderstorm Wind Gust | 70 |
| Tornado/Waterspout/Funnel Cloud | 3/11/3 |
| Thunderstorm Wind Damage | 27 |
| Thunderstorm Wind Gust | 216 |
| Lightning | 5 |
| Tropical Storm | 18 |
Drought-Related Impacts.
Throughout the month of August, drought did not impact any part of Florida, according to the U.S. Drought Monitor. The past few months have provided sufficient rainfall to prevent abnormally dry or drought conditions from developing.
As of August 31, the Lake Okeechobee water level was at 14.69 ft. above sea level (Feet-NGVD29), which is just above the average for this time of the year. At the first of the month, the water level was 13.72 ft. above sea level.
Agriculture-Related Impacts.
During mid-August, topsoil moisture levels were adequate for 68% of the state and short in 3%, while 29% of the state was in surplus. By the end of August, topsoil moisture levels were adequate in 77% of the state and short in 3%, while 20% of the state was in surplus. Much of the state experienced fair (13%), good (54%), or excellent (30%) pasture and range conditions by the end of the month. For more information, consult the weekly Crop Progress and Conditions report published by the USDA's National Agricultural Statistics Service.
Appendix 1
Additional August departures from normal data for select Florida locations (Source: NWS).
| Station | Average Temperature (˚F) | Departure from Normal (˚F) | Total Rainfall (in.) | Departure from Normal (in.) |
| Gainesville | 81.9 | +0.6 | 8.21 | +1.81 |
| Sarasota | 83.4 | 0 | 9.33 | +0.22 |
| Melbourne | 82.9 | -0.5 | 7.08 | +0.41 |
| Fort Myers | 82.7 | +1.3 | 7.75 | -1.00 |
| West Palm Beach | 84.5 | +1.3 | 9.90 | +1.22 |
Appendix 2
Select daily record high maximum temperatures tied or broken during August (compiled from NOAA).
| Location | Date | Record (˚F) | Broken/Tied | Last |
| Key West | 1 | 94 | Broken | 93 in 2020 |
| Miami Beach | 1 | 96 | Broken | 93 in 1999 |
| Quincy | 2 | 99 | Tied | 99 in 2010 |
| Plant City | 6 | 98 | Tied | 98 in 1980 |
| Plant City | 7 | 98 | Broken | 97 in 2020 |
| Key West | 9 | 95 | Broken | 94 in 2020 |
| Crestview | 10 | 97 | Tied | 97 in 2015 |
| Tampa | 12 | 96 | Tied | 96 in 1972 |
| Tampa | 18 | 97 | Broken | 95 in 1960 |
| Clermont | 19 | 99 | Broken | 97 in 2018 |
| Orlando | 19 | 97 | Tied | 97 in 2005 |
| Plant City | 20 | 100 | Broken | 98 in 2017 |
| Punta Gorda | 20 | 97 | Tied | 97 in 2014 |
| Gainesville | 20 | 95 | Tied | 95 in 2016 |
| Clermont | 21 | 98 | Broken | 97 in 2017 |
| Plant City | 21 | 100 | Broken | 99 in 1902 |
| Daytona Beach | 21 | 97 | Broken | 96 in 2016 |
| Clermont | 22 | 98 | Broken | 97 in 2016 |
| Punta Gorda | 22 | 98 | Broken | 97 in 2018 |
| Daytona Beach | 23 | 94 | Broken | 93 in 2015 |
| Punta Gorda | 23 | 98 | Broken | 97 in 2016 |
| Tampa | 25 | 96 | Tied | 96 in 2020 |
Appendix 3
Select daily record high minimum temperatures tied or broken during August (compiled from NOAA).
| Location | Date | Record (˚F) | Broken/Tied | Last |
| Clermont | 1 | 77 | Broken | 75 in 2019 |
| Tarpon Springs | 1 | 82 | Broken | 80 in 1999 |
| Venice | 1 | 83 | Tied | 83 in 2012 |
| Fort Myers | 1 | 80 | Broken | 79 in 1999 |
| Tampa | 1 | 83 | Tied | 83 in 1999 |
| Key West | 1 | 86 | Broken | 84 in 1977 |
| Punta Gorda | 2 | 80 | Broken | 79 in 1999 |
| Venice | 2 | 84 | Broken | 79 in 2012 |
| Fort Myers | 2 | 79 | Broken | 78 in 2012 |
| Key West | 2 | 86 | Broken | 84 in 1962 |
| Lakeland | 2 | 78 | Broken | 76 in 1958 |
| Key West | 5 | 86 | Broken | 84 in 2020 |
| Key West | 7 | 85 | Broken | 84 in 2020 |
| Cross City | 9 | 76 | Broken | 75 in 2019 |
| Key West | 9 | 87 | Broken | 85 in 2020 |
| Lakeland | 11 | 77 | Broken | 76 in 1991 |
| Fort Lauderdale Beach | 12 | 83 | Broken | 82 in 2004 |
| Daytona Beach | 13 | 83 | Broken | 79 in 2013 |
| Fort Pierce | 13 | 82 | Broken | 81 in 1937 |
| West Palm Beach | 15 | 83 | Broken | 81 in 2016 |
| Usher Tower | 16 | 79 | Broken | 76 in 2017 |
| Orlando | 16 | 79 | Broken | 78 in 2010 |
| Daytona Beach | 17 | 79 | Broken | 78 in 2010 |
| Perry | 18 | 77 | Broken | 76 in 2010 |
| Miami | 18 | 83 | Broken | 82 in 2015 |
| Jacksonville Beach | 19 | 81 | Tied | 81 in 2009 |
| Clermont | 20 | 77 | Broken | 76 in 2016 |
| Cross City | 20 | 77 | Broken | 75 in 2010 |
| Tampa | 21 | 81 | Broken | 79 in 2018 |
| Usher Tower | 22 | 79 | Broken | 77 in 2015 |
| Miami | 22 | 82 | Broken | 81 in 2007 |
| Pensacola | 22 | 79 | Broken | 78 in 2017 |
| Quincy | 23 | 75 | Broken | 74 in 1993 |
| Key West | 23 | 86 | Broken | 84 in 2020 |
| Crestview | 23 | 77 | Broken | 75 in 2015 |
| Perry | 24 | 76 | Broken | 75 in 2019 |
| Miami | 24 | 84 | Broken | 82 in 2000 |
| Key West | 24 | 87 | Broken | 84 in 1964 |
| Clermont | 28 | 78 | Broken | 77 in 2020 |
| Perrine | 28 | 81 | Broken | 79 in 2005 |
| Clermont | 28 | 78 | Broken | 77 in 2020 |
| Usher Tower | 28 | 78 | Broken | 76 in 2012 |
| West Palm Beach | 28 | 83 | Broken | 81 in 2010 |
| Key West | 29 | 85 | Broken | 84 in 2014 |
| Crestview | 31 | 76 | Broken | 74 in 2020 |