
Prepared by Florida Climate Center
The Florida State University
Tallahassee, FL

June Key Points:
- Average temperatures were near normal during the month.
- Rainfall totals in June were mixed, with some places receiving well above normal rainfall and other places slightly below normal.
- Abnormally dry conditions (D0) persist in some places in South Florida, but moderate drought has dissipated with the onset of the wet season.
- Tropical Storm Claudette impacted the western Florida Panhandle, leading to high surf and localized flooding.
Average temperatures in June were near normal across the state. Average temperature departures ranged from -1.3F in Key West to +0.9F in Tampa for the month (see Table 1 and Appendix 1 for select cities). There were only a few daily high maximum temperature records set, but many daily high minimum records were set during the month (see Appendix 2).
Table 1. June average temperatures and departures from normal ( ̊F) for selected cities.
| Station | Mean Temperature | Departure from Normal |
| Pensacola | 81.3 | -0.4 |
| Tallahassee | 80.8 | 0 |
| Jacksonville | 79.1 | -1.2 |
| Orlando | 81.9 | +0.7 |
| Tampa | 83.8 | +0.9 |
| Miami | 82.7 | -0.1 |
| Key West | 82.8 | -1.3 |
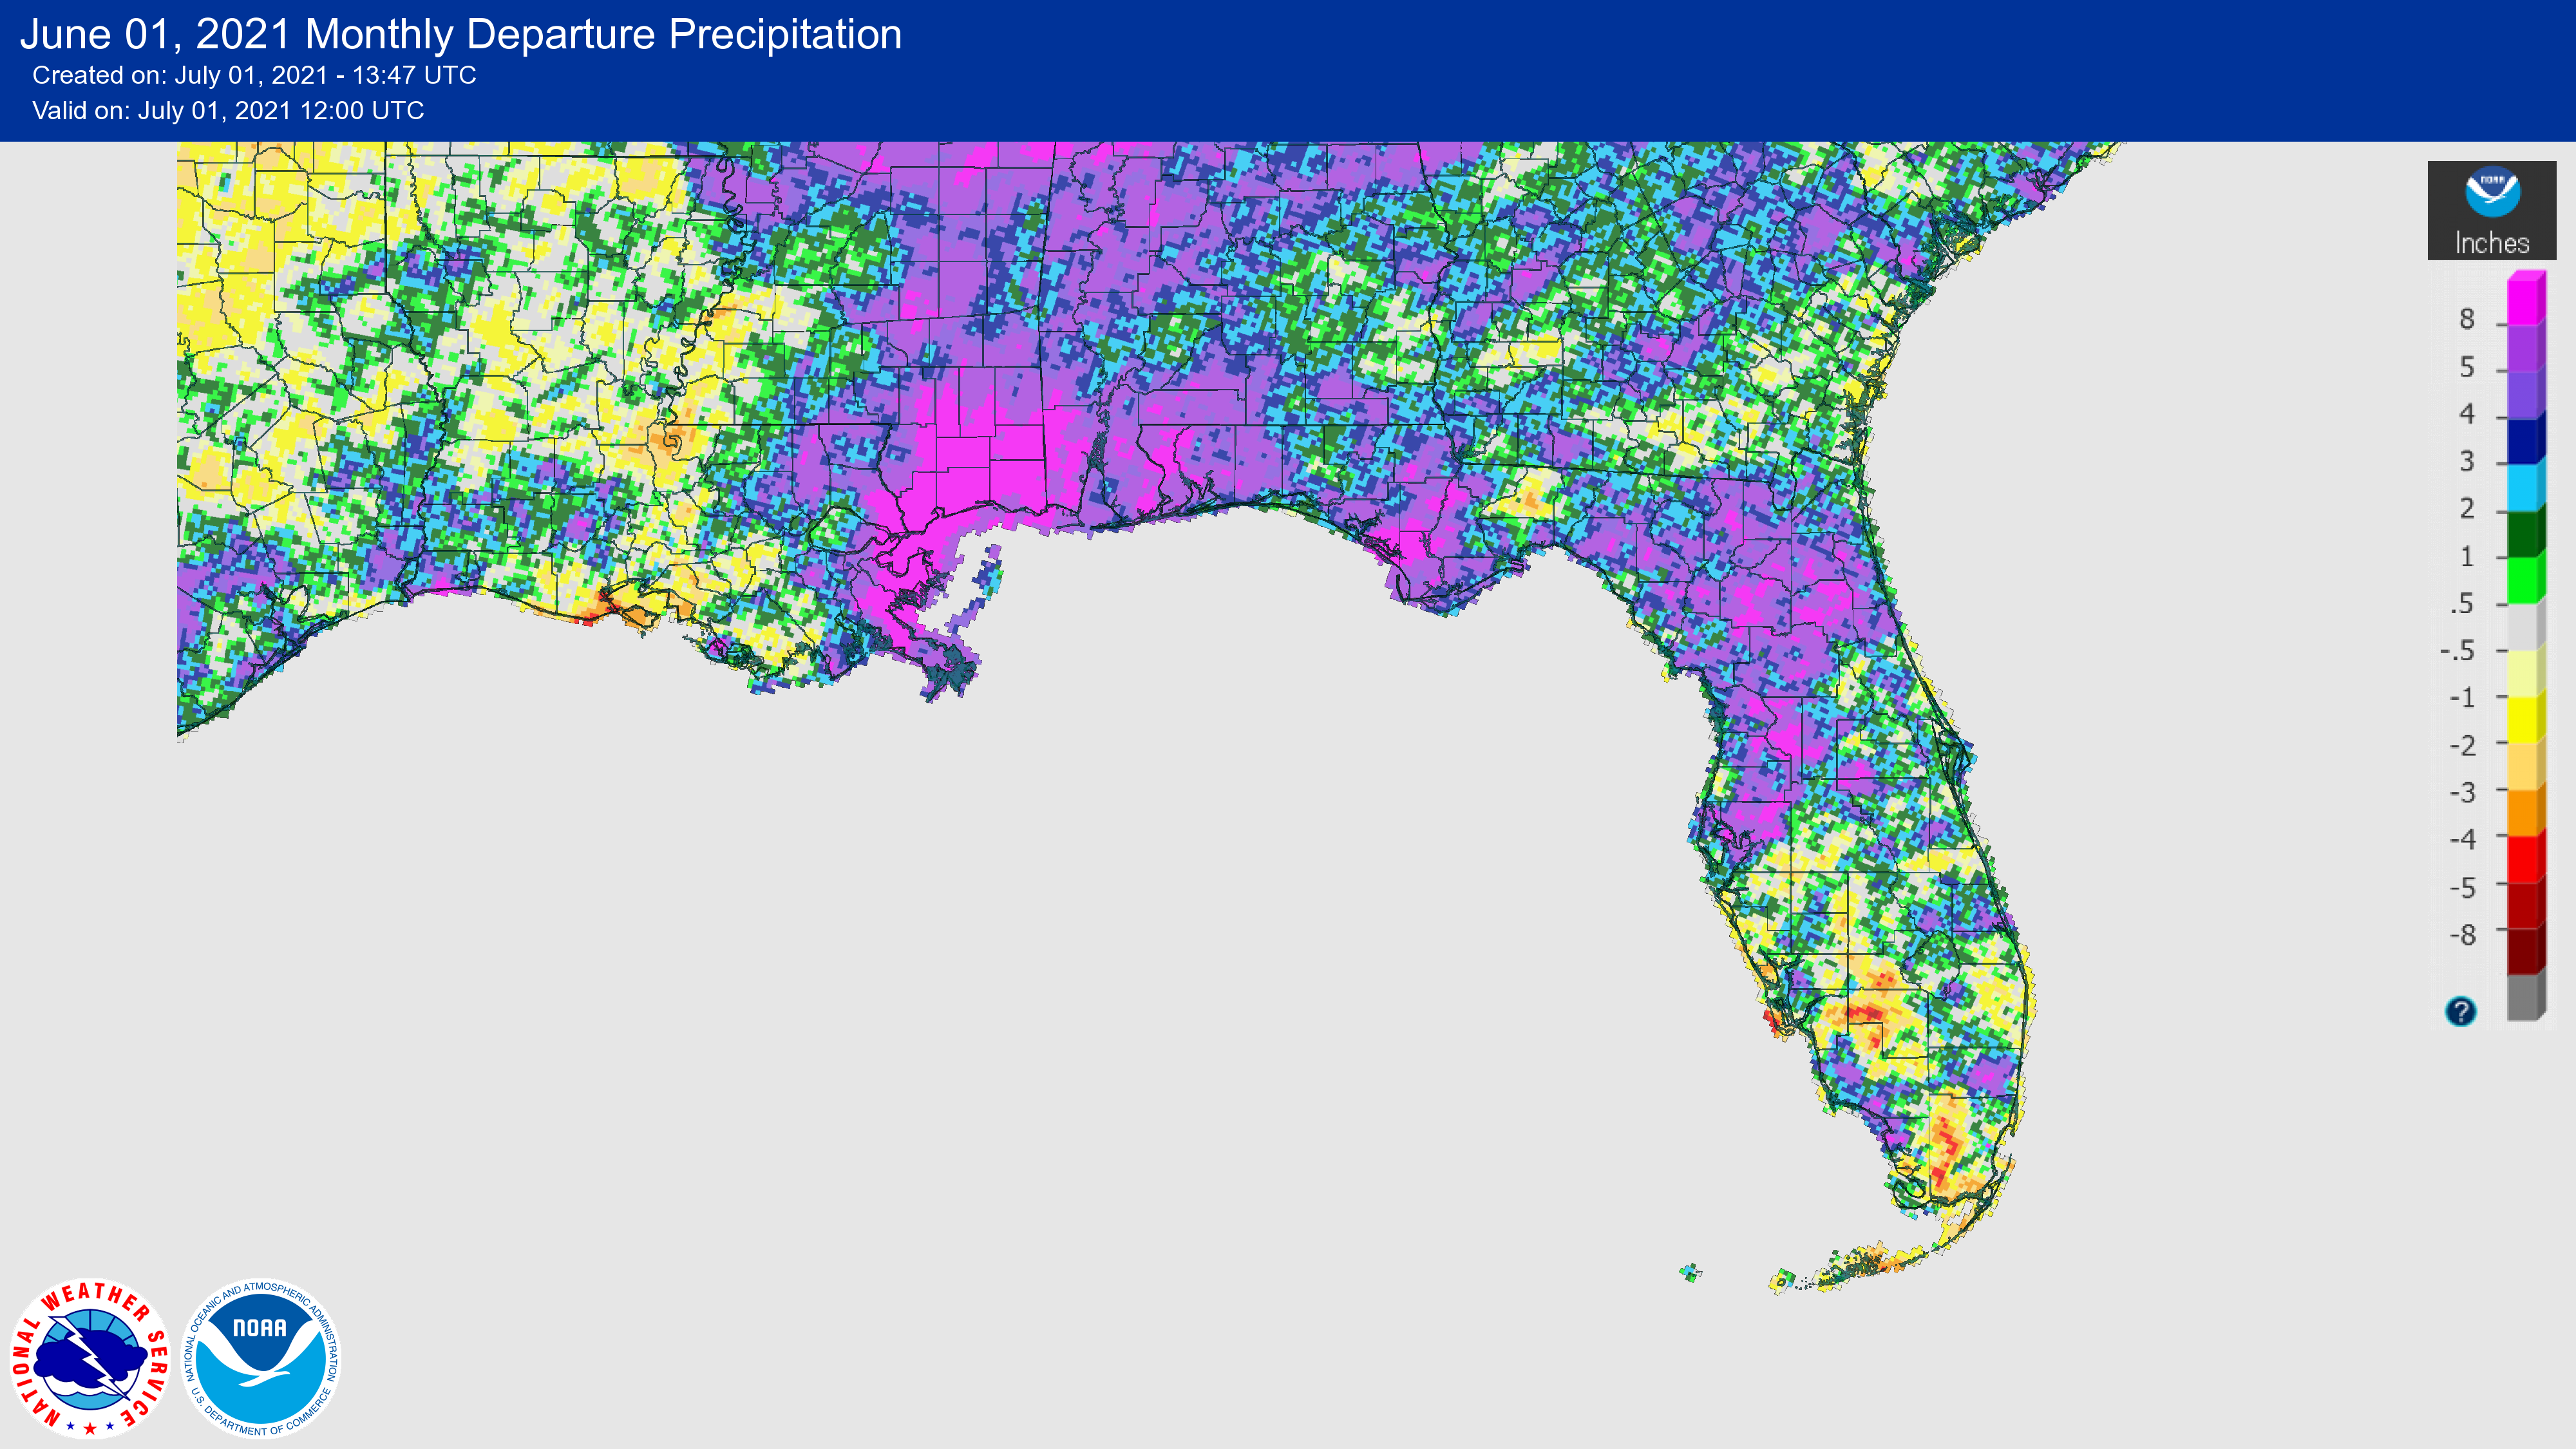
Rainfall departures from normal in June were mixed, with many areas well above normal and other areas slightly below normal. Rainfall across the state increased in June compared to the previous month with the onset of the wet season, which provided drought relief to some parts of south Florida though much of the southern Peninsula still had below normal rainfall (Figure 1). Monthly departures from normal ranged from +5.23 inches in Tampa to -1.93 inches in Miami (Table 2 and Appendix 1). The Panhandle was particularly wet during the middle to latter part of the month as Tropical Storm Claudette impacted the western Panhandle on the 19th, which was followed by a slow-moving cold front that produced heavy rainfall and thunderstorms and led to flash flooding in the area. Pensacola set a new one-day rainfall record for the 19th with 3.99 inches due to Tropical Storm Claudette. Several additional daily rainfall records were set during the month of June.
Table 2. June precipitation totals and departures from normal (inches) for selected cities.
| Station | Total Rainfall | Departure from Normal |
| Pensacola | 12.26 | +4.94 |
| Tallahassee | 5.84 | -1.92 |
| Jacksonville | 9.71 | +2.11 |
| Orlando | 7.06 | -0.99 |
| Tampa | 12.60 | +5.23 |
| Miami | 12.44 | +1.93 |
| Key West | 2.58 | -1.65 |
Figure 1. A graphical depiction of the monthly rainfall departure from normal (inches) for June (courtesy of NOAA, NWS).
ENSO-Neutral Conditions.
ENSO-neutral conditions currently exist and are likely to remain through the summer (78% chance for June-August). There is more uncertainty in the models after summer based on the latest IRI/CPC models. There is a 51% chance that neutral conditions will persist in the fall (August - October) and a slightly greater chance for La Niña conditions to potentially redevelop during fall and last through the winter season (66% chance during November-January).
Hazardous Weather Events in June.
According to the Local Storm Reports issued by the local National Weather Service offices serving Florida, there were 447 individual local reports of hazardous weather events recorded across the state during the month of June (see Table 4 for a breakdown by event type). Thunderstorm activity throughout the month resulted in flash flooding and peak wind gusts exceeding 40 mph in several instances. Straight-line winds impacted Brevard County on the 13th when winds were estimated to be between 65-70 mph, which resulted in significant damage to a couple of homes that had their roofs uplifted. Tropical Storm Claudette impacted the western Florida Panhandle on the 19th, with gusts peaking at 81 mph and high surf of 6-12 feet flooded local beaches and roadways. No injuries or fatalities were reported in Florida, though at least 14 people died in Alabama due to the storm.
Table 4. Breakdown of storm reports submitted in Florida during the month of June (compiled from Iowa State University/Iowa Environmental Mesonet).
| Report Type | Number of Reports |
| Flood | 19 |
| Coastal Flood | 2 |
| Flash Flood | 7 |
| Hail | 34 |
| Heavy Rain | 38 |
| Marine Thunderstorm Wind | 77 |
| Non-Thunderstorm Wind Gust | 2 |
| Tornado/Waterspout/Funnel Cloud | 0/13/3 |
| Thunderstorm Wind Damage | 76 |
| Thunderstorm Wind Gust | 165 |
| Lightning | 3 |
| Rip Currents | 5 |
| Wildfire | 3 |
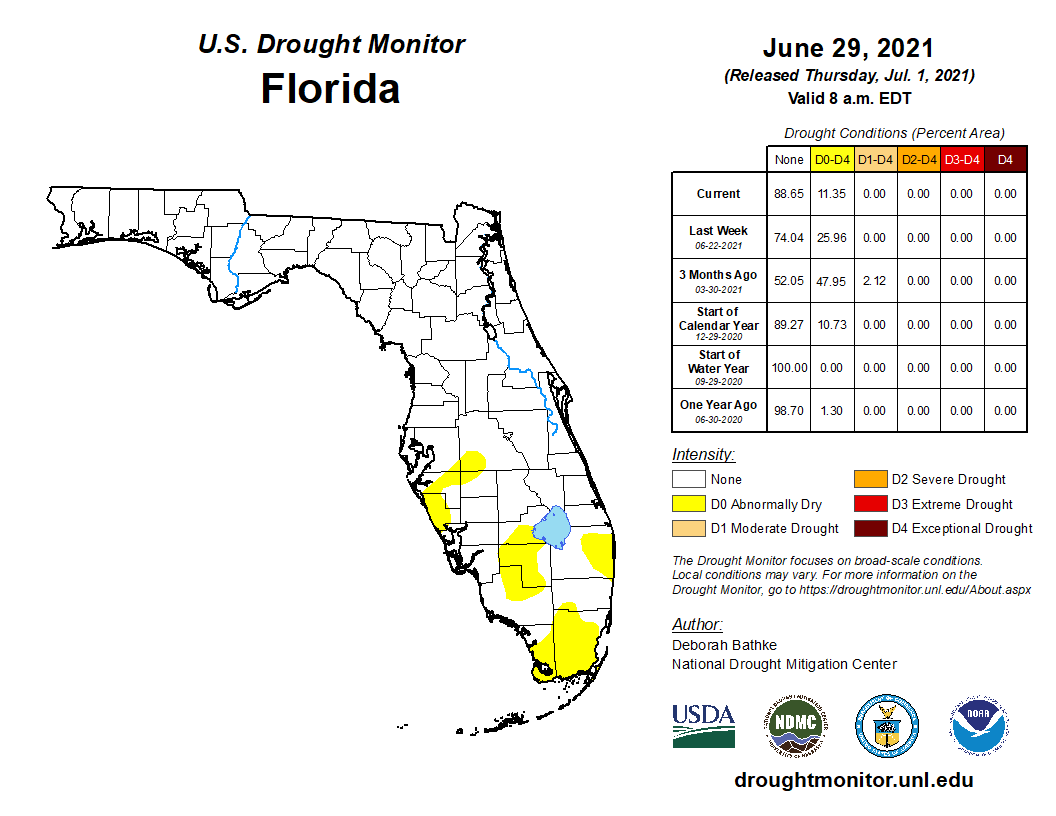
Drought-Related Impacts.
From early to mid-June, moderate drought (D1) existed across much of the southern Peninsula, and both northern and southern Florida were experiencing abnormally dry conditions. As of June 29, abnormally dry conditions existed across parts of the southern Florida Peninsula and any areas that were in moderate drought earlier in the month have dissipated. According to the U.S. Drought Monitor, about 11% of the state was experiencing abnormally dry conditions (D0) by the end of the month, down from 26% the week before.
As of June 30, the Lake Okeechobee water level was at 12.77 ft. above sea level (Feet-NGVD29), which is just below the average for this time of the year. At the first of the month, the water level was 12.79 ft. above sea level.
Agriculture-Related Impacts.
During mid-June, topsoil moisture levels were adequate for 60% of the state, short in 32%, and very short in 8%, while no part of the state was in surplus. By the end of June, topsoil moisture levels were adequate in 73% of the state, short in 10%, and very short in just 1% of the state; 16% of the state was in surplus. Much of the state had either fair (29%), good (53%) or excellent (10%) pasture and range conditions by the end of the month. For more information, consult the weekly Crop Progress and Conditions report published by the USDA's National Agricultural Statistics Service.
Appendix 1
Additional June departures from normal data for select Florida locations (Source: NWS).
| Station | Average Temperature (˚F) | Departure from Normal (˚F) | Total Rainfall (in.) | Departure from Normal (in.) |
| Gainesville | 79.8 | -0.1 | 11.38 | +3.82 |
| Sarasota | 82.6 | +0.8 | 9.20 | +2.15 |
| Melbourne | 81.4 | -0.5 | 6.61 | -0.49 |
| Fort Myers | 83.0 | +0.7 | 11.58 | +1.92 |
| West Palm Beach | 82.7 | +1.0 | 6.85 | -1.63 |
Appendix 2
Select daily record high minimum temperatures tied or broken during June (compiled from NOAA).
| Location | Date | Record (˚F) | Broken/Tied | Last |
| Orlando | 5 | 75 | Tied | 75 in 2019 |
| Vero Beach | 7 | 78 | Broken | 77 in 2016 |
| Daytona Beach | 7 | 78 | Broken | 77 in 1950 |
| Orlando | 7 | 78 | Broken | 77 in 1903 |
| Lakeland | 7 | 77 | Broken | 75 in 1982 |
| Daytona Beach | 8 | 79 | Broken | 78 in 2013 |
| Jacksonville Beach | 8 | 80 | Broken | 76 in 2011 |
| West Palm Beach | 8 | 80 | Tied | 80 in 2020 |
| Clermont | 9 | 77 | Broken | 76 in 2020 |
| Miami | 10 | 80 | Tied | 80 in 2020 |
| Fort Myers | 12 | 78 | Broken | 77 in 2009 |
| Bradenton | 13 | 78 | Broken | 77 in 2016 |
| Clermont | 13 | 76 | Broken | 75 in 2020 |
| Plant City | 13 | 77 | Broken | 76 in 2016 |
| Venice | 13 | 80 | Broken | 79 in 1997 |
| Fort Myers | 13 | 79 | Broken | 78 in 1998 |
| Jacksonville Beach | 18 | 78 | Broken | 77 in 2019 |
| Perrine | 19 | 79 | Broken | 76 in 1993 |
| Plant City | 19 | 77 | Broken | 76 in 1990 |
| Vero Beach | 19 | 78 | Broken | 76 in 2017 |
| West Palm Beach | 19 | 81 | Broken | 78 in 2017 |
| Lakeland | 19 | 78 | Broken | 76 in 1969 |
| Bradenton | 20 | 80 | Broken | 78 in 2019 |
| Plant City | 20 | 79 | Broken | 75 in 2019 |
| Sanford | 20 | 78 | Broken | 76 in 2013 |
| Key West | 20 | 83 | Tied | 83 in 2020 |
| Tampa | 20 | 82 | Broken | 80 in 2018 |
| Orlando | 20 | 79 | Broken | 77 in 2009 |
| Sanford | 21 | 79 | Broken | 75 in 2017 |
| Mayport | 26 | 78 | Broken | 76 in 2020 |
| Vero Beach | 27 | 77 | Broken | 76 in 2017 |
| Lakeland | 29 | 77 | Broken | 76 in 1978 |