
Prepared by Florida Climate Center
The Florida State University
Tallahassee, FL

May Key Points:
- May was near normal and dry for much of Florida.
- Moderate drought conditions (D1) expanded across southwestern Florida during the month, but this is likely to be ameliorated with the onset of the summer rainy season.
- Wildfire risk increased across the state, particularly over central and south Florida.
- Above-normal tropical cyclone activity is likely (60%) for the 2021 Atlantic Hurricane Season.
- Monthly climate data are now compared to the new normals (1991-2020), which were made official in early May.
Average temperatures in May were generally within +/- 2 ̊F of normal across the state. Average temperature departures ranged from -2.6 ̊F in Jacksonville to +2.7 ̊F in West Palm Beach for the month (see Table 1 and Appendix 1 for select cities) West Palm Beach had its warmest May on record. Many daily high maximum and daily high minimum temperature records were set during the month (see Appendices 2 and 3).
Table 1. May average temperatures and departures from normal ( ̊F) for selected cities.
| Station | Mean Temperature | Departure from Normal |
| Pensacola | 74.8 | -1.2 |
| Tallahassee | 74.0 | -1.2 |
| Jacksonville | 72.3 | -2.6 |
| Orlando | 78.5 | +1.2 |
| Tampa | 81.1 | +1.6 |
| Miami | 81.2 | +1.1 |
| Key West | 81.1 | 0 |
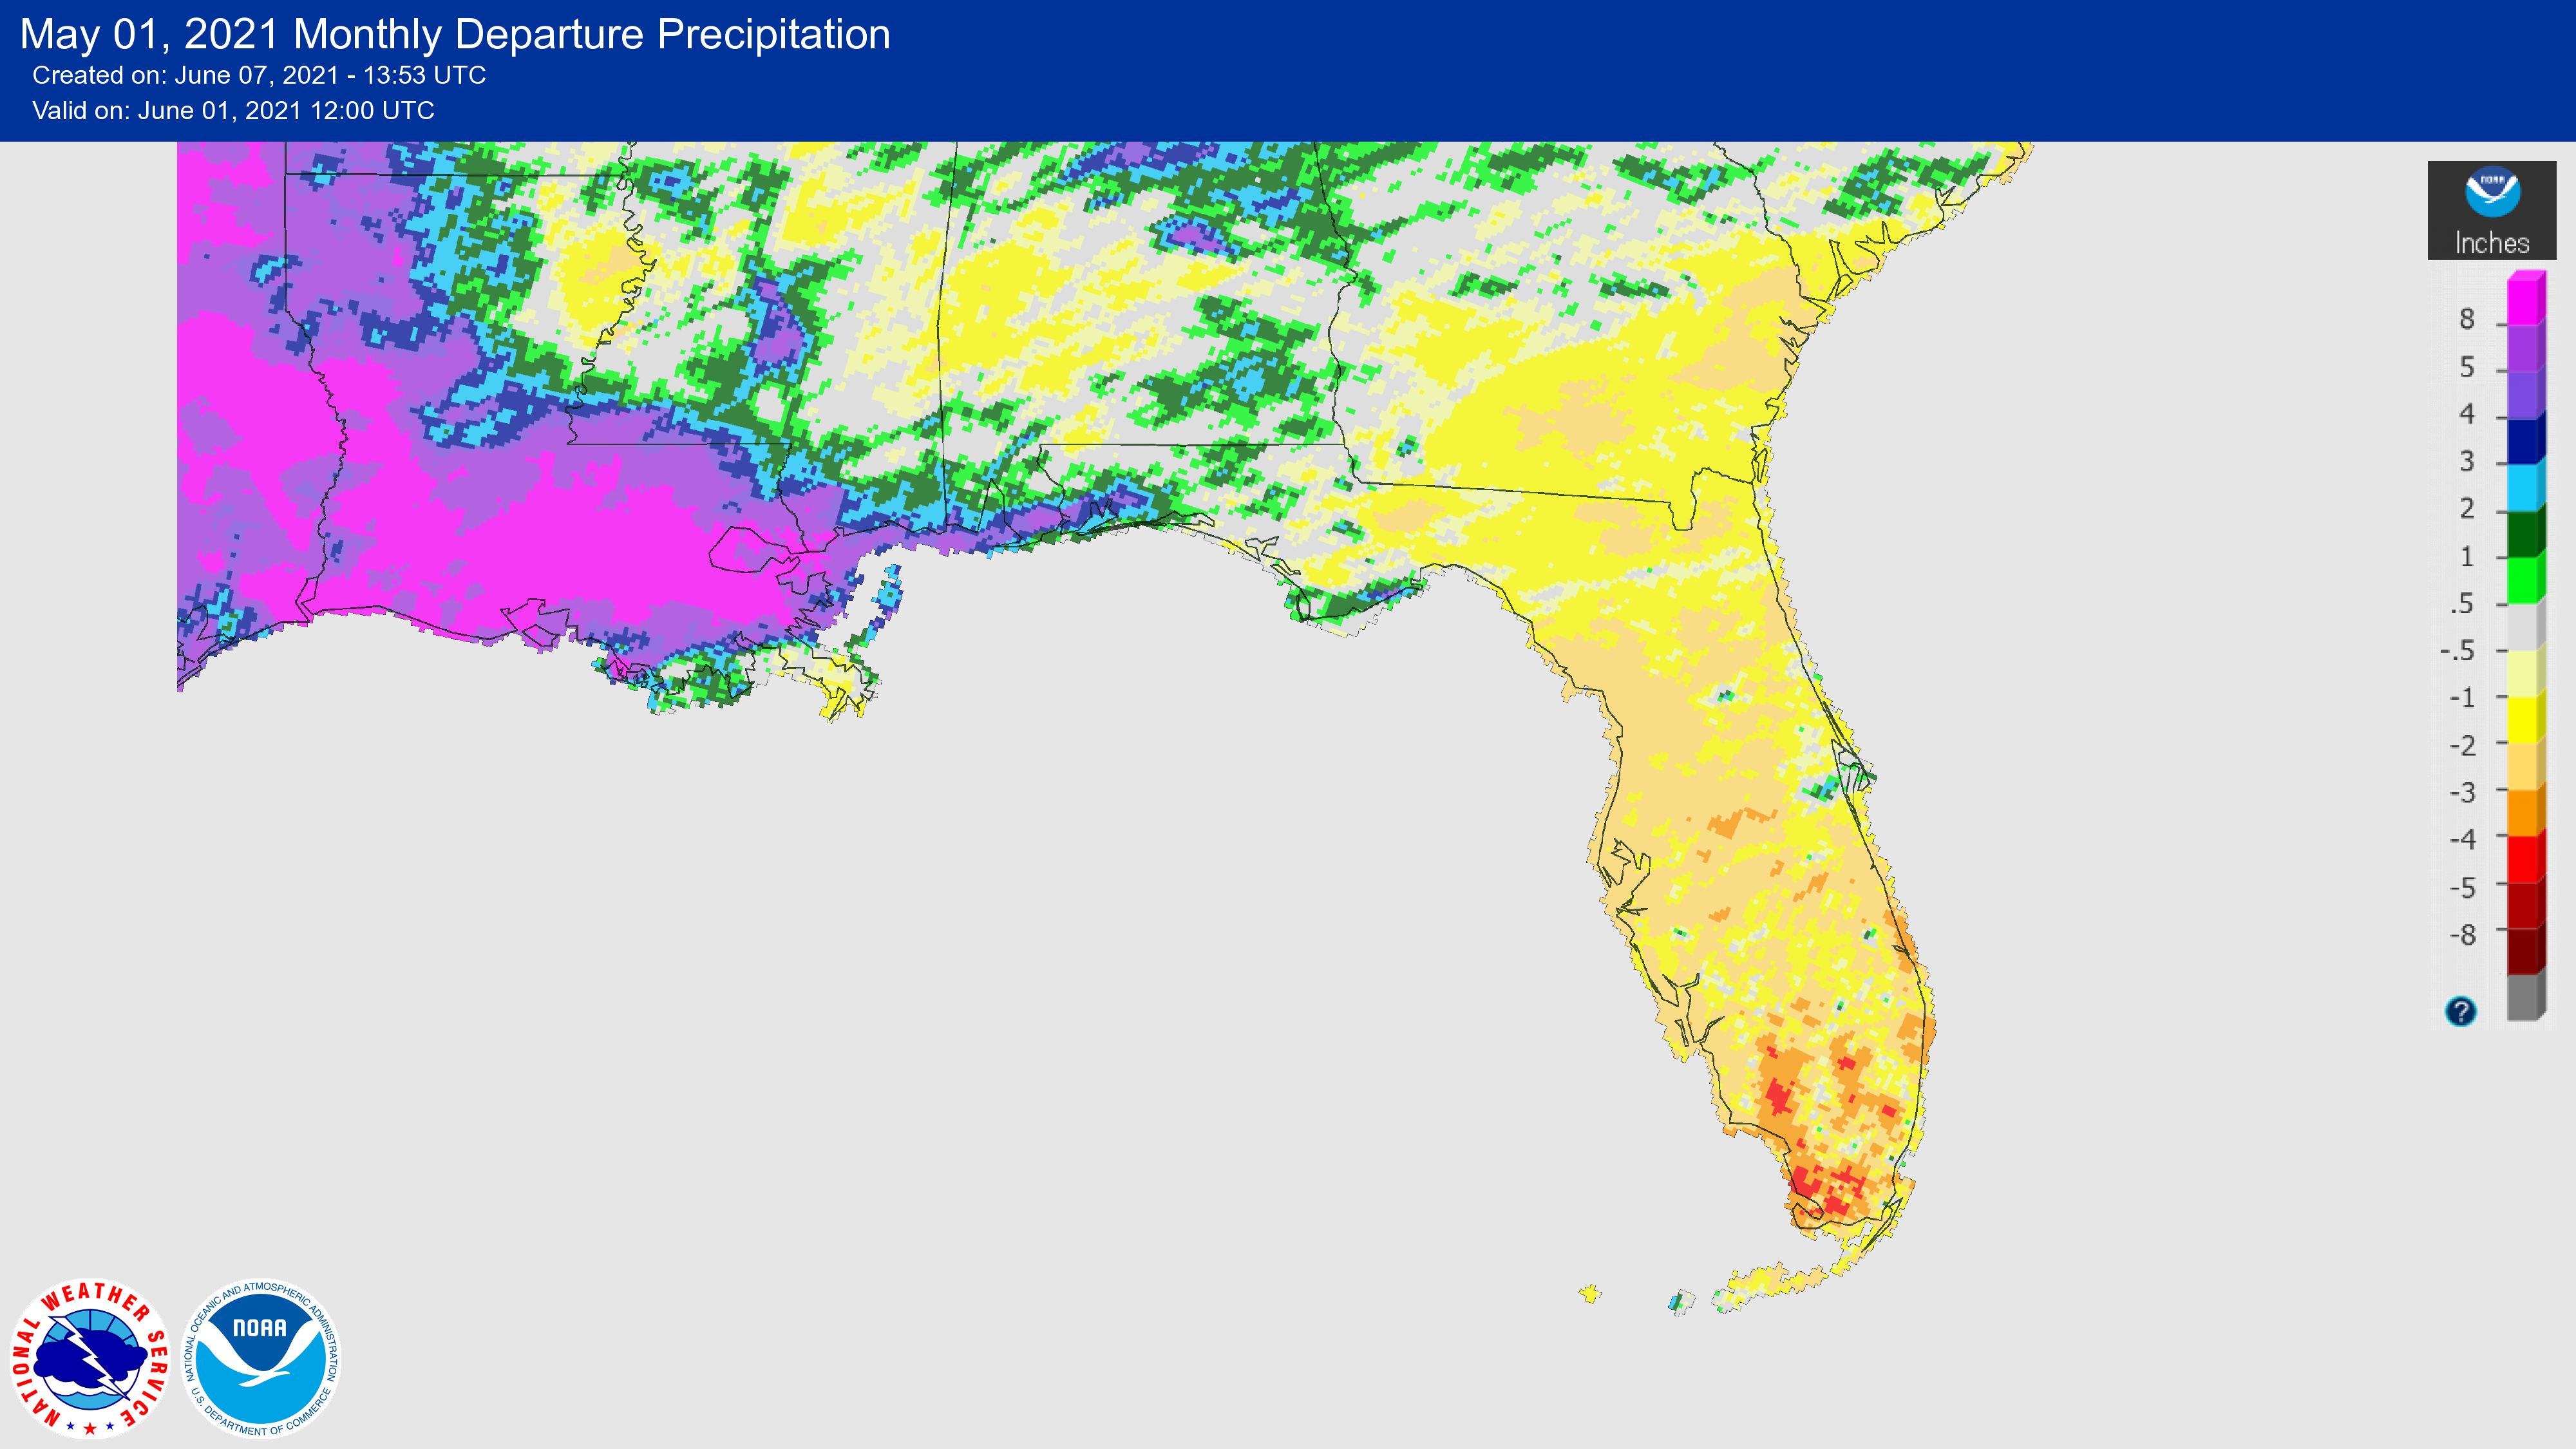
Rainfall totals in May were below normal across the state, especially in parts of south Florida, while the western Panhandle saw a surplus of rainfall. Much of Florida has been drier than normal over the past 90 days, and this trend continued in May (Figure 1). During mid to late May, a blocking pattern emerged over the eastern U.S. with a strong upper-level high pressure system commonly associated with slow-moving and persistent weather patterns. This led to heavy rainfall and wetter-than-normal conditions across the western and central Gulf Coast regions, but dry and hot conditions over Florida and much of the Southeast. The western Panhandle region was the only area with above normal rainfall during May. By the end of the month, south Florida had gone over 3 weeks without any measurable rainfall. Monthly departures from normal ranged from +4.59 inches in Pensacola to -4.30 inches in West Palm Beach (Table 2 and Appendix 1). Orlando and Ft. Myers had their driest May on record with 0.17 and 0.04 inches of rainfall, respectively. Several other cities ranked among the driest on record for May as well, including Lakeland (2nd driest), Homestead (4th driest), West Palm Beach (5th driest), and Ft. Pierce (3rd driest).
Table 2. May precipitation totals and departures from normal (inches) for selected cities.
| Station | Total Rainfall | Departure from Normal |
| Pensacola | 8.49 | +4.59 |
| Tallahassee | 1.46 | -1.90 |
| Jacksonville | 0.48 | -2.94 |
| Orlando | 0.17 | -3.85 |
| Tampa | 0.16 | -2.44 |
| Miami | 2.68 | -3.64 |
| Key West | 3.09 | -0.03 |
Figure 1. A graphical depiction of the monthly rainfall departure from normal (inches) for May (courtesy of NOAA, NWS).
ENSO-Neutral Conditions.
The La Niña advisory ended in early May, shifting to ENSO-neutral conditions. Neutral conditions are expected to persist through summer (67% chance June-August), with more uncertainty in the models after summer based on the latest IRI/CPC models. There is a chance for La Niña conditions to redevelop during late fall or winter (50-55% chance), but given large uncertainty confidence in ENSO-neutral for the coming seasons is highest.
Hazardous Weather Events in May.
According to the Local Storm Reports issued by the local National Weather Service offices serving Florida, there were 127 individual local reports of hazardous weather events recorded across the state during the month of May (see Table 4 for a breakdown by event type). Severe storms swept through the Panhandle on May 10th, and lightning struck I-10 causing an accident and two injuries. Wildfires were active throughout the month. As of May 25, there were 61 active wildfires across the state with most of those contained, according to the Florida Forest Service. The Indian River County fire, known as the Tree Frog Fire, has burned roughly 800 acres and shut down I-95 for part of a day. In addition, wildfires have destroyed or damaged homes in multiple counties including St. Lucie, Marion and Collier Counties.
Table 4. Breakdown of storm reports submitted in Florida during the month of May (compiled from Iowa State University/Iowa Environmental Mesonet).
| Report Type | Number of Reports |
| Flood | 5 |
| Hail | 11 |
| Marine Thunderstorm Wind | 13 |
| Non-Thunderstorm Wind Gust | 3 |
| Tornado/Waterspout/Funnel Cloud | 0/18/1 |
| Thunderstorm Wind Damage | 9 |
| Thunderstorm Wind Gust | 38 |
| Lightning | 2 |
| Rip Currents | 7 |
| Wildfire | 20 |
Drought-Related Impacts.
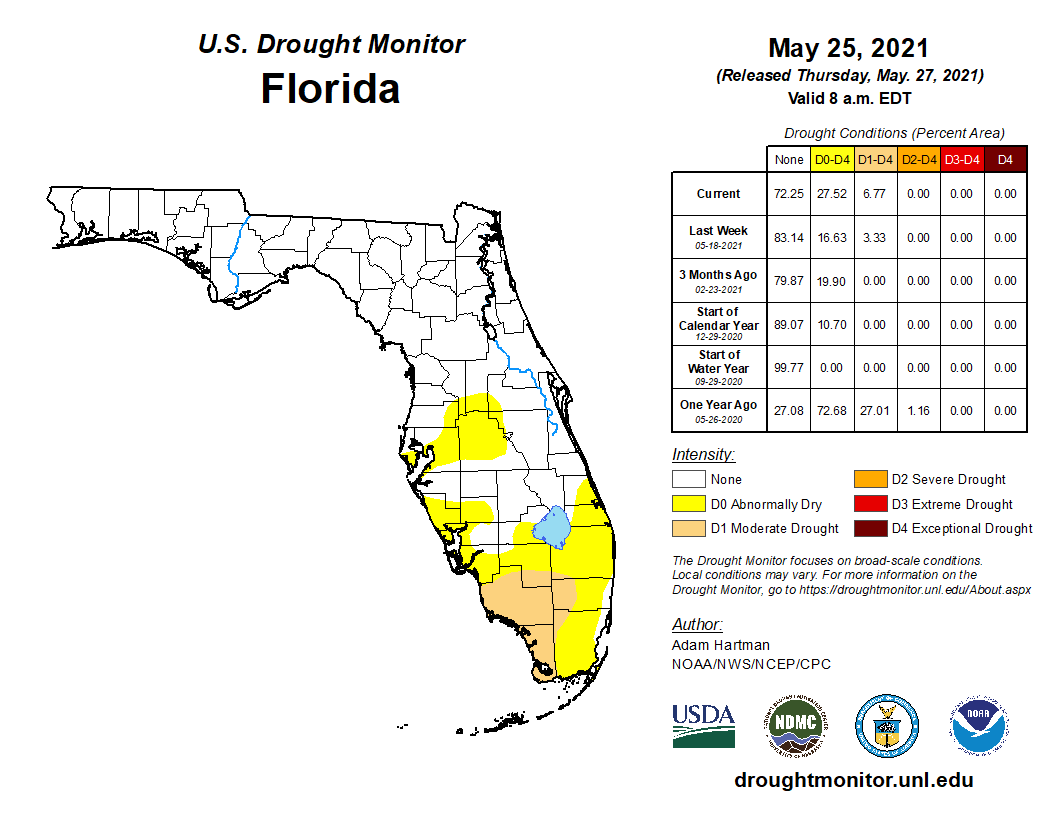
By the end of May, abnormally dry conditions existed across southern Florida and southwestern Florida was in moderate drought (D1). From early to mid-May, abnormally dry conditions existed across parts of the southern Peninsula, and pockets of moderate drought expanded across extreme southwestern Florida. According to the U.S. Drought Monitor, about 21% of the state was experiencing abnormally dry conditions (D0) and roughly 7% was experiencing moderate drought (D1) by the end of the month.
As of May 31, the Lake Okeechobee water level was at 12.82 ft. above sea level (Feet-NGVD29), which is just below the average for this time of the year. At the first of the month, the water level was 13.99 ft. above sea level.
Agriculture-Related Impacts.
During mid-May, topsoil moisture levels were adequate for 57% of the state, short in 31%, and very short in 3%, while 9% of the state was in surplus. By the end of May, topsoil moisture levels were adequate in 30% of the state, short in 46%, and very short in 24% of the state; no part of the state was in surplus. Much of the state had either fair (34%), good (18%) or excellent (5%) pasture and range conditions by the end of the month. For more information, consult the weekly Crop Progress and Conditions report published by the USDA's National Agricultural Statistics Service.
Appendix 1
Additional May departures from normal data for select Florida locations (Source: NWS).
| Station | Average Temperature (˚F) | Departure from Normal (˚F) | Total Rainfall (in.) | Departure from Normal (in.) |
| Gainesville | 73.4 | -1.6 | 1.10 | -1.98 |
| Sarasota | 78.6 | +0.8 | 0.29 | -2.29 |
| Melbourne | 78.3 | +0.2 | 1.34 | -2.19 |
| Fort Myers | 80.7 | +1.4 | 0.04 | -3.42 |
| West Palm Beach | 81.4 | +2.7 | 0.61 | -4.30 |
Appendix 2
Select daily record high maximum temperatures tied or broken during May (compiled from NOAA).
| Location | Date | Record (˚F) | Broken/Tied | Last |
| Punta Gorda | 1 | 93 | Tied | 93 in 2017 |
| West Palm Beach | 2 | 92 | Broken | 91 in 1962 |
| Plant City | 3 | 98 | Broken | 96 in 2002 |
| Orlando | 3 | 95 | Tied | 95 in 2002 |
| Clermont | 4 | 98 | Tied | 98 in 2002 |
| Punta Gorda | 4 | 96 | Broken | 94 in 1986 |
| Tampa | 4 | 94 | Broken | 92 in 2002 |
| Mayport | 4 | 93 | Broken | 91 in 2010 |
| Bradenton | 5 | 92 | Broken | 91 in 2003 |
| Clermont | 5 | 99 | Broken | 96 in 2002 |
| Fort Lauderdale Beach | 5 | 90 | Broken | 89 in 2017 |
| Wauchula | 5 | 96 | Broken | 95 in 2017 |
| Lakeland | 5 | 96 | Broken | 95 in 1995 |
| Jacksonville | 5 | 97 | Broken | 95 in 1995 |
| Daytona Beach | 6 | 95 | Broken | 93 in 2003 |
| Lisbon | 6 | 95 | Broken | 92 in 1991 |
| Fort Lauderdale | 7 | 92 | Tied | 92 in 2020 |
| Perrine | 7 | 91 | Broken | 90 in 2020 |
| Hialeah | 8 | 99 | Broken | 93 in 1994 |
| Bradenton | 9 | 93 | Broken | 92 in 2003 |
| Fort Lauderdale Beach | 9 | 91 | Broken | 87 in 2019 |
| Hialeah | 9 | 98 | Broken | 96 in 1987 |
| Clermont | 11 | 97 | Tied | 97 in 2009 |
| Lakeland | 11 | 95 | Broken | 94 in 1995 |
| Miami | 13 | 94 | Tied | 94 in 2019 |
| Perrine | 14 | 94 | Broken | 92 in 2017 |
Appendix 3
Select daily record high minimum temperatures tied or broken during May (compiled from NOAA).
| Location | Date | Record (˚F) | Broken/Tied | Last |
| Orlando | 1 | 73 | Broken | 72 in 2017 |
| West Palm Beach | 2 | 77 | Tied | 77 in 2016 |
| Usher Tower | 3 | 73 | Broken | 70 in 2010 |
| Vero Beach | 3 | 74 | Broken | 73 in 2019 |
| Key West | 3 | 81 | Broken | 80 in 2019 |
| Tampa | 3 | 76 | Tied | 76 in 2016 |
| West Palm Beach | 3 | 78 | Broken | 76 in 2011 |
| Pensacola | 3 | 74 | Tied | 74 in 2002 |
| Cross City | 4 | 72 | Broken | 69 in 1956 |
| Wewahitchka | 4 | 74 | Broken | 72 in 2010 |
| Miami | 4 | 79 | Broken | 78 in 2010 |
| West Palm Beach | 4 | 78 | Tied | 78 in 1978 |
| Plant City | 5 | 74 | Broken | 73 in 2010 |
| Orlando | 5 | 76 | Broken | 74 in 2010 |
| Bradenton | 6 | 77 | Broken | 74 in 2003 |
| Clermont | 6 | 74 | Broken | 72 in 1956 |
| Lisbon | 6 | 73 | Broken | 72 in 2010 |
| Plant City | 6 | 76 | Broken | 72 in 2018 |
| Sanford | 6 | 75 | Broken | 74 in 2002 |
| Lakeland | 6 | 75 | Broken | 72 in 1991 |
| Punta Gorda | 7 | 75 | Broken | 74 in 1978 |
| Key West | 10 | 81 | Broken | 80 in 2014 |
| West Palm Beach | 10 | 78 | Broken | 77 in 2019 |
| Venice | 12 | 75 | Tied | 75 in 1974 |
| Key West | 12 | 81 | Broken | 80 in 2003 |
| Tampa | 12 | 77 | Tied | 77 in 2019 |
| Canal Point | 14 | 75 | Tied | 75 in 2015 |
| Sanford | 29 | 76 | Broken | 74 in 2000 |
| Tampa | 30 | 78 | Broken | 76 in 2017 |