
Prepared by Florida Climate Center
The Florida State University
Tallahassee, FL

Average temperatures in December were below normal across the state, finishing the year on a slightly cooler note. Departures from normal across the state ranged from +0.6 ̊F in Pensacola to -5 ̊F in Titusville (see Table 1 and Appendix 1 for select cities). Average maximum temperatures were near or slightly below normal across much of the state, while average minimum temperatures were well below normal, as much as -5 ̊F to -6 ̊F in central Florida. Many records were set for lowest daily maximum temperatures during the month, as well as lowest daily minimum temperatures (Appendices 2-3). Only one daily high maximum temperature record was set and that was in Ft. Lauderdale Beach with a record 85 ̊F set on the 1st of the month (beating the previous record of 84 ̊F set in 2016); no daily high minimum temperature records were set.
Table 1. December average temperatures and departures from normal ( ̊F) for selected cities.
| Station | Mean Temperature | Departure from Normal |
| Pensacola | 54.1 | +0.6 |
| Tallahassee | 51.2 | -2.0 |
| Jacksonville | 52.7 | -2.5 |
| Orlando | 59.4 | -3.2 |
| Tampa | 61.2 | -1.9 |
| Miami | 69.4 | -1.1 |
| Key West | 70.0 | -1.4 |
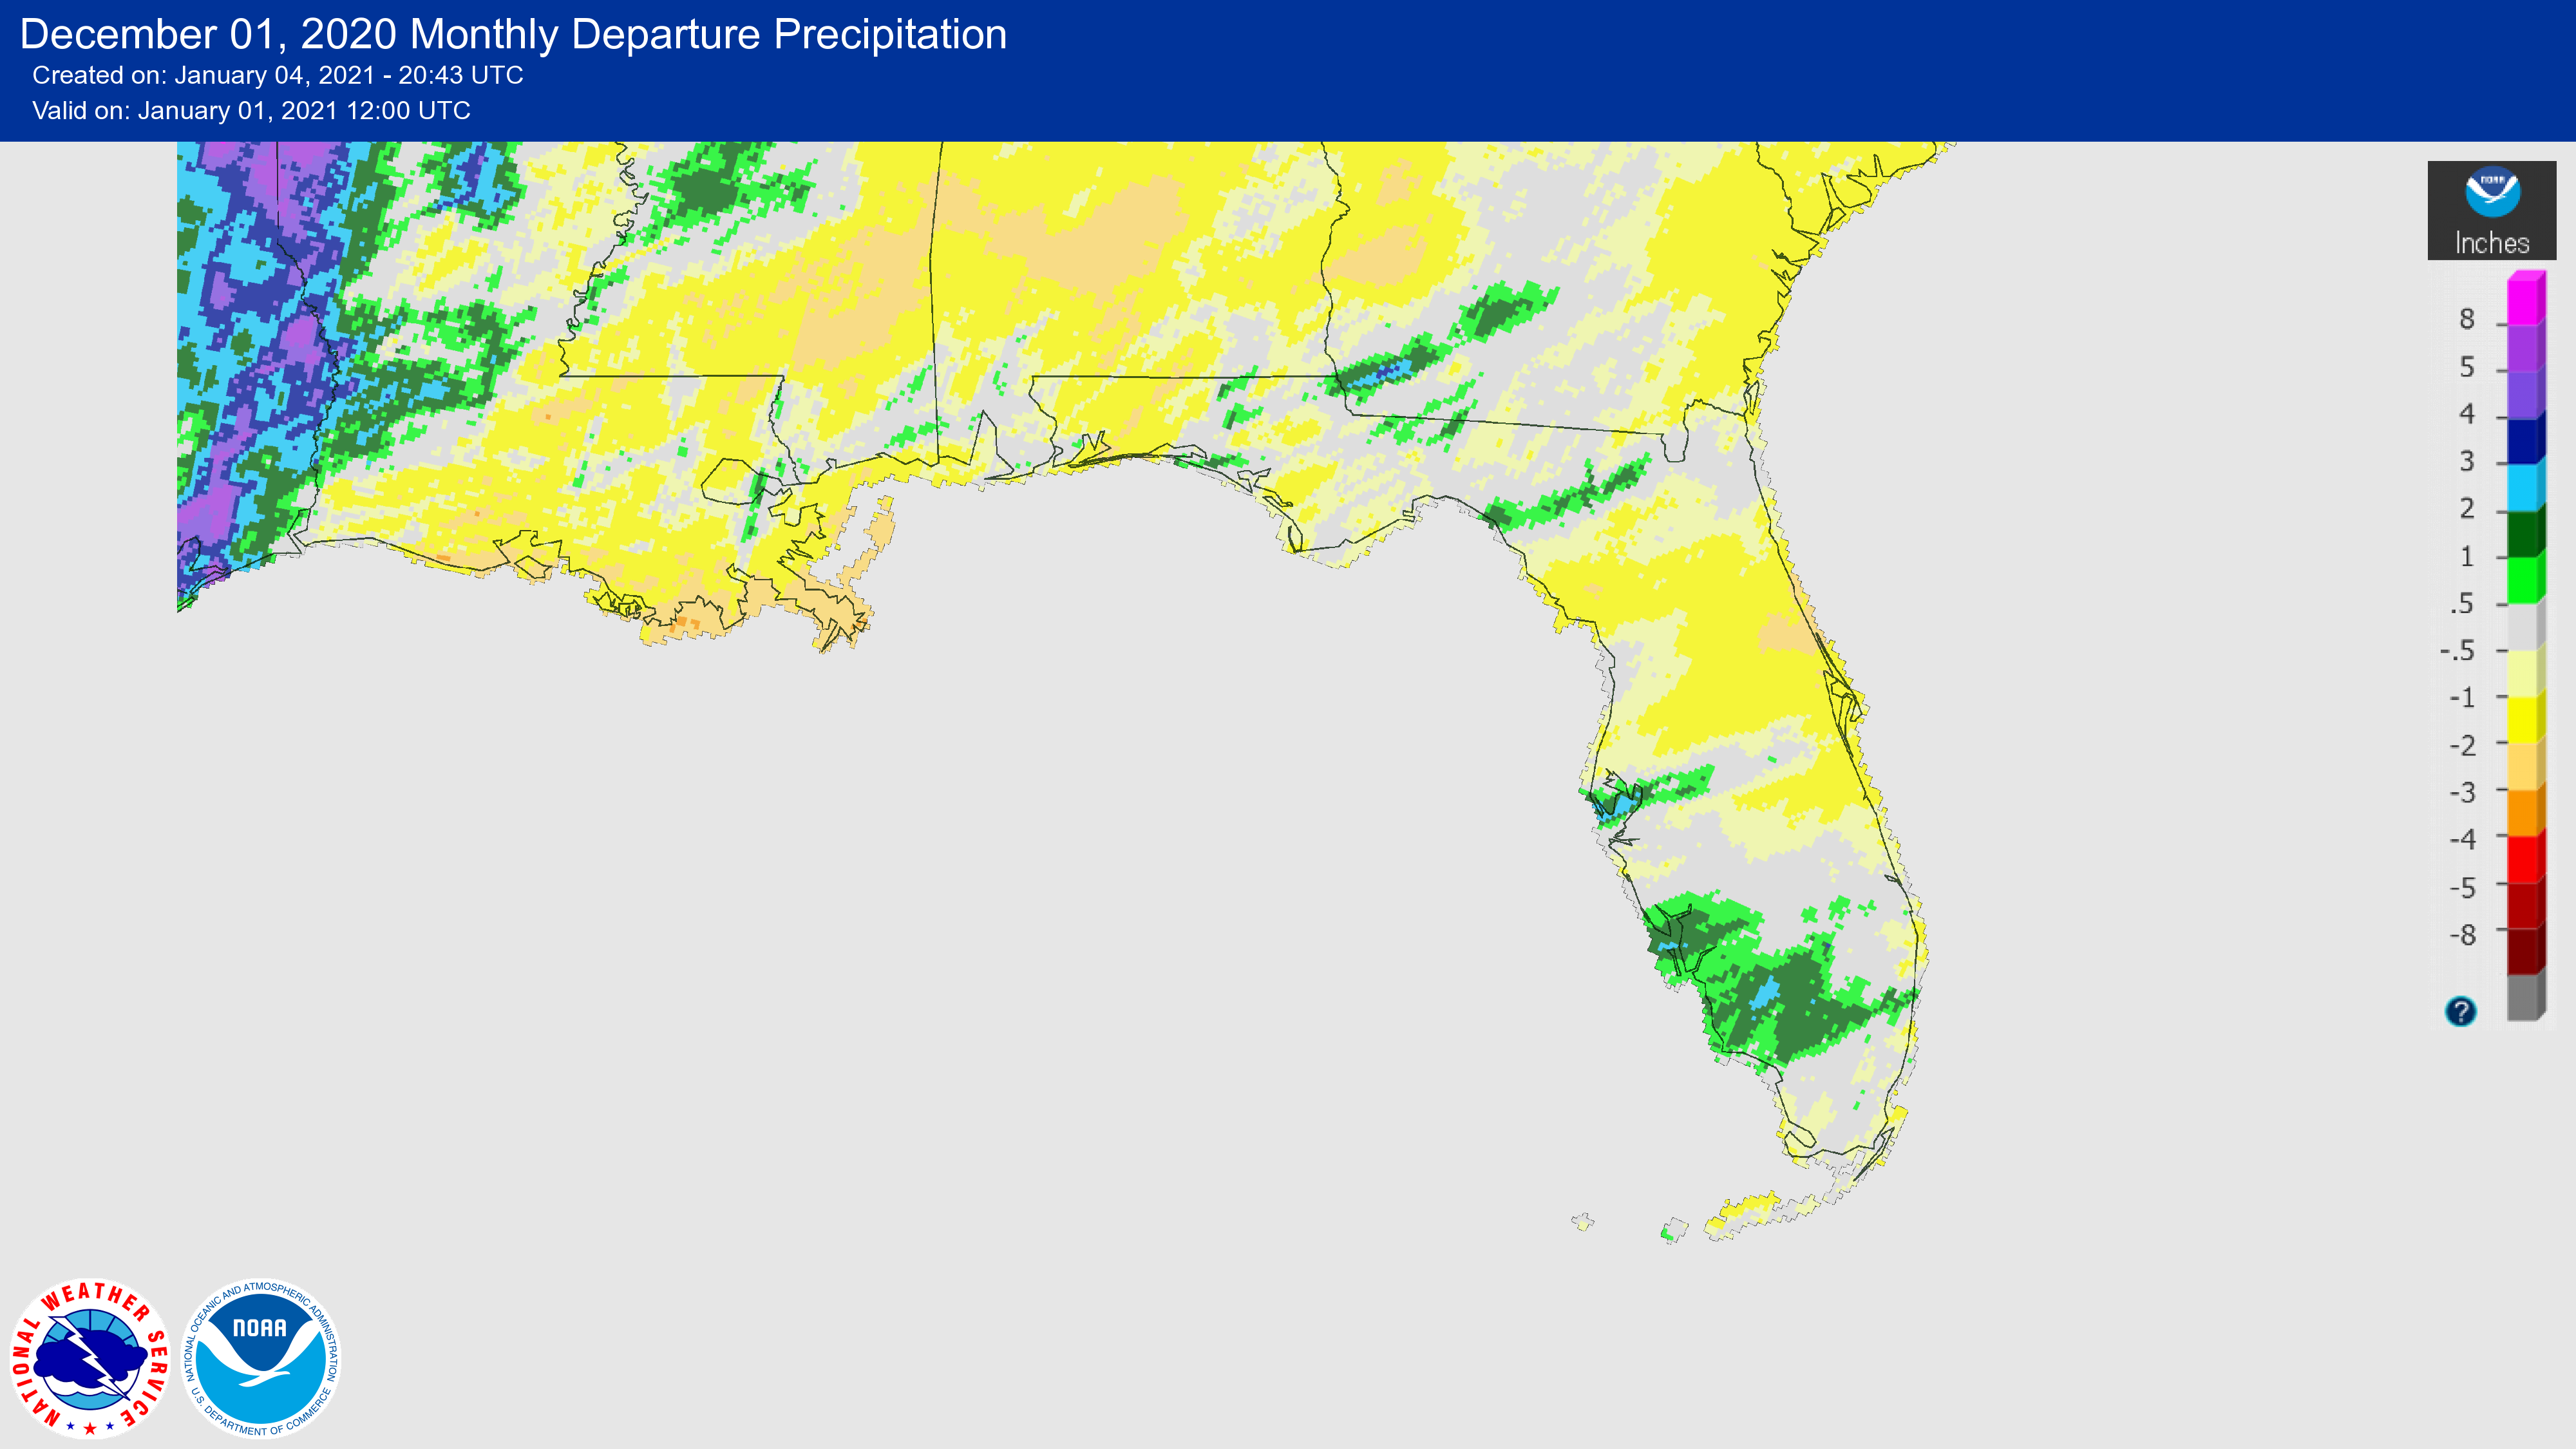
Rainfall totals in December were slightly below or below average across most of the state. Monthly departures from normal ranged from approximately -0.5 inches in Jacksonville and Gainesville to -1.85 inches in Melbourne (Table 2 and Appendix 1). While December was dry overall, there were exceptions. The southwestern peninsula experienced a surplus of precipitation, with departures from normal ranging from +0.5 inches in Fort Myers to +1.5 inches in Punta Gorda. Pensacola also recorded a surplus of precipitation with +0.21 inches. Despite below normal precipitation in most areas, several daily rainfall records were set, mostly on the 7th, 16th, and 17th of the month.
Table 2. December precipitation totals and departures from normal (inches) for selected cities.
| Station | Total Rainfall | Departure from Normal |
| Pensacola | 4.76 | +0.21 |
| Tallahassee | 3.17 | -0.73 |
| Jacksonville | 2.34 | -0.46 |
| Orlando | 1.04 | -1.54 |
| Tampa | 2.79 | +0.32 |
| Miami | 1.60 | -0.44 |
| Key West | 1.45 | -0.77 |
Figure 1. A graphical depiction of the monthly rainfall departure from normal (inches) for December (courtesy of NOAA, NWS).
La Niña Conditions in the Pacific.
La Niña conditions persisted in the tropical Pacific in December, as indicated by well below-average sea surface temperatures in the eastern Pacific Ocean. La Niña is forecasted to continue through the winter and early spring from January to March (~95% chance) with a potential change in spring (~50% chance of Neutral during April-June). As La Niña conditions persist, above-average temperatures and drier than average conditions are expected to continue across the southern tier of the U.S. over the next few months.
Hazardous Weather Events in December.
There were 169 individual local reports of hazardous weather events recorded in Florida during the month of December (see Table 4 for a breakdown by event type). A strong cold front moved through the state on the 24th and 25th, bringing thunderstorms and strong winds with reports of wind gusts as high as 40+ mph across much of the state ahead of the front. There were multiple reports of downed trees across northern Florida. Tornadoes were also reported mid-month in the Tampa and Lakeland areas.
Table 4. Breakdown of storm reports submitted in Florida during the month of December (compiled from Iowa State University/Iowa Environmental Mesonet).
| Report Type | Number of Reports |
| Marine Thunderstorm Wind | 36 |
| Non-Thunderstorm Wind Damage | 1 |
| Non-Thunderstorm Wind Gust | 22 |
| Tornado/Waterspout/Funnel Cloud | 13/1/0 |
| Thunderstorm Wind Damage | 44 |
| Thunderstorm Wind Gust | 51 |
| Hail | 0 |
| Rip Currents | 1 |
Drought-Related Impacts.
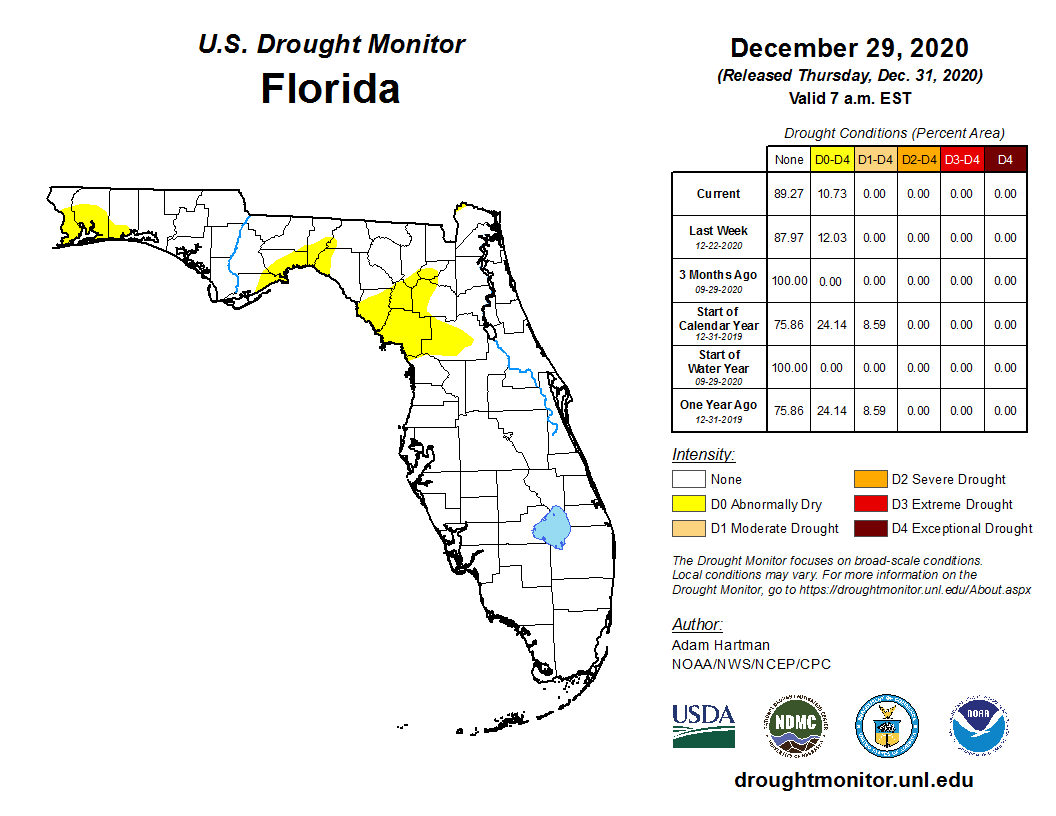
Drought did not impact any part of the state in December. However, by the end of December, 10.7% of the state was experiencing abnormally dry conditions (D0) compared to 0.8% at the beginning of the month, according to the U.S. Drought Monitor. The abnormally dry conditions impacted parts of the Panhandle and northwestern portions of the peninsula. The seasonal drought outlook indicates that drought development is likely through March 2021 in north Florida, including the Panhandle.
As of December 31, the Lake Okeechobee water level was at 15.81 ft. above sea level (Feet-NGVD29), which is above average for this time of the year. At the beginning of December, the water level was about 16 ft. above sea level.
Agriculture-Related Impacts.
The weekly Crop Progress and Condition reports published by the USDA’s National Agricultural Statistics Service are produced during the growing season months only, from April to November. The Crop Progress - State Stories, produced monthly December through March, indicate that pasture conditions remained mostly fair to good throughout the month. In early December, frosts caused damage to several pastures in the Panhandle and parts of the northern peninsula. Cattle conditions were good or excellent throughout the month, and cotton harvesting finished later than normal during the final week of December. Citrus activities were normal.
Appendix 1
Additional December departures from normal data for select Florida locations (Source: NWS).
| Station | Average Temperature (˚F) | Departure from Normal (˚F) | Total Rainfall (in.) | Departure from Normal (in.) |
| Gainesville | 53.2 | -2.9 | 1.89 | -0.49 |
| Sarasota | 62.7 | -0.8 | 1.93 | -0.6 |
| Melbourne | 61.1 | -1.9 | 0.72 | -1.85 |
| Fort Myers | 64.8 | -1.7 | 2.24 | +0.53 |
Appendix 2
Select daily record low maximum temperatures tied or broken during December (compiled from NOAA).
| Location | Date | Record (˚F) | Broken/Tied | Last |
| Miles City | 1 | 67 | Broken | 71 in 1999 |
| Tallahassee | 1 | 51 | Tied | 51 in 1964 |
| Fort Lauderdale | 2 | 65 | Broken | 66 in 1925 |
| Hialeah | 2 | 66 | Broken | 67 in 1965 |
| Perrine | 2 | 66 | Broken | 69 in 2008 |
| Sanford | 2 | 57 | Broken | 58 in 1979 |
| Stuart | 2 | 62 | Broken | 67 in 1999 |
| Vero Beach | 2 | 60 | Broken | 64 in 1979 |
| Wauchula | 3 | 58 | Broken | 63 in 2010 |
| Tampa | 8 | 57 | Broken | 59 in 2010 |
| Miles City | 8 | 64 | Broken | 66 in 2010 |
| Orlando | 8 | 57 | Broken | 60 in 2010 |
| Miami | 8 | 64 | Broken | 65 in 1973 |
| West Palm Beach | 8 | 63 | Broken | 65 in 1973 |
| Ft. Lauderdale Beach | 9 | 63 | Broken | 66 in 2010 |
| Perrine | 9 | 63 | Broken | 66 in 1997 |
| Marianna | 17 | 46 | Tied | 46 in 1953 |
| Titusville | 19 | 56 | Tied | 56 in 1974 |
| Bradenton | 26 | 52 | Broken | 53 in 1989 |
| Stuart | 26 | 54 | Broken | 56 in 1983 |
| Fort Pierce | 27 | 53 | Broken | 56 in 1983 |
| Fort Pierce | 27 | 53 | Broken | 54 in 2001 |
| Naples | 27 | 60 | Broken | 61 in 2010 |
| Perrine | 27 | 62 | Broken | 64 in 1995 |
| Stuart | 27 | 59 | Tied | 59 in 1995 |
Appendix 3
Select daily record low minimum temperatures tied or broken during December (compiled from NOAA).
| Location | Date | Record (˚F) | Broken/Tied | Last |
| Mountain Lake | 1 | 29 | Broken | 31 in 1945 |
| Tarpon Springs | 2 | 30 | Broken | 33 in 1957 |
| Marianna | 2 | 28 | Broken | 29 in 1999 |
| Lakeview | 2 | 38 | Broken | 39 in 1960 |
| Crestview | 2 | 23 | Broken | 24 in 2002 |
| Jacksonville | 2 | 33 | Broken | 34 in 1957 |
| Tarpon Springs | 3 | 30 | Tied | 30 in 1910 |
| Tarpon Springs | 9 | 30 | Tied | 30 in 1984 |
| Vero Beach | 9 | 38 | Tied | 38 in 1984 |
| West Palm Beach | 9 | 44 | Broken | 45 in 1968 |
| Orlando | 9 | 37 | Broken | 42 in 2017 |
| Perrine | 10 | 39 | Broken | 42 in 1996 |
| Tarpon Springs | 10 | 30 | Broken | 31 in 1955 |
| Tarpon Springs | 18 | 26 | Broken | 27 in 1901 |
| Marianna | 25 | 28 | Broken | 29 in 2000 |
| Marianna | 26 | 25 | Broken | 26 in 1999 |
| Orlando | 26 | 34 | Tied | 34 in 2010 |
| Gainesville | 27 | 24 | Broken | 25 in 1985 |