
Prepared by Florida Climate Center
The Florida State University
Tallahassee, FL

Summary:
- Average monthly temperatures in April were above normal across Florida.
- Monthly precipitation totals in April were below normal.
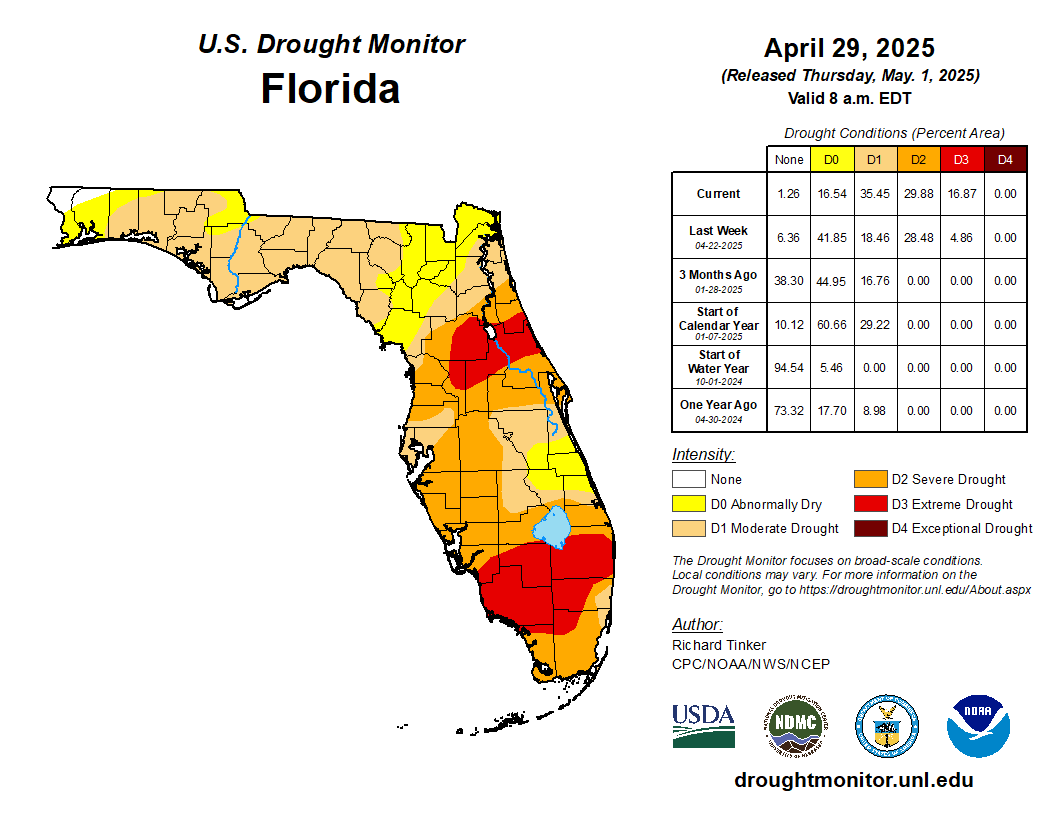
- By the end of April, approximately 17% of the state was in extreme drought (D3), 30% of the state was in severe drought (D2), 35% was in moderate drought (D1), and 17% was abnormally dry (D0), according to the U.S. Drought Monitor.
- ENSO-neutral conditions currently exist in the tropical Pacific Ocean and are expected to persist through the Northern Hemisphere summer, with a greater than 50% chance of persisting into fall (August-October 2025).
Table 1. April average temperatures and departures from normal ( ̊F) for selected cities.
| Station | Mean Temperature | Departure from Normal |
| Pensacola | 70.4 | +2.1 |
| Tallahassee | 70.8 | +3.5 |
| Jacksonville | 71.7 | +3.6 |
| Orlando | 74.9 | +2.7 |
| Tampa | 77.4 | +3.5 |
| Miami | 77.6 | +0.9 |
| Key West | 78.2 | +0.3 |
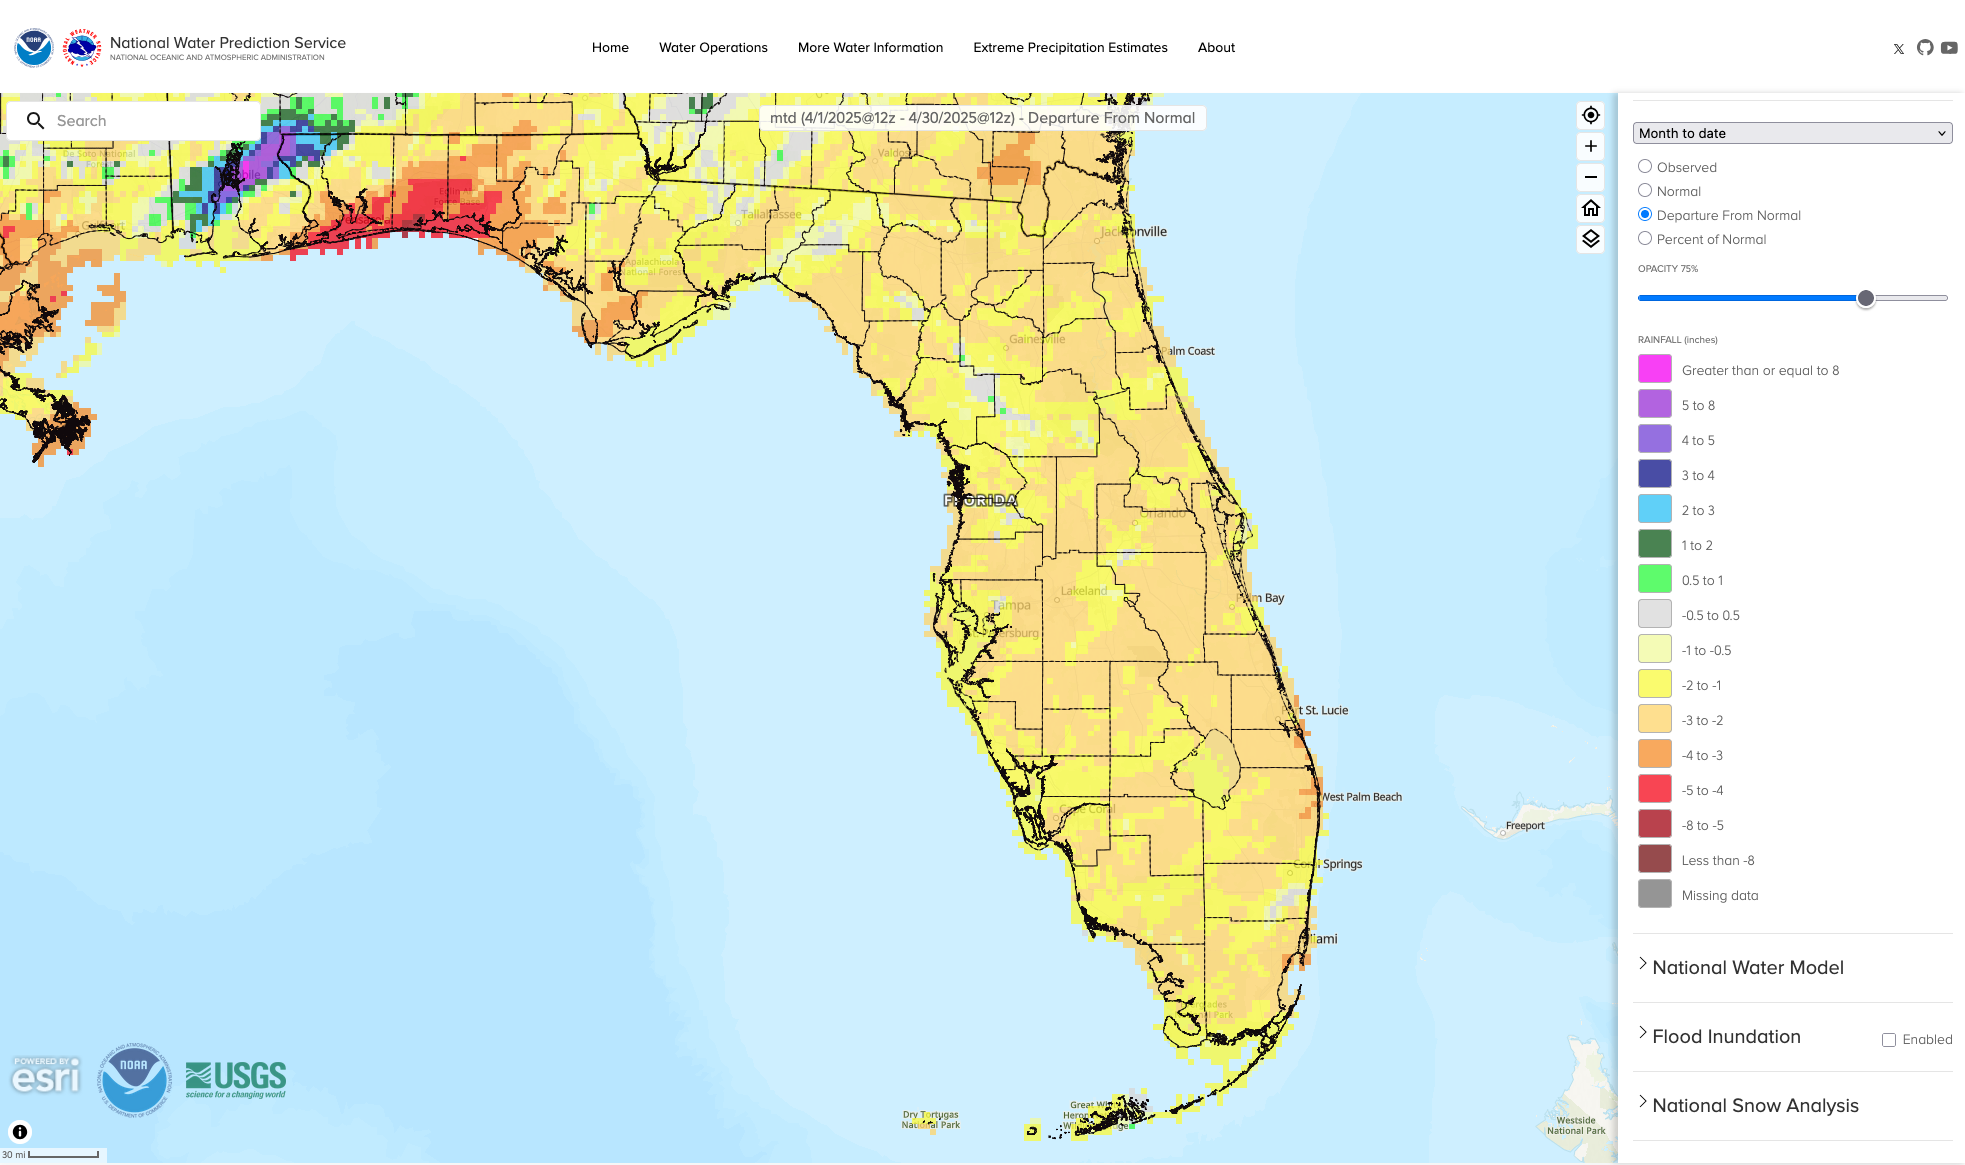
Monthly precipitation totals in April were below normal in Florida. The monthly precipitation departures from normal ranged from -4.32 inches in Pensacola to -0.77 inches in Key West (see Table 2 and Appendix 1 for select locations). Many locations in the Peninsula saw one of their top 5 driest Aprils on record, including Gainesville (3rd-driest), Daytona Beach (2nd-driest), Titusville (2nd-driest), Melbourne (2nd-driest), Venice (2nd-driest), Vero Beach (4th-driest), Naples (3rd-driest), and West Palm Beach (4th-driest). Many locations in the Peninsula have only seen a couple of inches of rain since February 1st, such as Daytona Beach and Lisbon. With below-normal rainfall and above-normal temperatures, water levels have been dropping, wildfire activity increased, the Panhandle saw increasing dryness, and severe and extreme drought expanded across the Peninsula during the month (Figure 2 below).
Table 2. April precipitation totals and departures from normal (inches) for selected cities.
| Station | Total Rainfall | Departure from Normal |
| Pensacola | 1.20 | -4.32 |
| Tallahassee | 2.48 | -1.05 |
| Jacksonville | 1.10 | -1.83 |
| Orlando | 0.37 | -2.21 |
| Tampa | 0.63 | -1.92 |
| Miami | 1.03 | -2.33 |
| Key West | 1.30 | -0.77 |
Figure 1. A graphical depiction of the monthly rainfall departure from normal (inches) for April (courtesy of NOAA, NWS).
ENSO-Neutral Conditions Present in Pacific.
NOAA issued its final La Niña Advisory on April 10, and ENSO-neutral conditions are currently present in the tropical equatorial Pacific Ocean. Over the past month, below-average sea surface temperatures weakened in the central and east-central equatorial Pacific Ocean, and the coupled ocean-atmosphere system reflected ENSO-neutral conditions. ENSO-neutral conditions are favored to continue through the Northern Hemisphere summer, with a 68% chance June-August 2025. There is a greater than 50% chance it will continue through the fall, August-October 2025.
Hazardous Weather Events in April.
According to the Local Storm Reports issued by the local National Weather Service offices serving Florida, there were 97 individual local reports of hazardous weather events recorded across the state during the month of April (see Table 3 for a breakdown by event type). Wildfires were reported in Broward and Pasco Counties, and one injury was reported as a result of the Key Vista Wildfire. The largest wildfire reported in the state was in extreme Southeast Miami-Dade County, the “344 Fire,” which burned a total of 26,719 acres and has been fully contained. Rip currents led to injuries and one fatality during the month. Numerous reports of pea-sized hail occurred during the month, and golf ball-sized hail was reported in Alachua County on the 11th.
Table 3. Breakdown of storm reports submitted in Florida during the month of April (compiled from Iowa State University/Iowa Environmental Mesonet).
| Report Type | Number of Reports |
| Heavy Rain | 1 |
| Flash Flood | 2 |
| Flood | 1 |
| Hail | 40 |
| Marine Thunderstorm Wind | 1 |
| Non-Thunderstorm Wind Gust | 3 |
| Tornado/Waterspout/Funnel Cloud | 1 / 1 / 1 |
| Thunderstorm Wind Damage | 4 |
| Non-Thunderstorm Wind Damage | 0 |
| Thunderstorm Wind Gust | 29 |
| Wildfire | 6 |
| Rip Currents | 7 |
Daily Record Events in April.
Table 4. Summary of daily records broken or set in Florida in April (source: NCEI Daily Weather Records).
| Category | Number of Records |
| Highest daily max. temp. | 61 |
| Highest daily min. temp. | 88 |
| Lowest daily max. temp. | 0 |
| Lowest daily min. temp. | 1 |
| Highest daily precipitation | 4 |
| Total | 154 |
Drought-Related Impacts.
Drought worsened in April with below-normal rainfall, decreasing water levels, and above-normal temperatures. In mid-April, roughly 2% of the state was in extreme drought (D3), 17% was in severe drought (D2), 22% of the state was in moderate drought (D1), and 18% was abnormally dry (D0), according to the U.S. Drought Monitor. By month’s end, approximately 17% of the state was in extreme drought (D3), 30% was in severe drought (D2), 35% was in moderate drought (D1), and 17% of the state was abnormally dry (D0) (Figure 2 below). Virtually all the state was in drought or pre-drought conditions by the end of the month.
As of April 30, the Lake Okeechobee water level was 11.29 ft. above sea level (Feet-NGVD29), which is below average for this time of year. At the first of the month, the water level was 12.56 ft. above sea level.
Figure 3. A graphical depiction of the latest drought conditions in Florida according to the U.S. Drought Monitor (courtesy of the National Drought Mitigation Center, University of Nebraska-Lincoln).
Agriculture-Related Impacts.
In mid-April, topsoil moisture conditions were adequate in 64% of the state, short in 29%, and very short in 5% of the state, while 2% of the state had surplus topsoil moisture conditions. By the end of April, topsoil moisture conditions were adequate in 41% of the state, short in 36%, and very short in 23% of the state; no portion of the state had surplus topsoil conditions. The entire 100cm soil profile has been drier than average across the Peninsula. For more information, consult the Crop Progress and Conditions report, which is published by the USDA’s National Agricultural Statistics Service.
Appendix 1
Additional April departures from normal data for select Florida locations (Source: NWS).
| Station | Average Temperature (˚F) | Departure from Normal (˚F) | Total Rainfall (in.) | Departure from Normal (in.) |
| Gainesville | 72.4 | +3.9 | 0.57 | -2.17 |
| Sarasota | 75.4 | +2.8 | 1.16 | -1.30 |
| Melbourne | 73.8 | +2.0 | 0.34 | -1.95 |
| Fort Myers | 76.9 | +2.1 | 0.76 | -1.68 |
| West Palm Beach | 77.1 | +2.2 | 0.21 | -3.47 |
Appendix 2
Select daily record high maximum temperatures (°F) tied or broken during April 2025 (compiled from NOAA).
| Location | Date | Record (˚F) | Broken/Tied | Last |
| Bradenton | 1 | 90 | Broken | 88 in 2023 |
| Clermont | 1 | 93 | Tied | 93 in 2021 |
| Plant City | 1 | 94 | Broken | 93 in 2021 |
| Miles City | 1 | 94 | Broken | 92 in 2006 |
| Ochopee | 1 | 93 | Broken | 89 in 2012 |
| Lakeland | 1 | 93 | Broken | 91 in 2021 |
| Clermont | 2 | 93 | Broken | 92 in 2017 |
| Fort Lauderdale | 2 | 89 | Broken | 87 in 2017 |
| Venice | 2 | 91 | Broken | 88 in 2000 |
| Gainesville | 2 | 92 | Tied | 92 in 2017 |
| Tampa | 2 | 94 | Broken | 89 in 2017 |
| Tarpon Springs | 3 | 92 | Broken | 91 in 2017 |
| Tampa | 3 | 92 | Broken | 91 in 2017 |
| Lakeland | 3 | 92 | Tied | 92 in 2017 |
| Bradenton | 4 | 91 | Broken | 89 in 2023 |
| Clermont | 4 | 94 | Tied | 94 in 2017 |
| Marianna | 4 | 89 | Broken | 87 in 2011 |
| Tampa | 4 | 93 | Broken | 88 in 2023 |
| Key West | 4 | 89 | Broken | 88 in 2022 |
| Chipley | 5 | 90 | Broken | 88 in 2023 |
| Pensacola | 6 | 81 | Broken | 79 in 1986 |
| Jacksonville | 6 | 90 | Broken | 89 in 1947 |
| Deland | 7 | 91 | Broken | 90 in 1938 |
| Lisbon | 7 | 91 | Broken | 89 in 2022 |
| Vero Beach | 7 | 91 | Broken | 90 in 2018 |
| Fort Lauderdale Beach | 8 | 88 | Broken | 87 in 2016 |
| Fort Pierce | 8 | 92 | Broken | 91 in 1939 |
| St. Augustine | 8 | 90 | Broken | 89 in 1999 |
| Tampa | 17 | 90 | Broken | 89 in 2013 |
| Lake City | 26 | 97 | Broken | 92 in 1958 |
| Crestview | 27 | 91 | Broken | 90 in 1996 |
| Tallahassee | 27 | 94 | Broken | 93 in 1989 |
| Chipley | 28 | 94 | Broken | 91 in 1989 |
| Tallahassee | 28 | 94 | Broken | 92 in 1948 |
| Chipley | 29 | 93 | Broken | 91 in 2017 |