
Prepared by Florida Climate Center
The Florida State University
Tallahassee, FL

Summary:
- Average monthly temperatures in August were above normal.
- Monthly precipitation totals were above normal in areas impacted by Hurricane Debby along the west coast and north-central Florida, but below normal in the Panhandle and east coast of Florida.
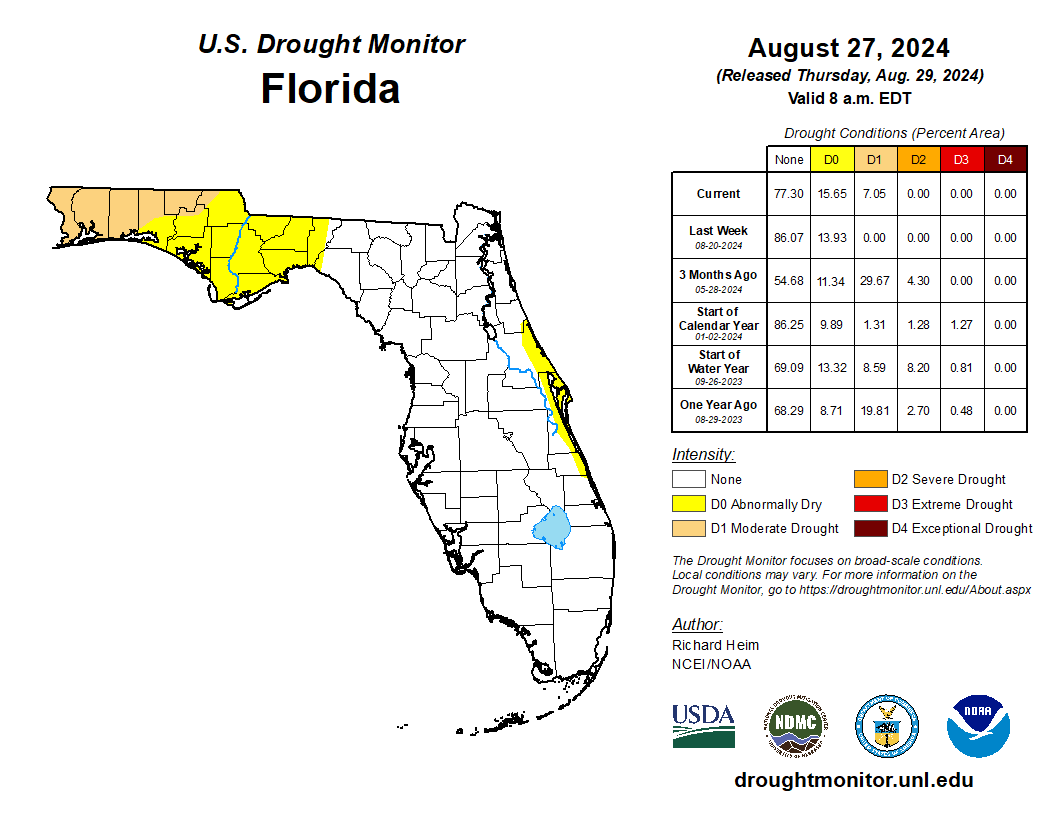
- Drought development occurred toward the end of the month in the western Panhandle; 7% of the state was in moderate drought (D1) and 16% was abnormally dry (D0) at the end of the month.
- ENSO-neutral conditions are currently present in the tropical equatorial Pacific Ocean. A transition to La Niña conditions is expected during September-November (66% chance).
- Hurricane Debby made landfall in Florida’s Big Bend (Taylor County) as a Category 1 hurricane on August 5, which brought torrential rainfall and storm surge flooding, damaging winds, and tornadoes.
Average monthly temperatures in August were above normal. Average monthly temperature departures from normal ranged from +0.3°F in Sarasota to +2.9°F in Tallahassee for the month (see Table 1 and Appendix 1 for select cities). Several stations recorded one of their warmest Augusts on record; it was the 2nd-warmest August on record for Niceville, Tallahassee, Tampa, and Punta Gorda, and 3rd-warmest August on record for Daytona Beach, Fort Myers, and Naples. Pensacola saw several 100°F+ days during the first half of the month, smashing previous daily records by several degrees. Key West smashed their daily record high on the 10th and 13th, with 101°F and 102°F, respectively. For the summer as a whole (JJA), rankings show that several stations recorded their warmest summer on record, including Tallahassee (127 years), Orlando (70 years), Plant City (118 years), Punta Gorda (99 years), and Ft. Lauderdale (104 years). Select daily high maximum temperature records tied or broken during the month are provided in Appendix 2.
Table 1. August average temperatures and departures from normal ( ̊F) for selected cities.
| Station | Mean Temperature | Departure from Normal |
| Pensacola | 83.5 | +0.5 |
| Tallahassee | 85.3 | +2.9 |
| Jacksonville | 83.1 | +1.0 |
| Orlando | 84.3 | +1.7 |
| Tampa | 84.7 | +0.7 |
| Miami | 85.0 | +0.8 |
| Key West | 86.1 | +0.6 |
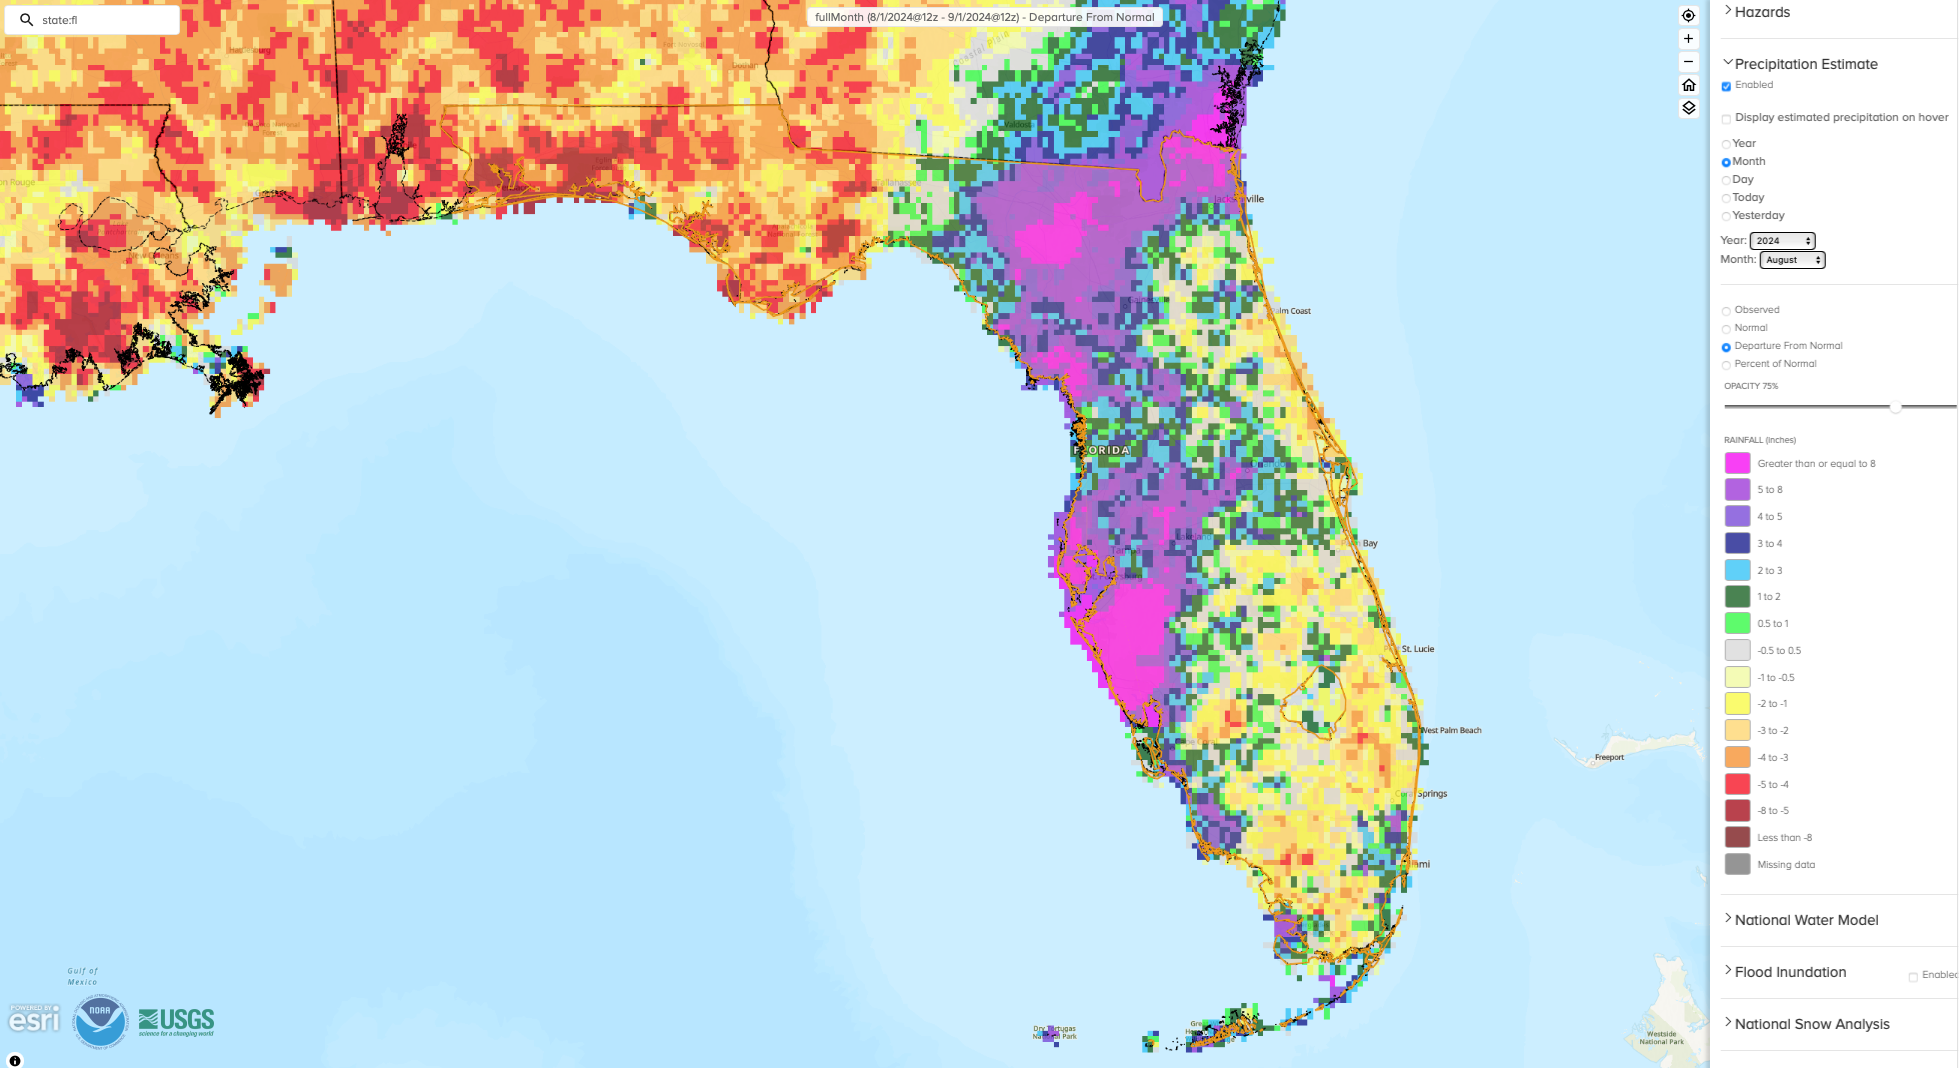
Monthly rainfall totals in August were above normal along the west coast and north-central Florida and below normal in the Panhandle and east coast of Florida. The monthly precipitation departures from normal ranged from -6.54 inches in Pensacola to +14.44 inches in Sarasota (see Table 2 and Appendix 1 for select locations). Hurricane Debby’s rainfall shows clearly in the monthly departures from normal map with much wetter than normal conditions (Figure 1). Southwest Florida had a surplus of 8 inches or more in August, and this region was wetter than normal for the summer as a whole (JJA). Locations that recorded their wettest summer on record include Fort Myers (124 years) and Sarasota (110 years), while Tampa and Naples observed their 2nd-wettest summer on record. These locations recorded a surplus of 14 inches or more in summer rainfall. Hurricane Debby left other parts of the state with below normal rainfall for the month. With less than one inch of rain for the entire month, Pensacola saw their 3rd-driest August on record. Below-normal rainfall combined with high temperatures led to drought development in the western Panhandle (see Figure 2).
Table 2. August precipitation totals and departures from normal (inches) for selected cities.
| Station | Total Rainfall | Departure from Normal |
| Pensacola | 0.96 | -6.54 |
| Tallahassee | 4.11 | -3.49 |
| Jacksonville | 12.44 | +5.56 |
| Orlando | 7.79 | +0.10 |
| Tampa | 17.78 | +8.75 |
| Miami | 12.83 | +3.25 |
| Key West | 9.04 | +3.67 |
Figure 1. A graphical depiction of the monthly rainfall departure from normal (inches) for August (courtesy of NOAA, NWS).
ENSO Neutral / La Niña Watch.
ENSO-neutral conditions continue to linger in the tropical equatorial Pacific Ocean and are expected to persist for the next few months. La Niña conditions are still expected to emerge during September-November 2024 (66% chance) and persist through the Northern Hemisphere winter (74% chance during November-January). The cooling of SSTs has been slow, but below-average ocean temperatures and low-level easterly wind anomalies point to La Niña developing in the coming months.
Hazardous Weather Events in August.
According to the Local Storm Reports issued by the local National Weather Service offices serving Florida, there were 619 individual local reports of hazardous weather events recorded across the state during the month of August (see Table 4 for a breakdown by event type). Hurricane Debby made landfall as a Category 1 storm near Steinhatchee, FL on the morning of August 5th, bringing heavy rain, high winds, and storm surge along Florida’s west coast and Big Bend regions. A wind gust of 70 mph was reported in Mayo in Lafayette County, and 60+ wind gusts were observed in Madison and Suwannee Counties. Debby led to flooded roadways and homes. Major flooding and water rescues were reported in Columbia County, in Live Oak in Suwannee County, and Sarasota County. Multiple injuries were reported as well, mostly from fallen trees, and Debby led to several fatalities in the state. See our Hurricane Debby Post-Storm Summary Report for more information on the storm and its impacts. August 2024 also brought extreme heat to parts of the state. A heat index of 116°F was reported in Bay County, and a heat index of 115°F was observed in Franklin County, both observed on the 8th.
Table 3. Breakdown of storm reports submitted in Florida during the month of August (compiled from Iowa State University/Iowa Environmental Mesonet).
| Report Type | Number of Reports |
| Heavy Rain | 54 |
| Flood | 21 |
| Flash Flood | 25 |
| Coastal Flood | 3 |
| Hail | 1 |
| Marine Thunderstorm Wind | 55 |
| Non-Thunderstorm Wind Gust | 47 |
| Non-Thunderstorm Wind Damage | 4 |
| Tornado/Waterspout/Funnel Cloud | 8/26/5 |
| Thunderstorm Wind Damage | 25 |
| Thunderstorm Wind Gust | 175 |
| Rip Currents | 1 |
| Lightning | 7 |
| Extreme Heat | 4 |
| Tropical Cylone | 141 |
| Storm Surge | 17 |
Daily Record Events in August.
Table 4. Summary of daily records broken or set in Florida in August (source: NCEI Daily Weather Records).
| Category | Number of Records |
| Highest daily max. temp. | 41 |
| Highest daily min. temp. | 105 |
| Lowest daily max. temp. | 14 |
| Lowest daily min. temp. | 3 |
| Highest daily precipitation | 43 |
| Total | 206 |
Drought-Related Impacts.
By mid-August, the state was drought free and 1.6% of the state was abnormally dry (D0), according to the U.S. Drought Monitor. By the end of the month, drought developed in the western Panhandle. About 7% of the state was in moderate drought (D1) and 15.7% was abnormally dry (D0) (Figure 2 below).
As of August 31, the Lake Okeechobee water level was 14.27 ft. above sea level (Feet-NGVD29), which is average for this time of year. At the first of the month, the water level was 13.56 ft. above sea level.
Figure 2. A graphical depiction of the latest drought conditions in Florida according to the U.S. Drought Monitor (courtesy of the National Drought Mitigation Center, University of Nebraska-Lincoln).
Agriculture-Related Impacts.
Hurricane Debby was a major rainmaker in Florida and up through the Carolinas. The storm drowned or otherwise damaged many crops. In mid-August, topsoil moisture conditions were adequate in 62% of the state, short in 17%, and very short in 3% of the state, while 18% of the state had surplus topsoil moisture conditions. By the end of August, topsoil moisture conditions were adequate in 66% of the state, short in 17%, and very short in 2% of the state; 15% of the state was in surplus conditions. For more information, consult the Crop Progress and Conditions report, which is published by the USDA’s National Agricultural Statistics Service.
Appendix 1
Additional August departures from normal data for select Florida locations (Source: NWS).
| Station | Average Temperature (˚F) | Departure from Normal (˚F) | Total Rainfall (in.) | Departure from Normal (in.) |
| Gainesville | 82.3 | +1.0 | 10.82 | +4.42 |
| Sarasota | 83.7 | +0.3 | 23.55 | +14.44 |
| Naples | 83.8 | +2.0 | 7.43 | -3.40 |
| Fort Myers | 84.8 | +1.4 | 12.20 | +1.77 |
| West Palm Beach | 84.8 | +1.6 | 8.72 | +0.04 |
Appendix 2
Select daily record high maximum temperatures (°F) tied or broken during August (compiled from NOAA).
| Location | Date | Record | Broken/Tied | Last |
| Key West | 1 | 98 | Broken | 96 in 2022 |
| Canal Point | 2 | 98 | Broken | 97 in 1992 |
| Fort Myers | 2 | 97 | Broken | 96 in 2022 |
| Clermont | 4 | 98 | Tied | 98 in 1972 |
| Pensacola | 4 | 99 | Broken | 98 in 2023 |
| Pensacola | 5 | 100 | Broken | 97 in 1972 |
| Pensacola | 6 | 101 | Broken | 97 in 1989 |
| Apalachicola | 7 | 98 | Tied | 98 in 1999 |
| Hialeah | 8 | 96 | Broken | 95 in 1999 |
| Homestead | 8 | 97 | Broken | 96 in 2023 |
| Pensacola | 8 | 100 | Broken | 96 in 2023 |
| Pensacola | 10 | 97 | Broken | 95 in 2023 |
| Key West | 10 | 101 | Broken | 96 in 2023 |
| Fort Lauderdale | 11 | 95 | Tied | 95 in 2023 |
| Key West | 11 | 99 | Broken | 95 in 2023 |
| Naples | 12 | 98 | Broken | 96 in 1990 |
| Apalachicola | 13 | 98 | Broken | 96 in 1999 |
| Key West | 13 | 102 | Broken | 95 in 2011 |
| Apalachicola | 14 | 99 | Broken | 96 in 2011 |
| Pensacola | 14 | 100 | Broken | 96 in 1993 |
| Crestview | 14 | 101 | Broken | 99 in 2023 |
| Clermont | 15 | 99 | Broken | 98 in 2023 |
| Miami | 15 | 98 | Broken | 97 in 1995 |
| Homestead | 16 | 99 | Broken | 96 in 2023 |
| Pensacola | 18 | 101 | Broken | 97 in 1993 |
| Niceville | 19 | 99 | Broken | 97 in 1952 |
| Plant City | 19 | 100 | Broken | 98 in 2023 |
| Daytona Beach | 21 | 97 | Broken | 96 in 2014 |
| Fort Lauderdale | 21 | 97 | Broken | 93 in 2015 |
| Key West | 22 | 95 | Broken | 93 in 1995 |
| Tampa | 27 | 97 | Broken | 96 in 2023 |
| Tallahassee | 31 | 97 | Tied | 97 in 2014 |