
Prepared by Florida Climate Center
The Florida State University
Tallahassee, FL

Summary:
- Average monthly temperatures in Florida were much above normal in July.
- Monthly precipitation totals were generally above normal in northern Florida and below normal across much of southern Florida.
- Drought improvement occurred throughout the month of July, with just 0.24% of the state in moderate drought (D1) by month’s end.
- ENSO-neutral conditions are currently present in the tropical equatorial Pacific Ocean. A transition to La Niña conditions has been slightly delayed but is expected during August-October 2024 (70% chance).
Average monthly temperatures in July were much above normal. Average monthly temperature departures from normal ranged from -1.0 ̊F in Pensacola to +2.9 ̊F in Orlando for the month (see Table 1 and Appendix 1 for select cities). July 2024 was the warmest July on record for several stations, including Orlando (70 years), Punta Gorda (104 years), Tampa Bay (38 years), and Ft. Lauderdale (106 years). July 2024 was 2nd-warmest in several other locations, including Tallahassee, Jacksonville, Daytona Beach, Leesburg, Bradenton, and Key West. Overnight, or minimum, temperatures were especially warm in July. The following also recorded their warmest July on record based on monthly average minimum, or nighttime, temperatures: Tallahassee, Jacksonville, Tampa Bay, Orlando, Punta Gorda, and Ft. Lauderdale. Select daily high maximum temperature records tied or broken during the month are provided in Appendix 2.
Table 1. July average temperatures and departures from normal ( ̊F) for selected cities.
| Station | Mean Temperature | Departure from Normal |
| Pensacola | 82.5 | -1.0 |
| Tallahassee | 85.1 | +2.6 |
| Jacksonville | 84.5 | +2.0 |
| Orlando | 85.5 | +2.9 |
| Tampa | 85.0 | +1.2 |
| Miami | 85.6 | +1.5 |
| Key West | 87.0 | +1.6 |
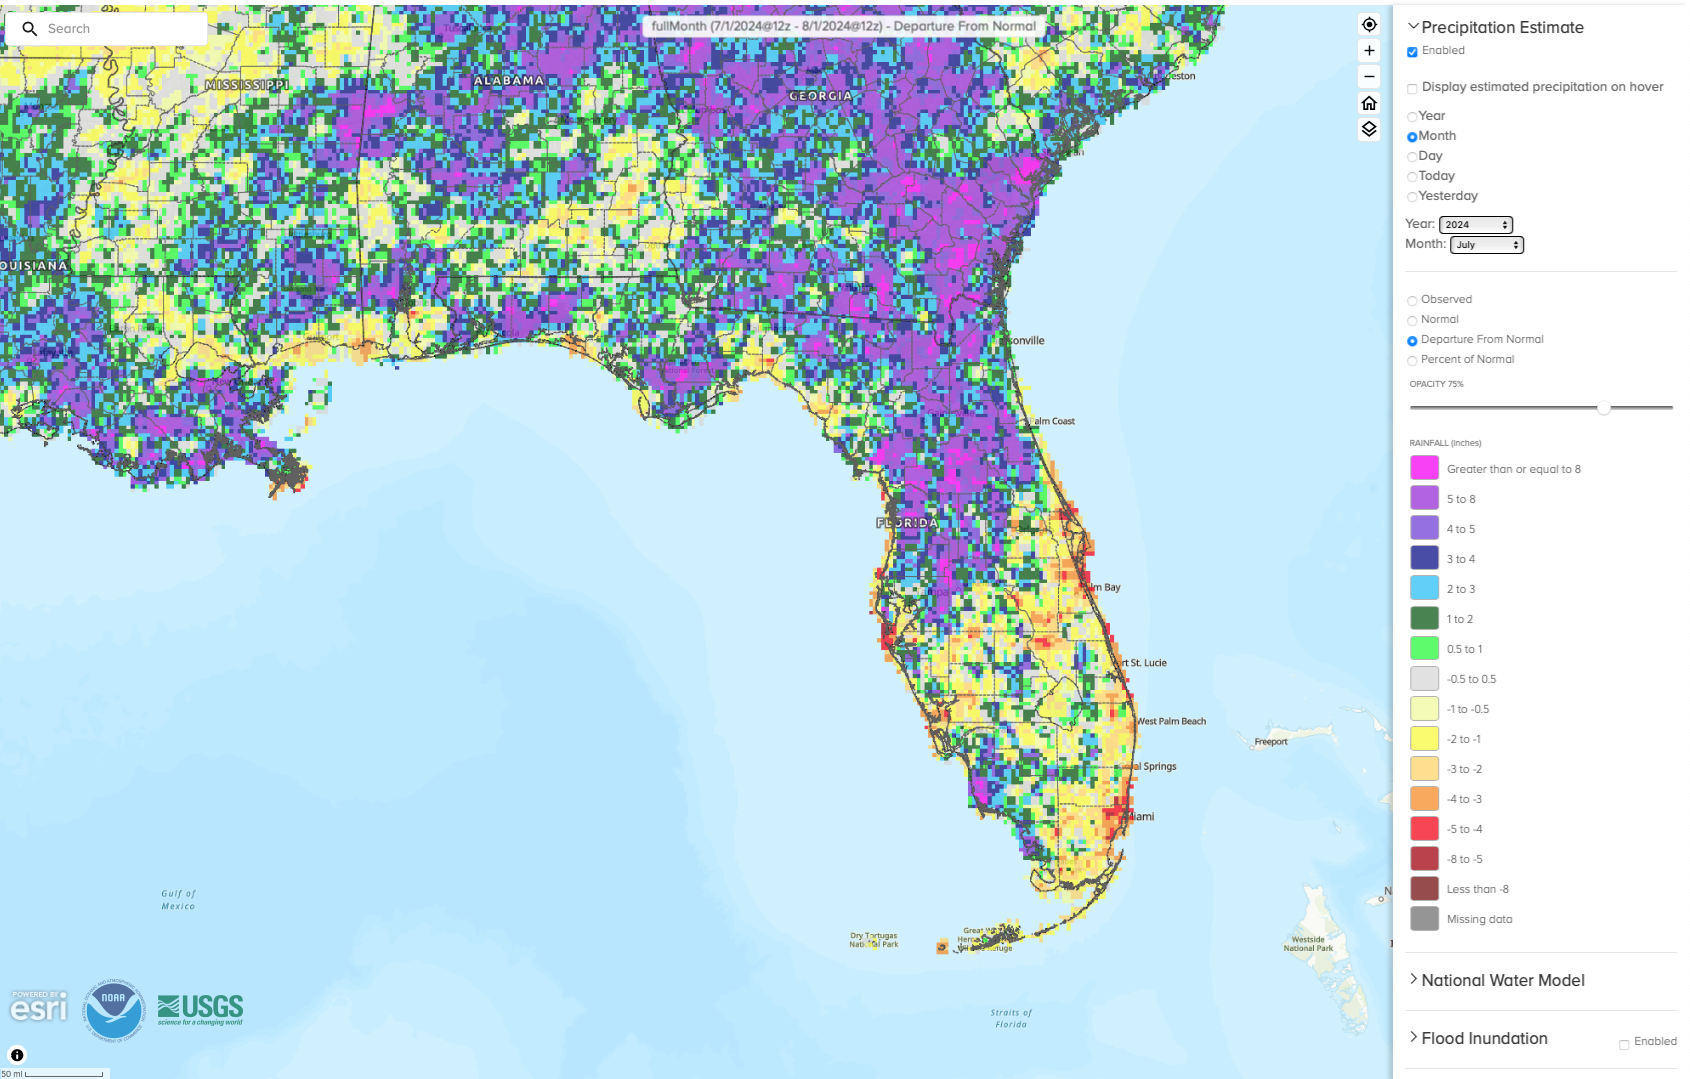
Monthly rainfall totals in July were generally above normal in northern Florida and the Panhandle and below normal across southern Florida, except along the southwest coast. The monthly precipitation departures from normal ranged from -3.73 inches in West Palm Beach to +6.70 inches in Naples (see Table 2 and Appendix 1 for select locations). Rainfall was quite variable in Florida in July, with generally dry conditions along the Atlantic Coast and wetter conditions in North Florida and along the southwest coast, particularly around Naples. Rainfall across the Panhandle was a bit of a ‘hit and miss’ pattern with summertime thunderstorm development. Drought conditions in central and northern regions have continued to improve since about mid-June (see Figure 2).
Table 2. July precipitation totals and departures from normal (inches) for selected cities.
| Station | Total Rainfall | Departure from Normal |
| Pensacola | 8.79 | +0.90 |
| Tallahassee | 8.57 | +1.43 |
| Jacksonville | 10.93 | +4.16 |
| Orlando | 4.79 | -2.67 |
| Tampa | 8.83 | +1.08 |
| Miami | 5.44 | -1.92 |
| Key West | 3.99 | +0.36 |
Figure 1. A graphical depiction of the monthly rainfall departure from normal (inches) for July (courtesy of NOAA, NWS).
ENSO Neutral / La Niña Watch.
ENSO-neutral conditions currently exist in the tropical equatorial Pacific Ocean and are expected to persist for the next few months. La Niña conditions are favored to emerge during August-October 2024 (70% chance), which is slightly delayed from last month’s forecast. La Niña conditions are expected to persist into the Northern Hemisphere winter (79% chance during November-January).
Hazardous Weather Events in July.
According to the Local Storm Reports issued by the local National Weather Service offices serving Florida, there were 204 individual local reports of hazardous weather events recorded across the state during the month of July (see Table 4 for a breakdown by event type). Reports of damage associated with heavy rainfall, strong wind gusts, and small hail impacted the state this month. A lightning strike outside of a restaurant in St. Petersburg on the 25th caused four injuries. Rip currents led to one fatality in Daytona Beach on July 3rd.
Table 3. Breakdown of storm reports submitted in Florida during the month of July (compiled from Iowa State University/Iowa Environmental Mesonet).
| Report Type | Number of Reports |
| Heavy Rain | 29 |
| Flood | 9 |
| Flash Flood | 9 |
| Coastal Flood | 0 |
| Hail | 8 |
| Marine Thunderstorm Wind | 11 |
| Non-Thunderstorm Wind Gust | 2 |
| Non-Thunderstorm Wind Damage | 0 |
| Tornado/Waterspout/Funnel Cloud | 3/13/10 |
| Thunderstorm Wind Damage | 19 |
| Thunderstorm Wind Gust | 85 |
| Rip Currents | 1 |
| Lightning | 5 |
Daily Record Events in July.
Table 4. Summary of daily records broken or set in Florida in July (source: NCEI Daily Weather Records).
| Category | Number of Records |
| Highest daily max. temp. | 17 |
| Highest daily min. temp. | 95 |
| Lowest daily max. temp. | 2 |
| Lowest daily min. temp. | 2 |
| Highest daily precipitation | 15 |
| Total | 131 |
Drought-Related Impacts.
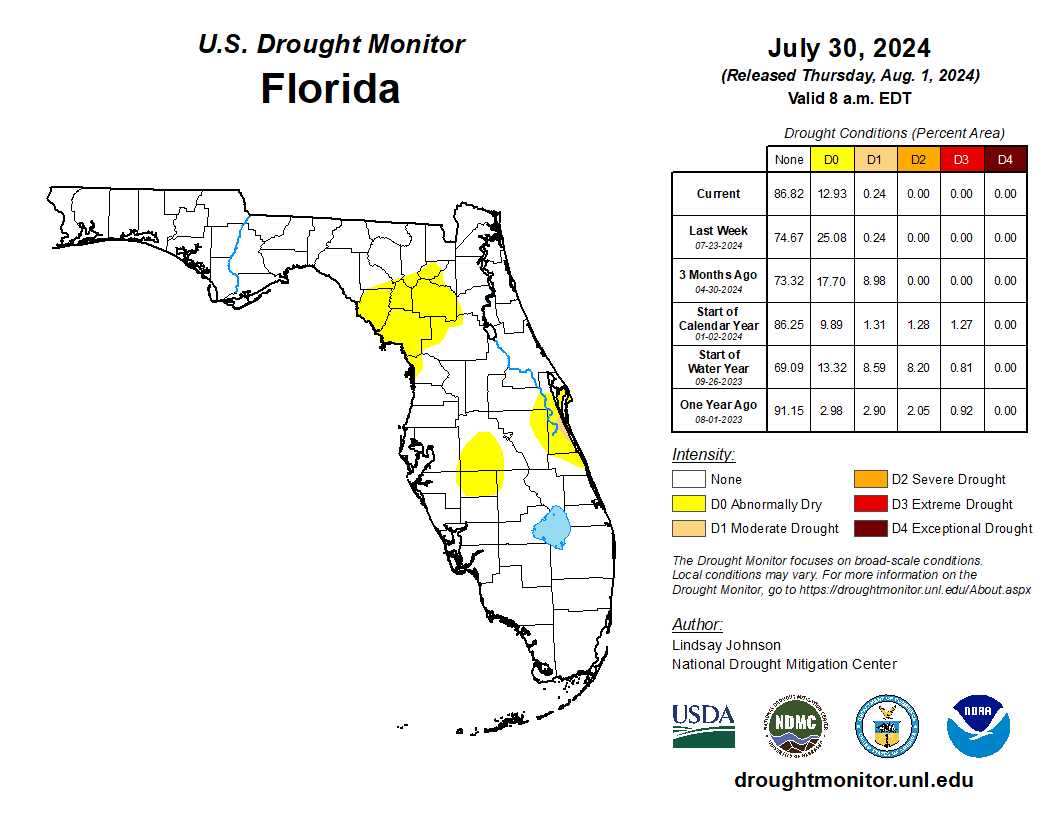
Drought conditions improved throughout the month of July. By mid-July, 2.6% of the state was experiencing moderate drought (D1) and 42.1% of the state was abnormally dry (D0), according to the U.S. Drought Monitor. By the end of the month, only 0.24% of the state was in moderate drought (D1) and 12.9% was abnormally dry (D0) (Figure 2 below).
As of July 31, the Lake Okeechobee water level was 13.56 ft. above sea level (Feet-NGVD29), which is slightly below average for this time of year. At the first of the month, the water level was below average at 13.49 ft. above sea level.
Figure 2. A graphical depiction of the latest drought conditions in Florida according to the U.S. Drought Monitor (courtesy of the National Drought Mitigation Center, University of Nebraska-Lincoln).
Agriculture-Related Impacts.
In mid-July, topsoil moisture conditions were adequate in 79% of the state, short in 9%, and very short in 1% of the state, while 11% of the state had surplus topsoil moisture conditions. By the end of July, topsoil moisture conditions were adequate in 87% of the state, short in 5%, and very short in 0% of the state; 8% of the state was in surplus conditions. For more information, consult the Crop Progress and Conditions report, which is published by the USDA’s National Agricultural Statistics Service.
Appendix 1
Additional July departures from normal data for select Florida locations (Source: NWS).
| Station | Average Temperature (˚F) | Departure from Normal (˚F) | Total Rainfall (in.) | Departure from Normal (in.) |
| Gainesville | 82.4 | +1.0 | 8.87 | +2.19 |
| Sarasota | 84.3 | +1.2 | 7.55 | +0.16 |
| Naples | 84.7 | +1.6 | 14.47 | +6.70 |
| Fort Myers | 85.2 | +2.0 | 9.39 | +0.01 |
| West Palm Beach | 85.2 | +2.1 | 1.90 | -3.73 |
Appendix 2
Select daily record high maximum temperatures (°F) tied or broken during July (compiled from NOAA).
| Location | Date | Record | Broken/Tied | Last |
| Tampa Bay | 3 | 97 | Broken | 95 in 1998 |
| Homestead | 6 | 95 | Broken | 94 in 2023 |
| Bradenton | 7 | 98 | Tied | 98 in 2016 |
| Orlando | 7 | 97 | Tied | 97 in 2022 |
| Clermont | 8 | 100 | Tied | 100 in 2016 |
| Plant City | 8 | 101 | Broken | 98 in 2022 |
| Vero Beach | 8 | 98 | Broken | 95 in 2009 |
| Clermont | 9 | 100 | Tied | 100 in 2016 |
| Key West | 14 | 96 | Broken | 95 in 2022 |
| Plant City | 15 | 99 | Tied | 99 in 2023 |
| Play City | 18 | 99 | Broken | 98 in 1983 |
| Clermont | 19 | 99 | Broken | 98 in 1985 |
| Orlando | 20 | 97 | Broken | 96 in 2023 |
| Clermont | 23 | 99 | Broken | 98 in 2022 |
| Key West | 26 | 95 | Broken | 93 in 2019 |
| Vero Beach | 27 | 95 | Broken | 94 in 1992 |