
Prepared by Florida Climate Center
The Florida State University
Tallahassee, FL

Summary:
- Average monthly temperatures continued to be above normal in June.
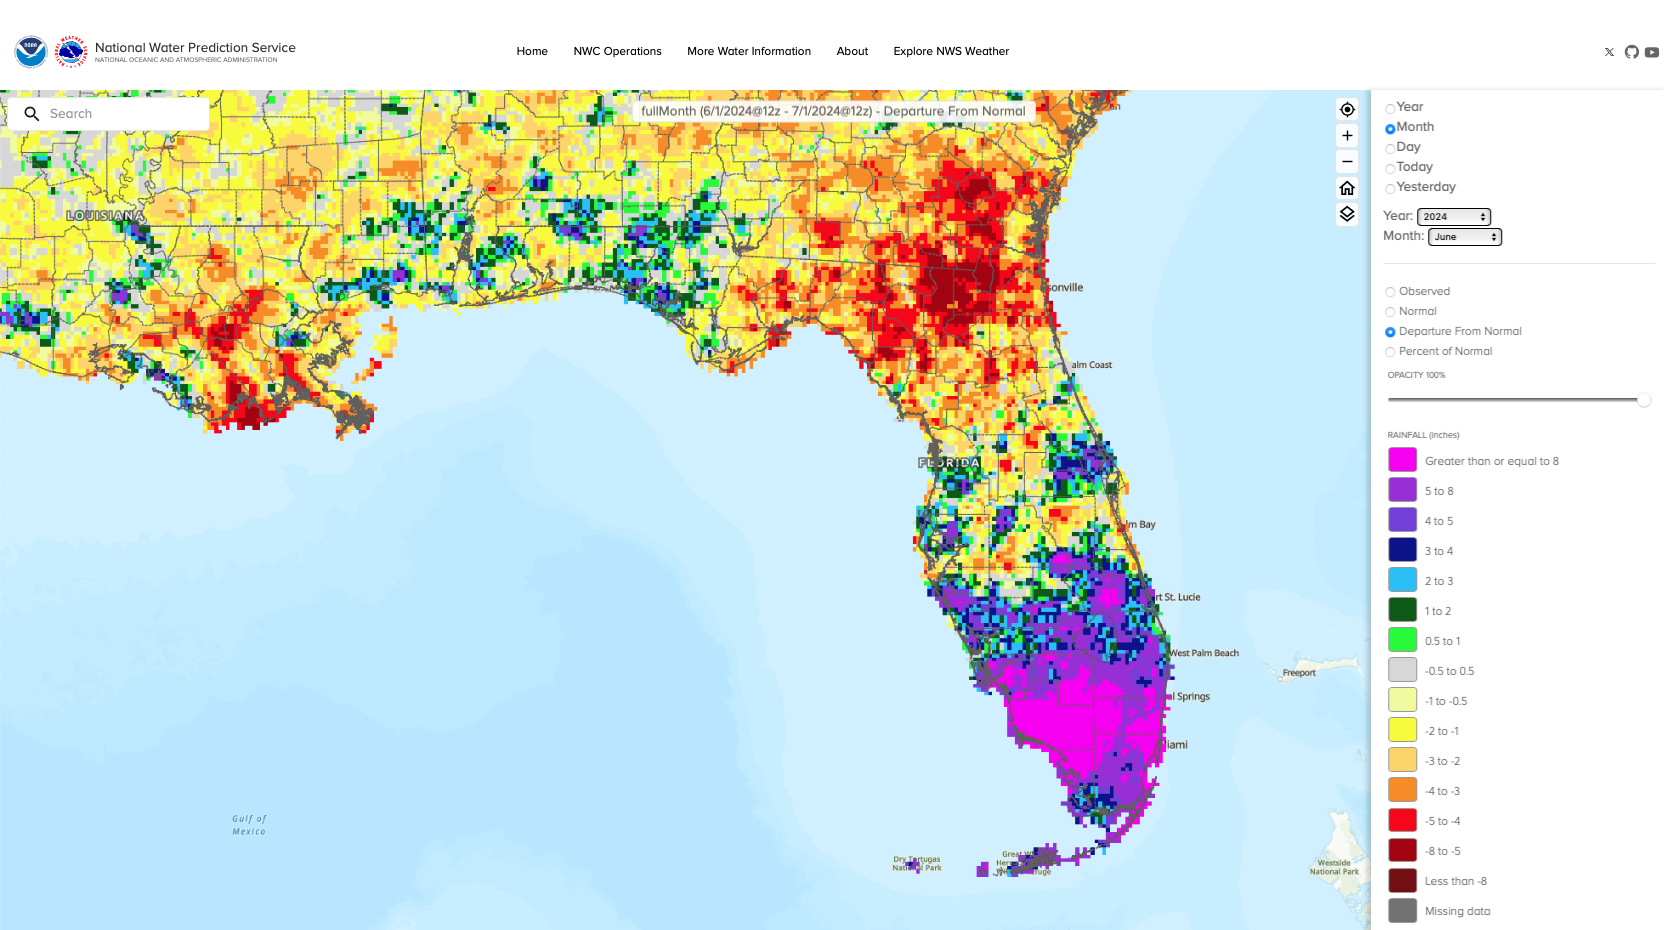
- Monthly precipitation totals were below normal in North Florida and the Panhandle and above normal in South Florida.
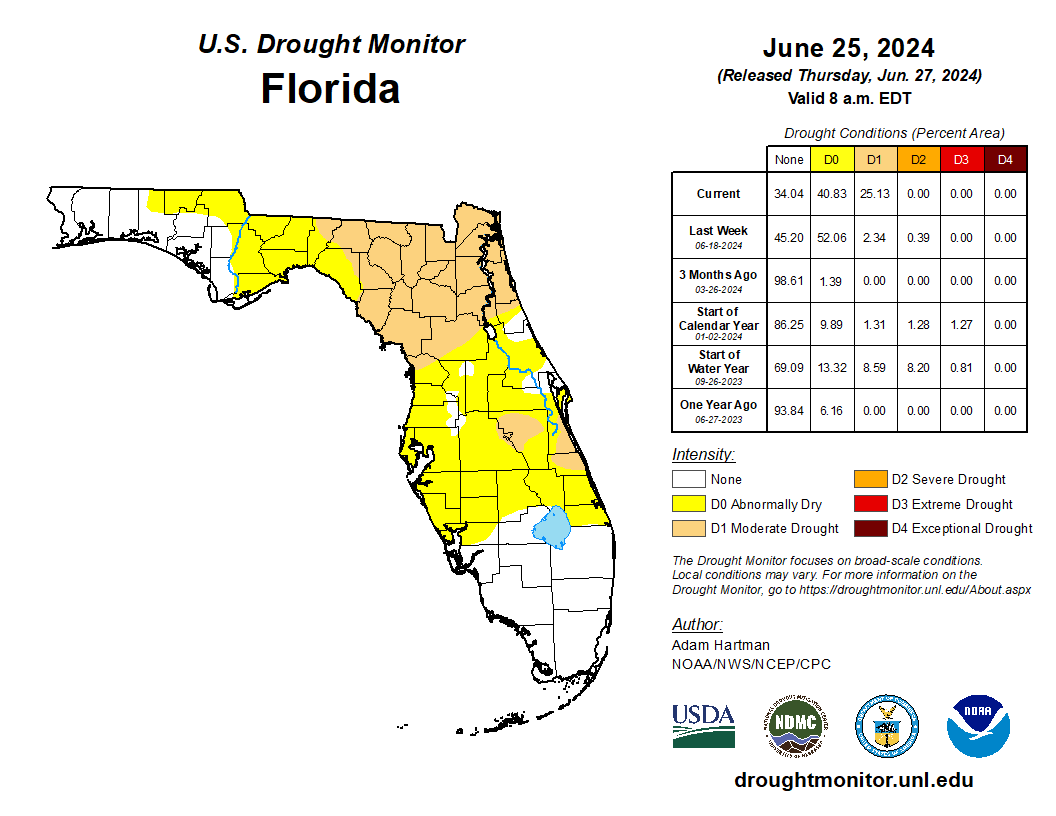
- Drought was removed in South Florida by mid-June following heavy rainfall; drought developed in North Florida by the end of the month. As of June 25, 25% of the state was in moderate drought (D1) and 41% was abnormally dry (D0), according to the U.S. Drought Monitor.
- ENSO-neutral conditions are currently present in the equatorial Pacific Ocean; a transition to La Niña conditions is expected during July-September (65% chance).
- Hurricane Beryl became the strongest hurricane on record in the Atlantic Basin during June, and it is the earliest Category 5 hurricane on record to form in the main development region of the tropical Atlantic Ocean.
Average monthly temperatures in June continued to be above normal. Average monthly temperature departures from normal ranged from -0.2 ̊F in Pensacola to +3.4 ̊F in Tallahassee for the month (see Table 1 and Appendix 1 for select cities). It was the warmest June on record in Tampa Bay (38 years), Plant City (121 years), and Punta Gorda (102 years). Several other locations recorded one of their top five warmest Junes on record, including Tallahassee, Apalachicola, Daytona Beach, Orlando, Leesburg, Tampa, Naples, Sarasota, and Melbourne. Much above normal temperatures were experienced during the first week of June, with maximum temperatures reaching 100-101 ̊F in central Florida, which was 9-12 ̊ F above normal. North Florida experienced triple-digit temperatures later in the month from Crestview to Jacksonville. Select daily high maximum temperature records tied or broken during the month are provided in Appendix 2.
Table 1. June average temperatures and departures from normal ( ̊F) for selected cities.
| Station | Mean Temperature | Departure from Normal |
| Pensacola | 81.5 | -0.2 |
| Tallahassee | 84.2 | +3.4 |
| Jacksonville | 82.6 | +2.3 |
| Orlando | 83.3 | +2.1 |
| Tampa | 84.1 | +1.2 |
| Miami | 83.1 | +0.3 |
| Key West | 84.2 | +0.1 |
Monthly rainfall totals in June were below normal in North Florida and the Panhandle and above normal across South Florida. The monthly precipitation departures from normal ranged from -3.85 inches in Tallahassee to +12.62 inches in Fort Myers (see Table 2 and Appendix 1 for select locations). The month began with moderate to severe drought affecting central and southern Florida. However, a system known as Invest 90L brought warm tropical moisture into the state and produced bands of heavy rainfall during June 11-14 across central and southern Florida, leading to drought improvement across the region. Locations affected by the system experienced well-above normal rainfall for the month. June 2024 became the wettest June on record in Fort Myers (120 years), 2nd-wettest in Fort Lauderdale (27 years) and Naples (23 years), 3rd-wettest in Sarasota (111 years), and 8th-wettest in Miami (88 years).
Table 2. June precipitation totals and departures from normal (inches) for selected cities.
| Station | Total Rainfall | Departure from Normal |
| Pensacola | 8.45 | +1.13 |
| Tallahassee | 3.91 | -3.85 |
| Jacksonville | 4.29 | -3.31 |
| Orlando | 6.37 | -1.68 |
| Tampa | 11.91 | +4.54 |
| Miami | 17.34 | +6.83 |
| Key West | 8.47 | +4.24 |
Figure 1. A graphical depiction of the monthly rainfall departure from normal (inches) for June (courtesy of NOAA, NWS).
La Niña Watch.
El Niño conditions, the warm phase of the El Niño Southern Oscillation climate pattern in the tropical equatorial Pacific Ocean, have ended. ENSO-neutral conditions returned over the past month. The coupled ocean-atmosphere system currently reflects ENSO-neutral conditions. Near to below average sea surface temperatures expanded across the eastern equatorial Pacific Ocean, and upper level winds were near average. La Niña conditions are expected to emerge during July-September 2024 (65% chance) and are expected to persist into the Northern Hemisphere winter (85% during November-January).
Hazardous Weather Events in June.
According to the Local Storm Reports issued by the local National Weather Service offices serving Florida, there were 269 individual local reports of hazardous weather events recorded across the state during the month of June (see Table 4 for a breakdown by event type). Heavy rainfall led to multiple occasions of flooded roadways during the month, stranding vehicles, closing roadways, and leading to water rescues. Lightning strikes led to two fatalities, and rip currents led to 8 additional fatalities this month.
Table 3. Breakdown of storm reports submitted in Florida during the month of June (compiled from Iowa State University/Iowa Environmental Mesonet).
| Report Type | Number of Reports |
| Heavy Rain | 44 |
| Flood | 15 |
| Flash Flood | 30 |
| Coastal Flood | 0 |
| Hail | 8 |
| Marine Thunderstorm Wind | 17 |
| Non-Thunderstorm Wind Gust | 29 |
| Non-Thunderstorm Wind Damage | 0 |
| Tornado/Waterspout/Funnel Cloud | 5/12/6 |
| Thunderstorm Wind Damage | 26 |
| Thunderstorm Wind Gust | 68 |
| Rip Currents | 5 |
| Lightning | 3 |
| Wildfire | 1 |
Daily Record Events in June.
Table 4. Summary of daily records broken or set in Florida in June (source: NCEI Daily Weather Records).
| Category | Number of Records |
| Highest daily max. temp. | 66 |
| Highest daily min. temp. | 96 |
| Lowest daily max. temp. | 5 |
| Lowest daily min. temp. | 0 |
| Highest daily precipitation | 37 |
| Total | 204 |
Weather/Climate Highlights of the Month: Heavy Rainfall Event in South Florida June 11 – 14 from Invest 90L.
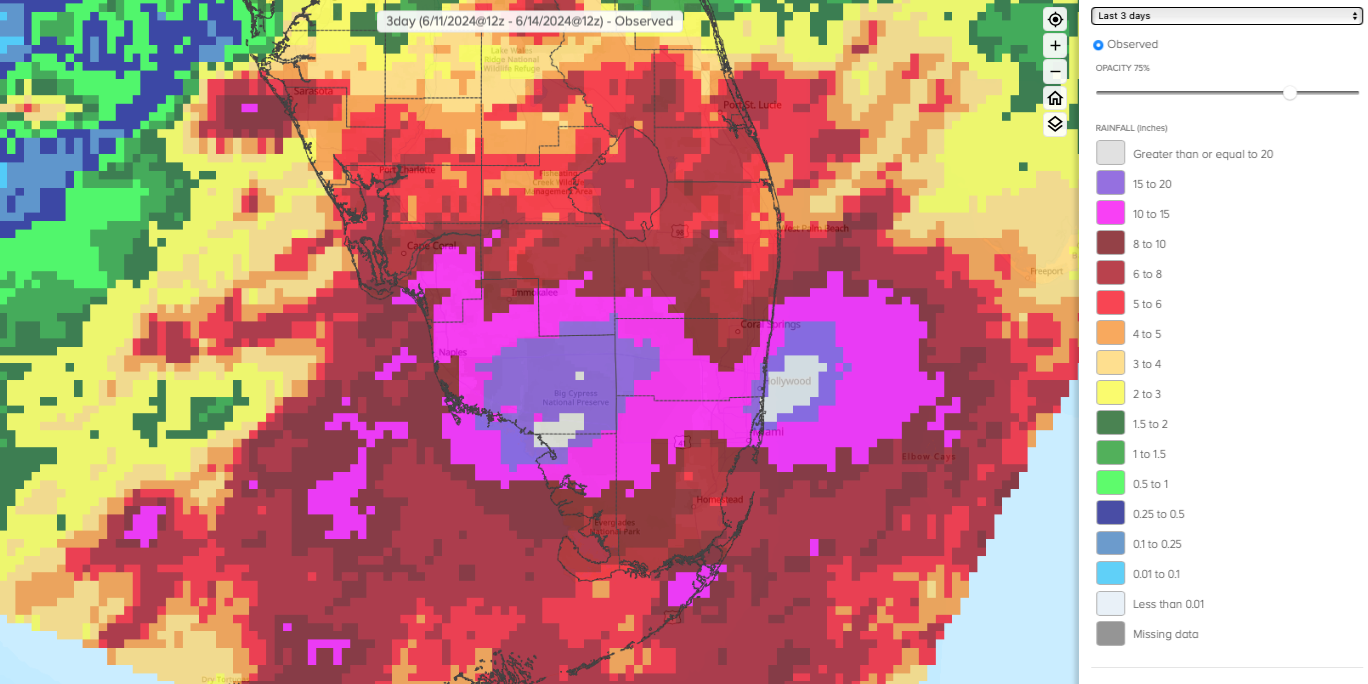
On June 11-13, Invest 90L tracked across the Peninsula, bringing warm tropical moisture and multiple rounds of heavy rainfall to the state. Some locations received well over a foot of rain from the system, causing extensive flooding. Figure 2 shows the 3-day observed rainfall totals across South Florida from June 11- 14, from the National Water Prediction Service. The heaviest rainfall fell as two bullseyes over southwest and coastal southeastern areas. The 72-hour storm totals, ending Friday June 14, exceeded 20 inches in several locations, including Hallandale in Broward County with 20.65 inches, the Big Cypress NR Everglades station in Collier County with 27.95 inches, and the Miami Shores station in Miami-Dade County with 21.66 inches, according to reports from the Weather Service Office in Miami.
Several hourly and daily rainfall records were broken. The Sarasota-Bradenton Airport reported an all-time one-hour rainfall record of 3.93 inches on June 11. The airport also observed a new daily rainfall record of 6.47 inches that day, which surpassed the previous record of 2.50 inches set in 1940. On June 11 and 12, Fort Lauderdale reported back-to-back new daily records of 3.30 inches and 9.54 inches, respectively, surpassing the previous daily records of 3.10 inches in 1947 and 5.47 inches in 1978, respectively. The Miami International Airport reported its second-highest daily precipitation on record with 6.25 inches on the 12th; the record for this day is 8.25 inches set in 1901.
Figure 2. The 3-day observed rainfall totals in South Florida from June 11 – 14, 2024. Source: National Water Prediction Service.
Drought-Related Impacts.
While June started out very dry across South Florida, heavy rainfall in the region and the beginning of the rainy season led to drought removal by mid-month. Conversely, areas further to the north experienced drying conditions during the month. By mid-June, 0.39% of the state was experiencing severe drought (D2) conditions, 2.34% of the state was in moderate drought (D1), and 52% of the state was abnormally dry (D0), according to the U.S. Drought Monitor. By the end of the month, 25% of the state was in moderate drought (D1) and 41% was abnormally dry (D0) (Figure 3 below).
As of June 30, the Lake Okeechobee water level was 13.45 ft. above sea level (Feet-NGVD29), which is about average for this time of year. At the first of the month, the water level was below average at 12.91 ft. above sea level.
Figure 3. A graphical depiction of the latest drought conditions in Florida according to the U.S. Drought Monitor (courtesy of the National Drought Mitigation Center, University of Nebraska-Lincoln).
Agriculture-Related Impacts.
In mid-June, topsoil moisture conditions were adequate in 43% of the state, short in 19%, and very short in 11% of the state, while 27% of the state had surplus topsoil moisture conditions. By the end of June, topsoil moisture conditions were adequate in 74% of the state, short in 13%, and very short in 4% of the state; 9% of the state was in surplus conditions. For more information, consult the Crop Progress and Conditions report, which is published by the USDA’s National Agricultural Statistics Service.
Appendix 1
Additional June departures from normal data for select Florida locations (Source: NWS).
| Station | Average Temperature (˚F) | Departure from Normal (˚F) | Total Rainfall (in.) | Departure from Normal (in.) |
| Gainesville | 81.7 | +1.8 | 6.29 | -0.64 |
| Sarasota | 83.1 | +1.3 | 16.88 | +9.83 |
| Naples | 83.4 | +1.3 | 16.98 | +9.48 |
| Fort Myers | 83.6 | +1.3 | 22.28 | +12.62 |
| West Palm Beach | 82.9 | +1.2 | 9.84 | +1.36 |
Appendix 2
Select daily record high maximum temperatures (°F) tied or broken during June (compiled from NOAA).
| Location | Date | Record | Broken/Tied | Last |
| Fort Lauderdale Beach | 1 | 98 | Broken | 90 in 2022 |
| Tampa Bay | 2 | 96 | Broken | 94 in 1986 |
| Tampa Bay | 4 | 98 | Broken | 95 in 2016 |
| Fort Myers | 5 | 98 | Tied | 98 in 1985 |
| Plant City | 6 | 103 | Broken | 100 in 1985 |
| Raccoon Point | 6 | 100 | Broken | 99 in 2006 |
| Key West | 6 | 94 | Broken | 92 in 2022 |
| Orlando | 6 | 101 | Broken | 96 in 2000 |
| Lakeland | 6 | 100 | Broken | 99 in 1985 |
| Jacksonville | 6 | 101 | Broken | 98 in 1998 |
| Clermont | 7 | 102 | Broken | 99 in 2021 |
| Deland | 7 | 100 | Tied | 100 in 1933 |
| Kissimmee | 7 | 101 | Broken | 99 in 1999 |
| Plant City | 7 | 103 | Broken | 99 in 1985 |
| Orlando | 7 | 96 | Broken | 94 in 2022 |
| Bradenton | 8 | 97 | Broken | 96 in 1993 |
| Clermont | 8 | 100 | Broken | 97 in 2022 |
| Lisbon | 8 | 98 | Broken | 96 in 1985 |
| Clermont | 9 | 100 | Broken | 98 in 2021 |
| Fort Lauderdale Beach | 9 | 96 | Broken | 91 in 2019 |
| Kissimmee | 9 | 101 | Broken | 95 in 2014 |
| Jacksonville | 9 | 102 | Broken | 100 in 2007 |
| Fort Pierce | 11 | 96 | Broken | 94 in 1990 |
| Tampa Bay | 14 | 96 | Broken | 95 in 2022 |
| Pensacola | 15 | 98 | Broken | 97 in 2011 |
| Naples | 20 | 98 | Broken | 96 in 1964 |
| Jacksonville | 23 | 100 | Tied | 100 in 2022 |
| Chipley | 24 | 100 | Tied | 100 in 2022 |
| Marianna | 25 | 101 | Broken | 100 in 2010 |
| Tallahassee | 25 | 101 | Tied | 101 in 1988 |
| Key West | 30 | 96 | Broken | 94 in 2022 |