
Prepared by Florida Climate Center
The Florida State University
Tallahassee, FL

Summary:
- Monthly temperatures in November were near to above normal across northern Florida and the Panhandle and near to below normal in the Peninsula and the Keys.
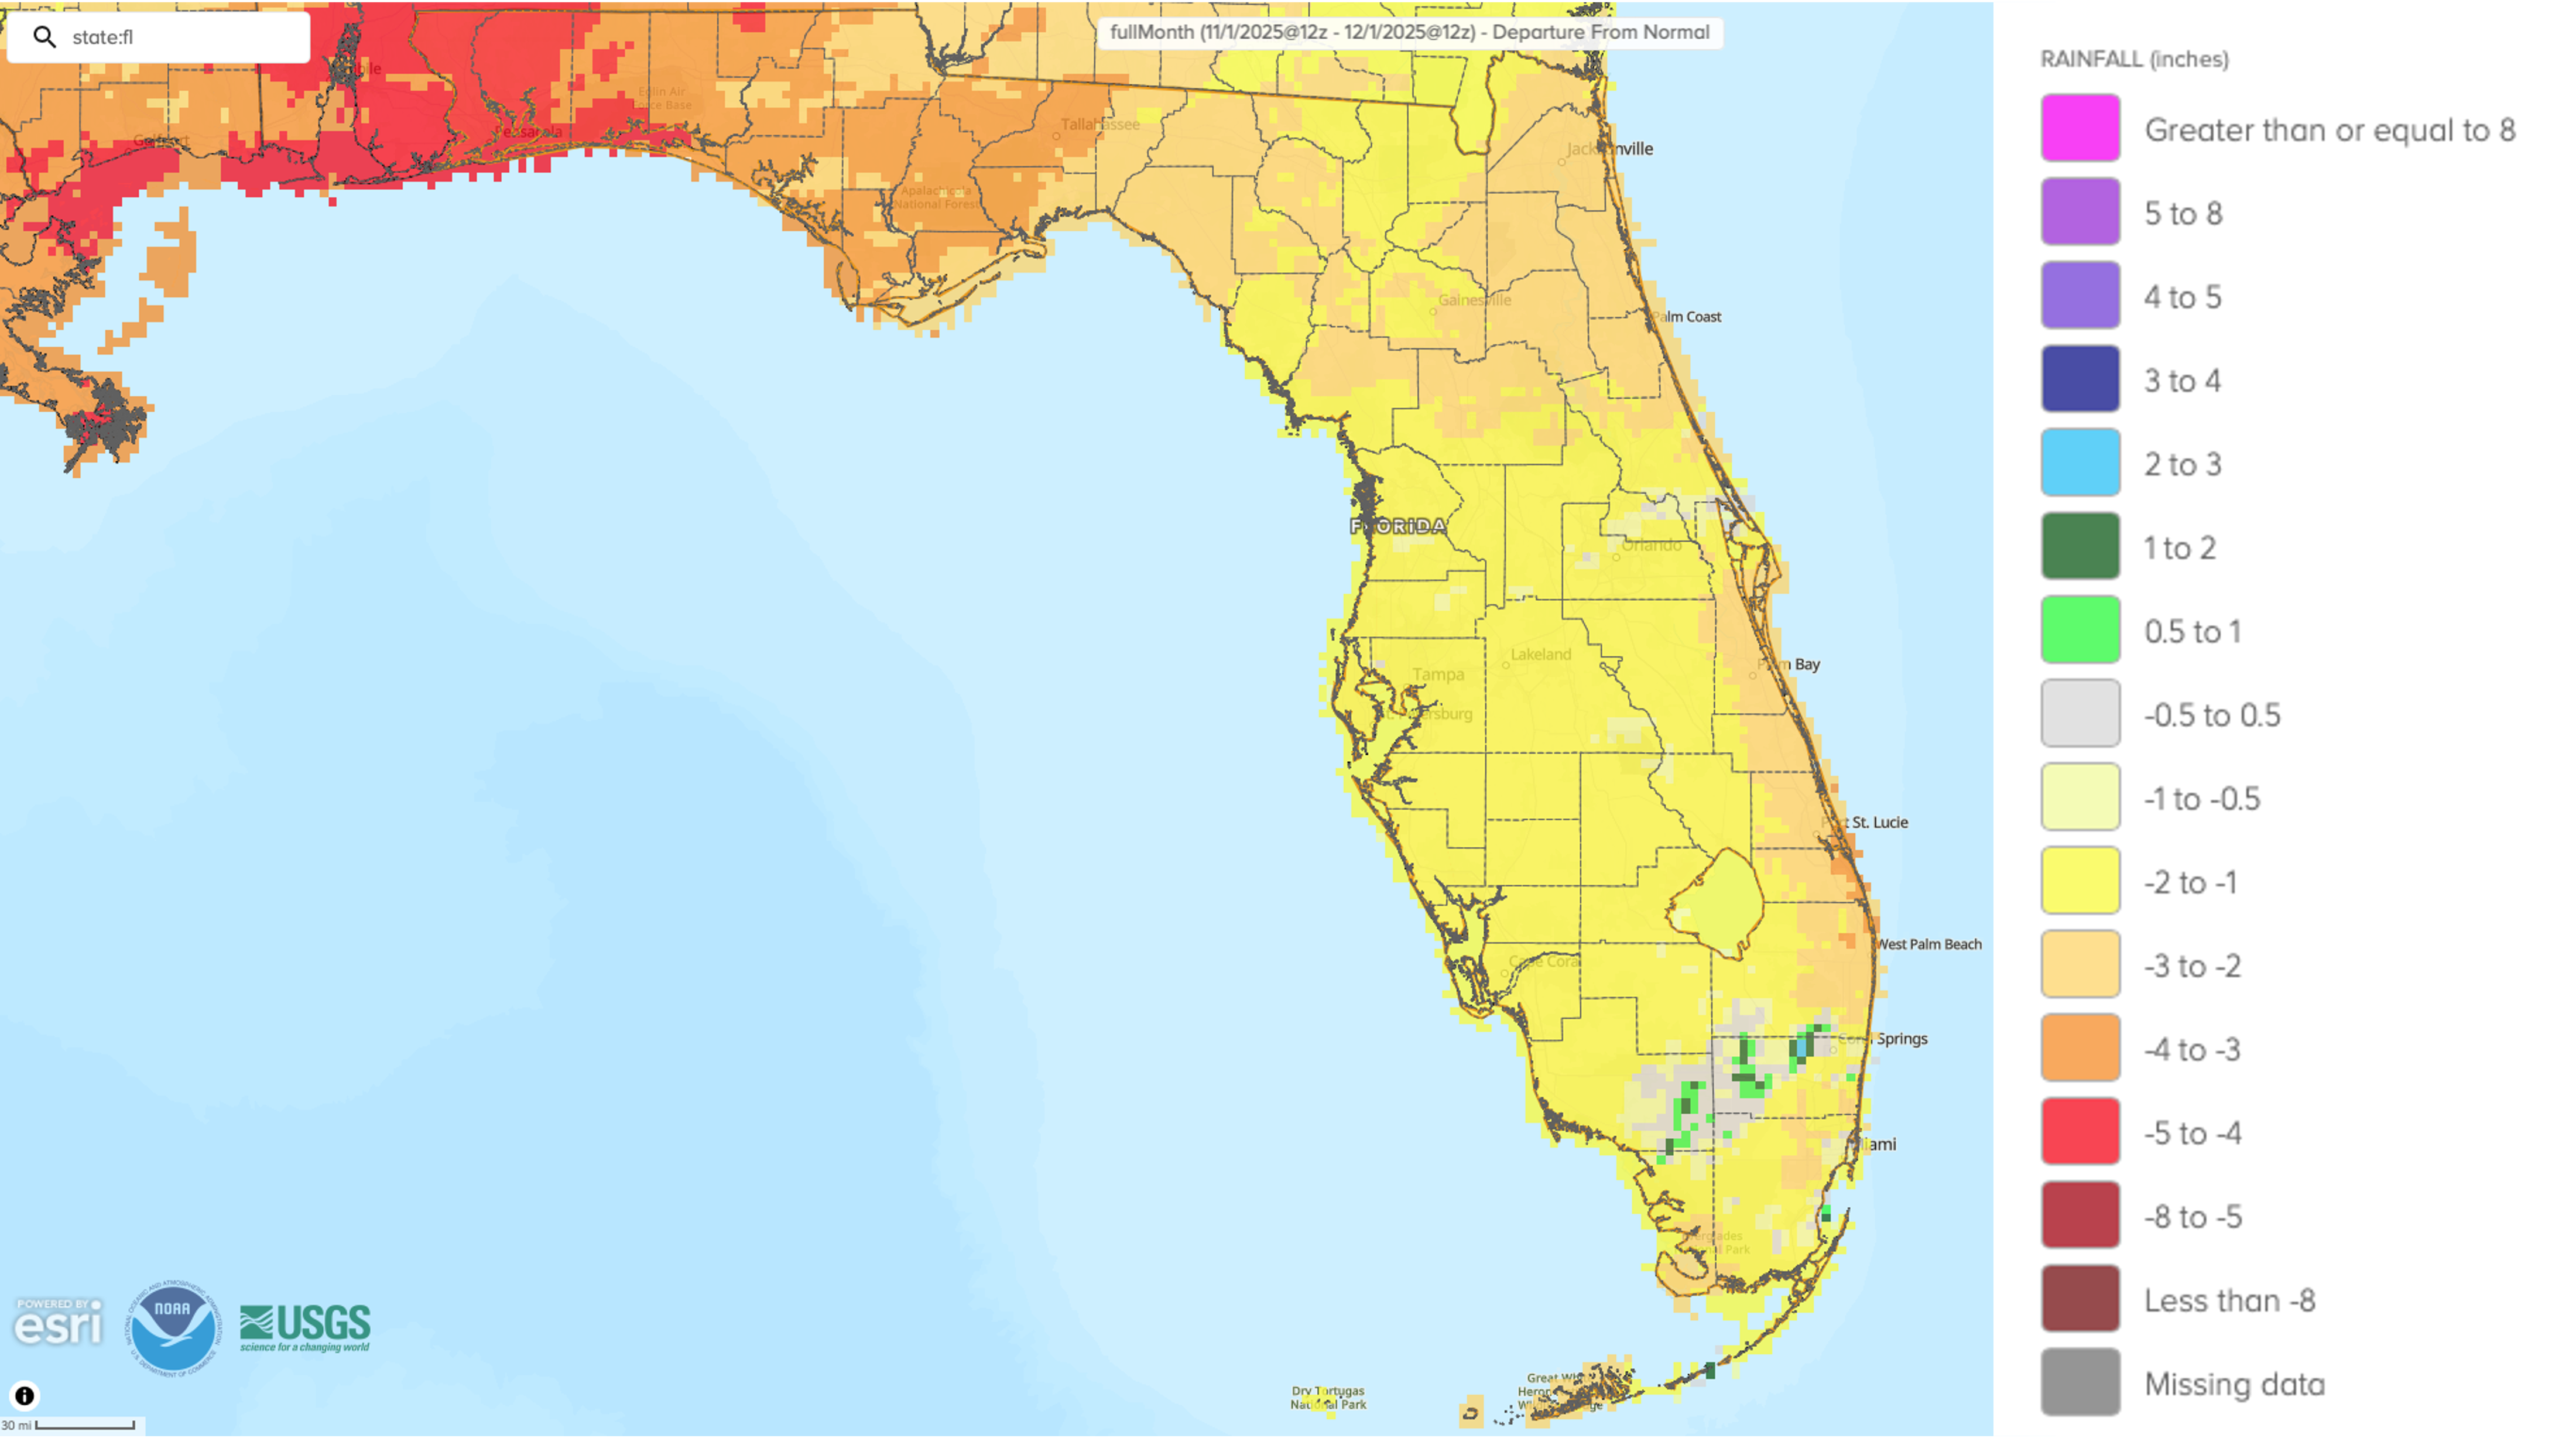
- Monthly precipitation totals in November were below normal across Florida.
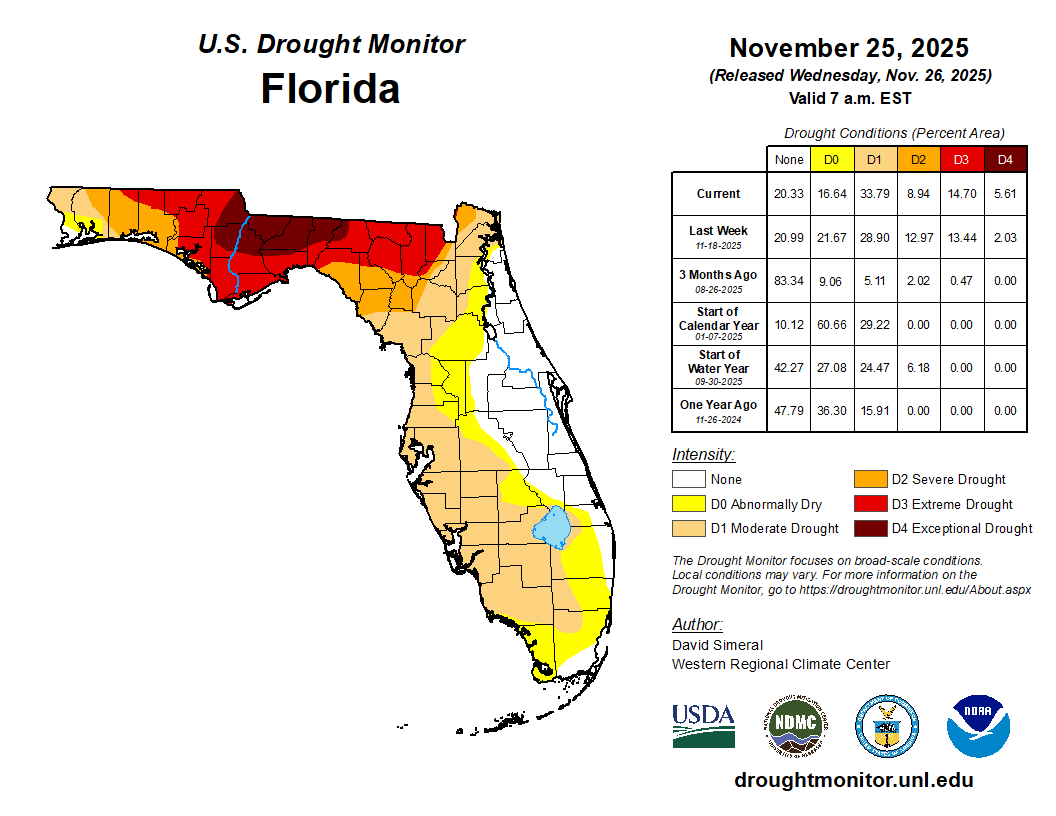
- Drought conditions expanded and worsened during the month, with exceptional drought (D4) being introduced in northern Florida.
- A La Niña advisory continues in the equatorial Pacific Ocean and is favored to persist through December-February 2026 with a transition to ENSO-neutral conditions expected January-March 2026 (61% chance).
- The Atlantic hurricane season closes out near normal with no U.S. hurricane landfalls for the first time in a decade.
Table 1. November average temperatures and departures from normal ( ̊F) for select cities.
| Station | Mean Temperature | Departure from Normal |
| Pensacola | 62.4 | +1.0 |
| Tallahassee | 60.4 | +0.2 |
| Jacksonville | 62.6 | +0.3 |
| Orlando | 67.4 | -0.8 |
| Tampa | 69.9 | +0.1 |
| Miami | 74.5 | -0.3 |
| Key West | 75.6 | -1.0 |
Figure 1. Monthly average temperature departures from normal (°F) for November 2025 for Florida.
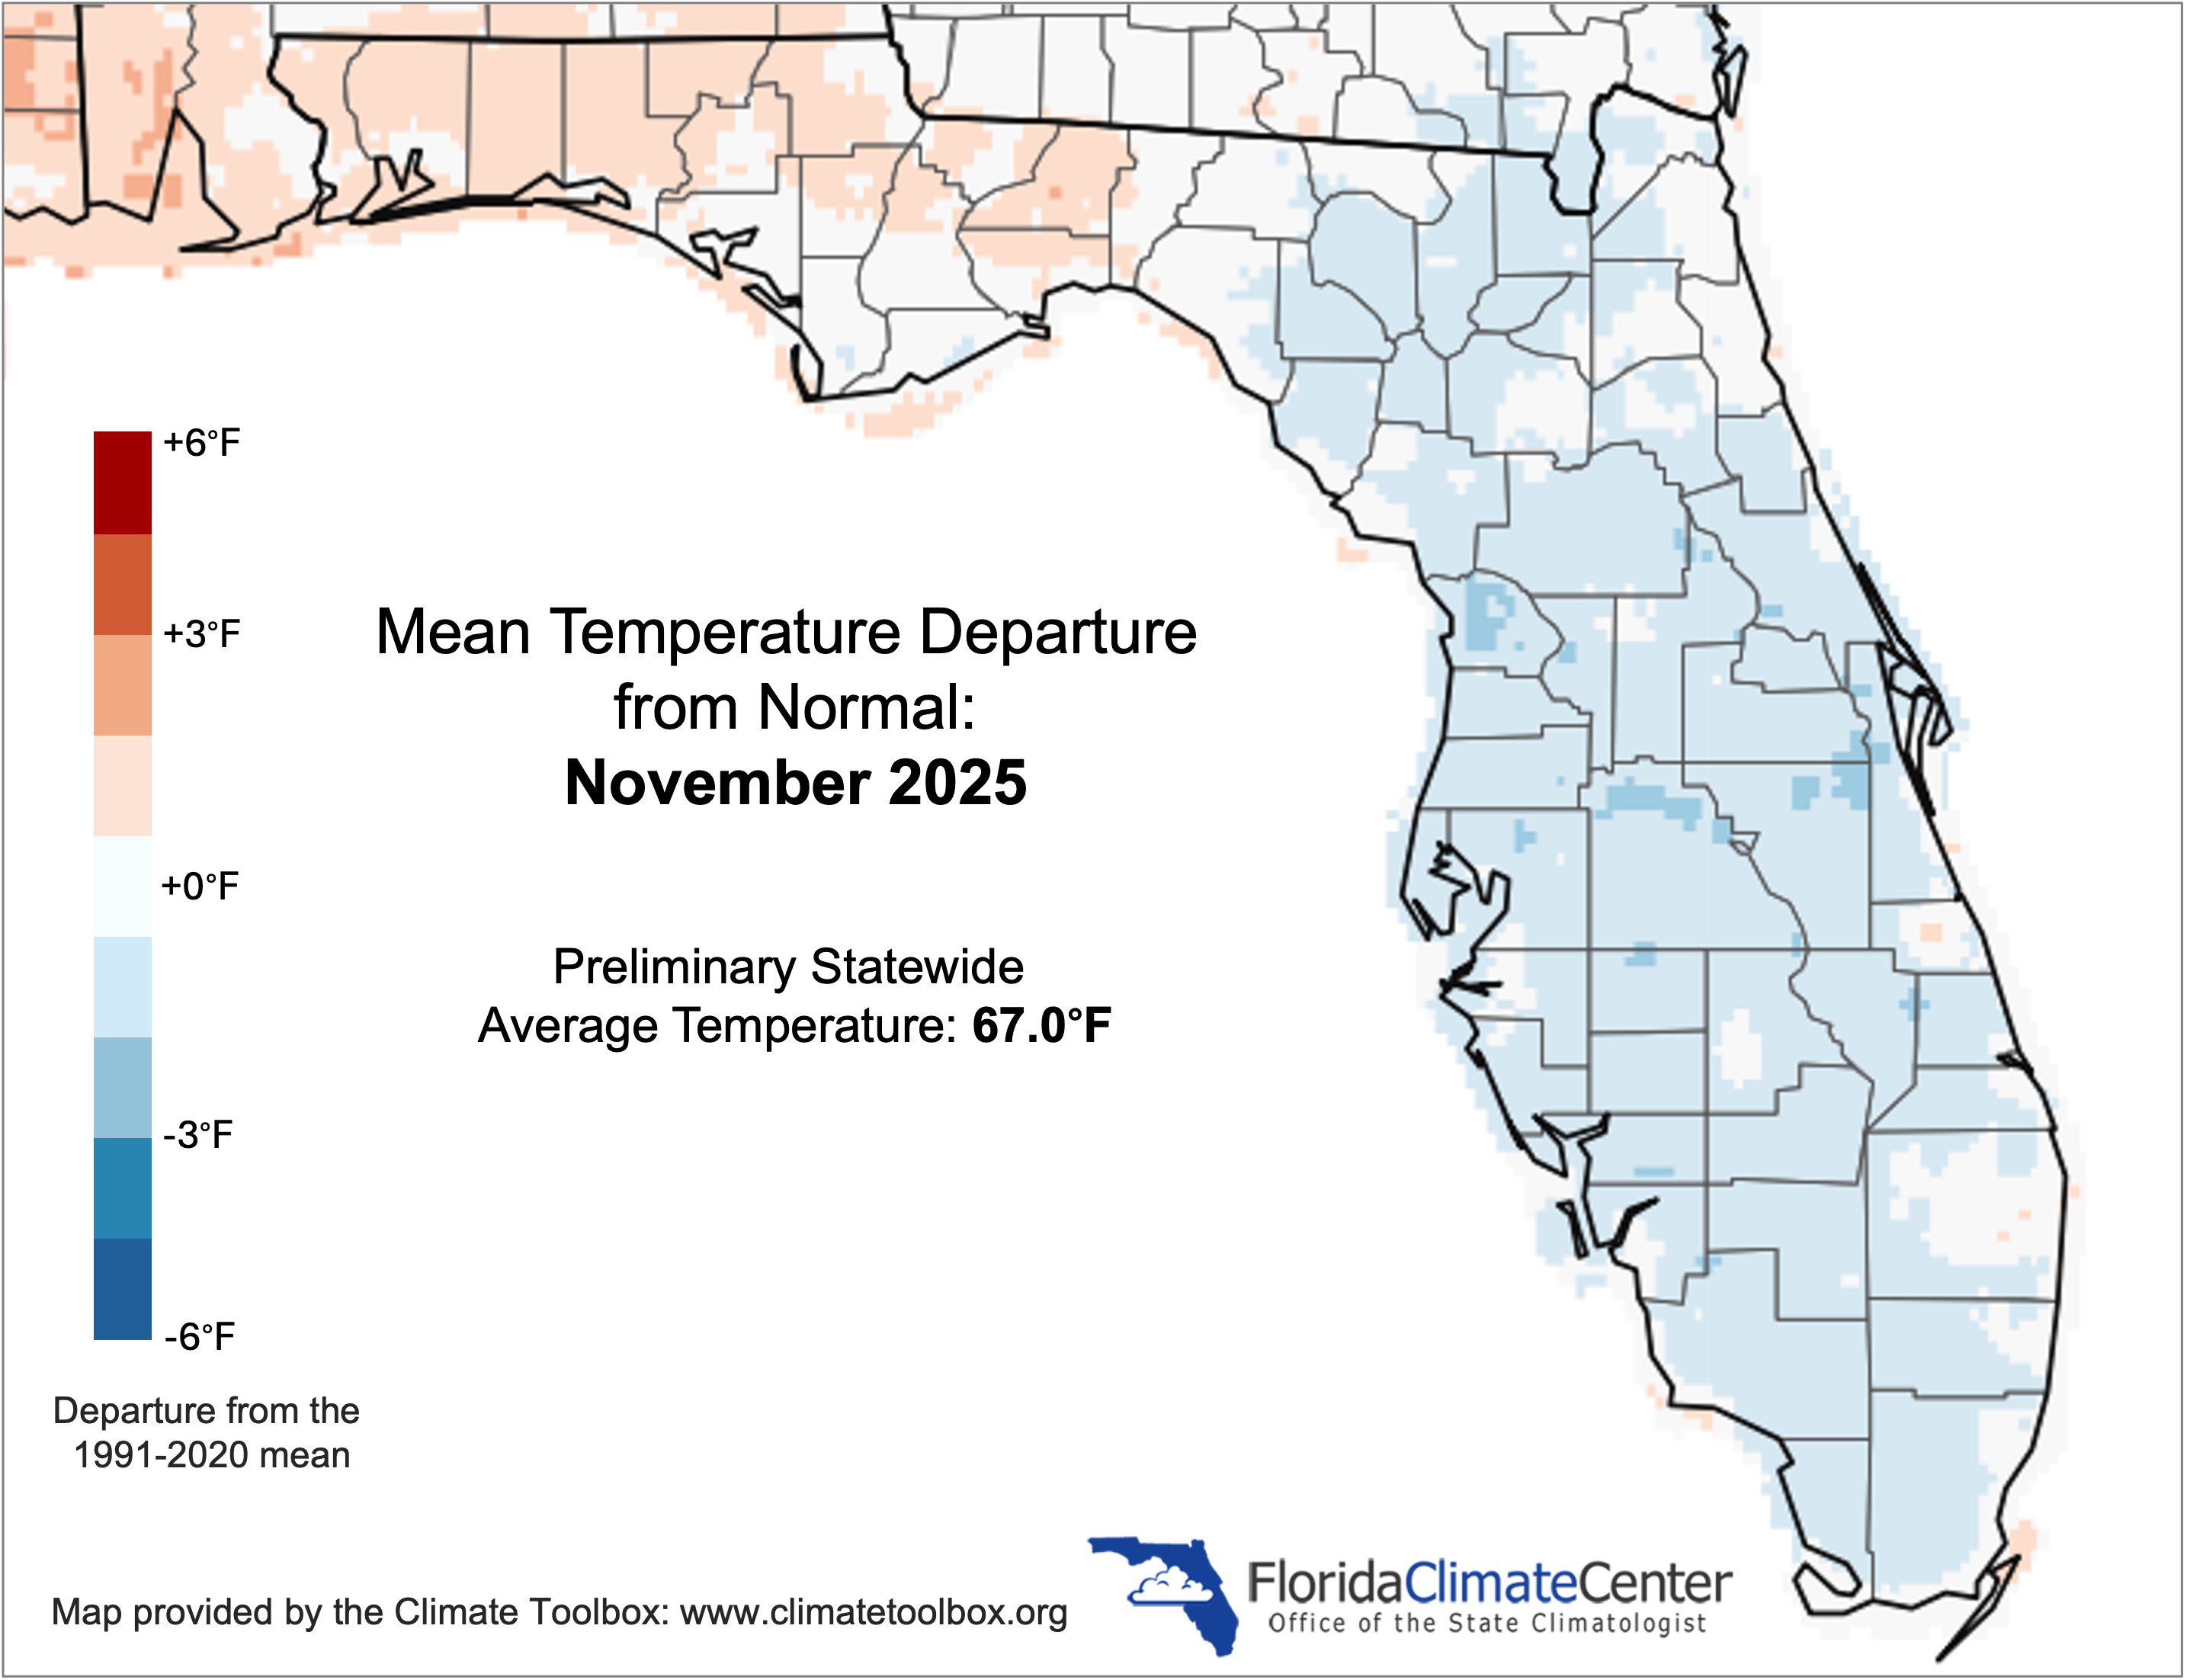
Table 2. November precipitation totals and departures from normal (inches) for selected cities.
| Station | Total Rainfall | Departure from Normal |
| Pensacola | 0.08 | -4.34 |
| Tallahassee | 0.10 | -3.00 |
| Jacksonville | 0.00 | -2.00 |
| Orlando | 0.07 | -1.72 |
| Tampa | 0.07 | -1.33 |
| Miami | 1.76 | -1.77 |
| Key West | 0.09 | -1.96 |
Figure 2. A graphical depiction of the monthly rainfall departure from normal (inches) for November (courtesy of NOAA, NWS).
La Niña Advisory.
La Niña conditions continued over the past month in the tropical equatorial Pacific Ocean. Below-average sea surface temperatures strengthened across the central and eastern regions of the equatorial Pacific, and the latest weekly Niño indices were between -0.5°C and -0.7°C. Negative subsurface temperature anomalies also persisted. La Niña conditions are favored to continue through December-February 2026; however, uncertainty remains high with a 51% chance for La Niña and 48% chance for ENSO-neutral. La Niña is favored to remain weak. In summary, La Niña is favored to continue through the Northern Hemisphere winter, and a transition to ENSO-neutral is more likely in January-March 2026 (61% chance).
Hazardous Weather Events in November.
According to the Local Storm Reports issued by the local National Weather Service offices serving Florida, there were 17 individual local reports of hazardous weather events recorded across the state during the month of November (see Table 3 for a breakdown by event type).
Table 3. Breakdown of storm reports submitted in Florida during the month of November (compiled from Iowa State University/Iowa Environmental Mesonet).
| Report Type | Number of Reports |
| Heavy Rain | 0 |
| Flash Flood | 0 |
| Flood | 1 |
| Hail | 3 |
| Marine Thunderstorm Wind | 1 |
| Non-Thunderstorm Wind Gust | 10 |
| Tornado/Waterspout/Funnel Cloud | 0 / 1 / 0 |
| Thunderstorm Wind Damage | 1 |
| Non-Thunderstorm Wind Damage | 0 |
| Thunderstorm Wind Gust | 0 |
Daily Record Events in November.
Table 4. Summary of daily records broken or set in Florida in November (source: NCEI Daily Weather Records).
| Category | Number of Records |
| Highest daily max. temp. | 32 |
| Highest daily min. temp. | 5 |
| Lowest daily max. temp. | 49 |
| Lowest daily min. temp. | 79 |
| Highest daily precipitation | 2 |
| Total | 167 |
Weather/Climate Highlights of the Month: 2025 Atlantic Hurricane Season Wraps Up Near Normal
The 2025 Atlantic hurricane season officially ended November 30. The season saw a total of 13 named storms, which included 5 hurricanes with 4 of those becoming major hurricanes (category 3 or higher on the Saffir-Simpson Scale). Additionally, of the 4 major hurricanes, 3 of those reached category 5 strength. This represents an impressive ratio of major hurricanes to hurricanes for a season. The climatological average number of storms in a season is 14 named storms, 7 hurricanes, and 3 major hurricanes. You can see that while we did not have the above-average season that was expected, the Atlantic Basin had conditions that were favorable for the intensification of storms that did form. The Accumulated Cyclone Energy (ACE), which combines intensity and duration of all Atlantic named storms occurring during the season as a measure of overall activity, was slightly above average for the season at 108% of average.
The strongest storm of the season was Hurricane Melissa, which made landfall in southwest Jamaica on October 28 with peak sustained winds of 185 mph and a minimum central pressure of 892 mb. This makes Hurricane Melissa tied for most powerful landfalling hurricane in the Atlantic Basin, tied with the Labor Day Hurricane of 1935 for pressure and tied with the Labor Day Hurricane of 1935 and Hurricane Dorian (2019) for wind speed. Overall, Melissa ranks in the top 3 strongest Atlantic hurricanes based on both wind speed and central pressure. The 2025 season was the first season since 2015 with no U.S. landfalling hurricanes.
Drought-Related Impacts.
Drought expanded and worsened in Florida during November. In mid-November, approximately 13% of the state was in extreme drought (D3), 13% was in severe drought (D2), and 20% was in moderate drought (D1); about 28% of the state was abnormally dry (D0), according to the U.S. Drought Monitor. By the end of the month, approximately 6% of the state was in exceptional drought (D4), 15% of the state was in extreme drought (D3), 9% was in severe drought (D2), 34% was in moderate drought (D1), and 17% of the state was abnormally dry (D0) (Figure 2 below).
As of November 30, the Lake Okeechobee water level was 13.66 ft. above sea level (Feet-NGVD29), which is below average for this time of year. At the first of the month, the water level was 13.96 ft. above sea level.
Figure 3. A graphical depiction of the latest drought conditions in Florida according to the U.S. Drought Monitor (courtesy of the National Drought Mitigation Center, University of Nebraska-Lincoln).
Agriculture-Related Impacts.
Appendix 1
Additional November departures from normal data for select Florida locations (source: NWS). "T" denotes a trace of precipitation.
| Station | Average Temperature (˚F) | Departure from Normal (˚F) | Total Rainfall (in.) | Departure from Normal (in.) |
| Gainesville | 63.8 | +1.1 | 0.00 | -1.79 |
| Sarasota | 69.6 | -0.5 | 0.48 | -1.33 |
| Melbourne | 67.3 | -1.7 | 0.39 | -2.16 |
| Fort Myers | 70.8 | -0.7 | T | -1.78 |
| West Palm Beach | 72.9 | -0.1 | 0.40 | -3.22 |
Appendix 2
Select daily record low maximum temperatures broken or tied during November 2025 (compiled from NOAA).
| Location | Date | Record (˚F) | Broken/Tied | Last |
| Pensacola | 10 | 53 | Broken | 57 in 1968 |
| Crestview | 10 | 52 | Broken | 57 in 2011 |
| Bradenton | 11 | 55 | Broken | 65 in 2011 |
| Chipley | 11 | 52 | Broken | 55 in 1977 |
| Daytona Beach | 11 | 63 | Broken | 65 in 1926 |
| Jasper | 11 | 57 | Broken | 58 in 1990 |
| Lake City | 11 | 54 | Tied | 54 in 1913 |
| Ocala | 11 | 57 | Broken | 61 in 1905 |
| Tarpon Springs | 11 | 54 | Broken | 57 in 1894 |
| Venice | 11 | 56 | Broken | 70 in 2011 |
| Orlando | 11 | 58 | Broken | 64 in 1977 |
| Gainesville | 11 | 56 | Broken | 63 in 1987 |
| Daytona Beach | 11 | 55 | Broken | 60 in 1943 |
| Jacksonville | 11 | 55 | Broken | 61 in 1996 |
| Clermont | 12 | 59 | Broken | 62 in 1987 |
| Deland | 12 | 55 | Broken | 57 in 1894 |
| Lisbon | 12 | 54 | Broken | 63 in 1996 |
| Melbourne | 12 | 57 | Broken | 65 in 1977 |
| Stuart | 12 | 63 | Broken | 66 in 1968 |
| Titusville | 12 | 57 | Broken | 60 in 1987 |