
Prepared by Florida Climate Center
The Florida State University
Tallahassee, FL

Summary:
- Monthly average temperatures in September were near normal in Florida.
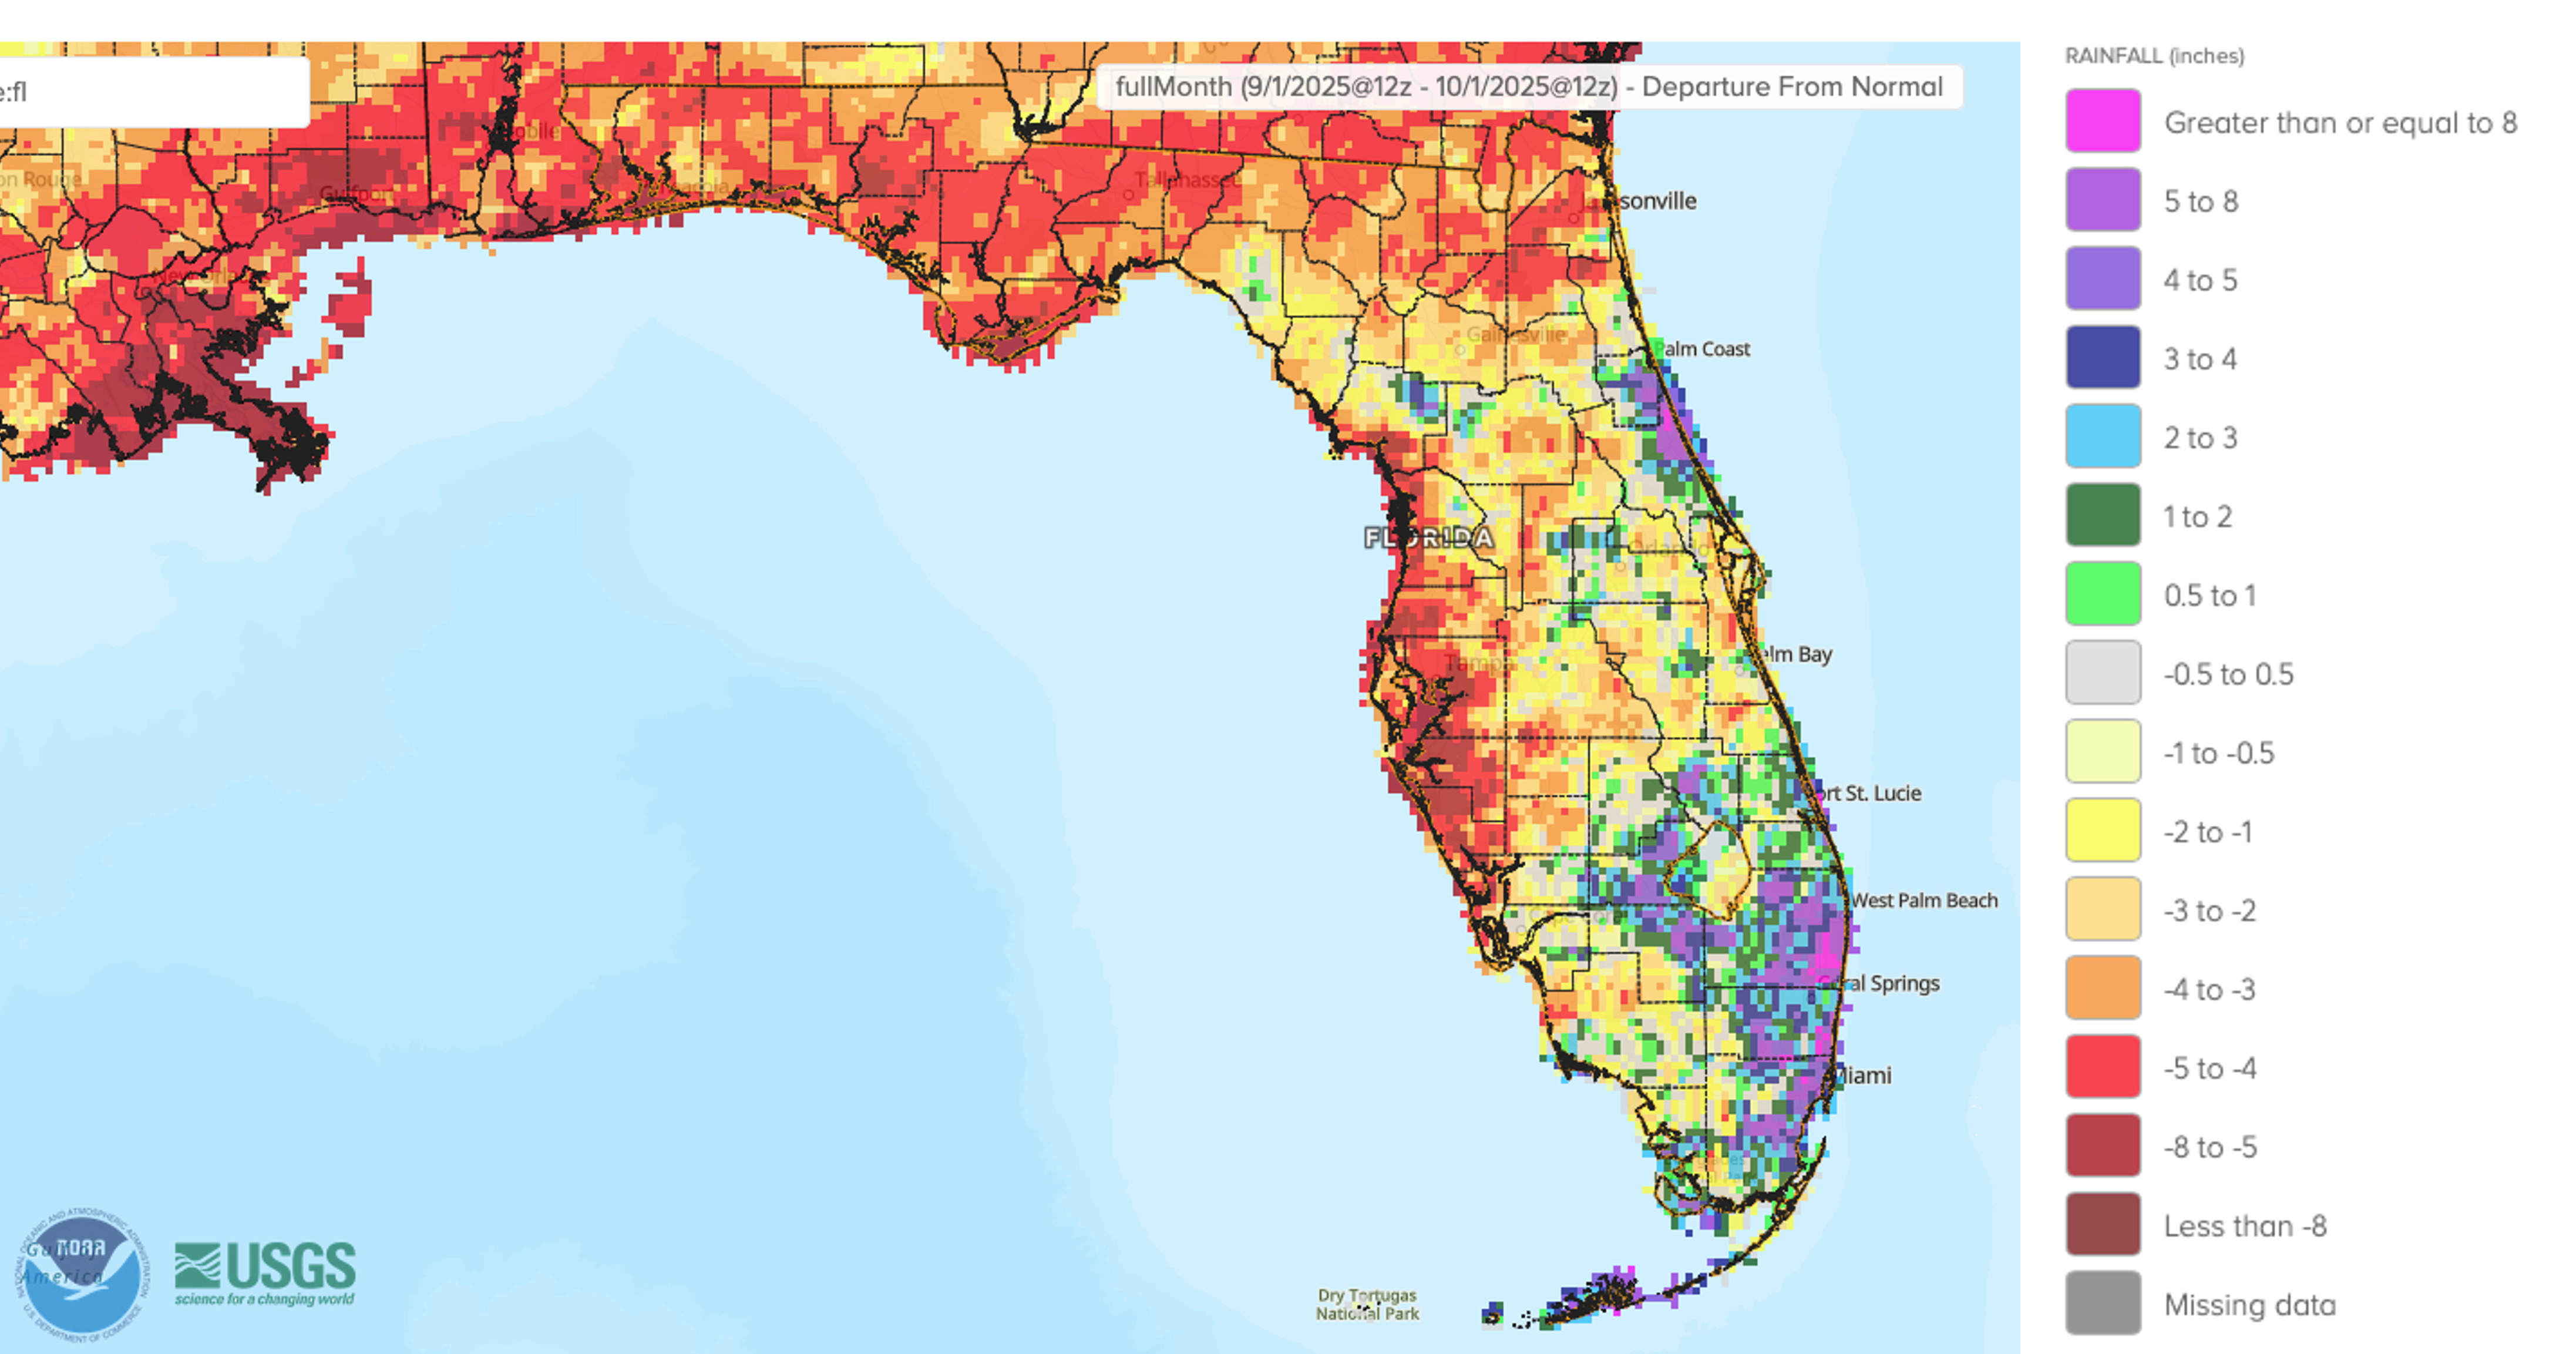
- Monthly precipitation totals in September were below normal in northern Florida and the west coast, and above normal in Southeast Florida and the Keys.
- Drought developed in the Panhandle and North Florida during September, while drought improved in Southeast Florida, though long-term drought impacts remained along coastal areas.
- La Niña is favored to develop in the equatorial Pacific Ocean during fall and early winter with a 71% chance during October-December 2025.
Table 1. September average temperatures and departures from normal ( ̊F) for select cities.
| Station | Mean Temperature | Departure from Normal |
| Pensacola | 79.6 | -0.4 |
| Tallahassee | 78.6 | -0.5 |
| Jacksonville | 78.1 | -0.7 |
| Orlando | 81.8 | +0.8 |
| Tampa | 83.4 | +0.7 |
| Miami | 83.2 | +0.2 |
| Key West | 83.8 | -0.3 |
Table 2. September precipitation totals and departures from normal (inches) for selected cities.
| Station | Total Rainfall | Departure from Normal |
| Pensacola | 2.00 | -4.61 |
| Tallahassee | 0.54 | -4.37 |
| Jacksonville | 2.74 | -4.82 |
| Orlando | 6.42 | +0.05 |
| Tampa | 0.70 | -5.39 |
| Miami | 16.55 | +6.33 |
| Key West | 9.39 | +2.15 |
Figure 1. A graphical depiction of the monthly rainfall departure from normal (inches) for September (courtesy of NOAA, NWS).
La Niña Watch.
ENSO-neutral conditions continued in August 2025 with near to below average sea surface temperatures (SSTs) in the tropical equatorial Pacific Ocean. Odds toward the development of La Niña have increased, with a 71% chance during October-December 2025. For the remainder of winter, La Niña is favored but the probability decreases to 54% during December 2025–February 2026, before returning to ENSO-neutral conditions thereafter.
Hazardous Weather Events in September.
According to the Local Storm Reports issued by the local National Weather Service offices serving Florida, there were 139 individual local reports of hazardous weather events recorded across the state during the month of September (see Table 3 for a breakdown by event type).
Table 3. Breakdown of storm reports submitted in Florida during the month of September (compiled from Iowa State University/Iowa Environmental Mesonet).
| Report Type | Number of Reports |
| Heavy Rain | 26 |
| Flash Flood | 0 |
| Flood | 23 |
| Hail | 1 |
| Marine Thunderstorm Wind | 15 |
| Non-Thunderstorm Wind Gust | 4 |
| Tornado/Waterspout/Funnel Cloud/Landspout | 1 / 20 / 8 / 1 |
| Thunderstorm Wind Damage | 9 |
| Non-Thunderstorm Wind Damage | 0 |
| Thunderstorm Wind Gust | 22 |
Daily Record Events in September.
Table 4. Summary of daily records broken or set in Florida in September (source: NCEI Daily Weather Records).
| Category | Number of Records |
| Highest daily max. temp. | 17 |
| Highest daily min. temp. | 7 |
| Lowest daily max. temp. | 8 |
| Lowest daily min. temp. | 12 |
| Highest daily precipitation | 12 |
| Total | 56 |
Drought-Related Impacts.
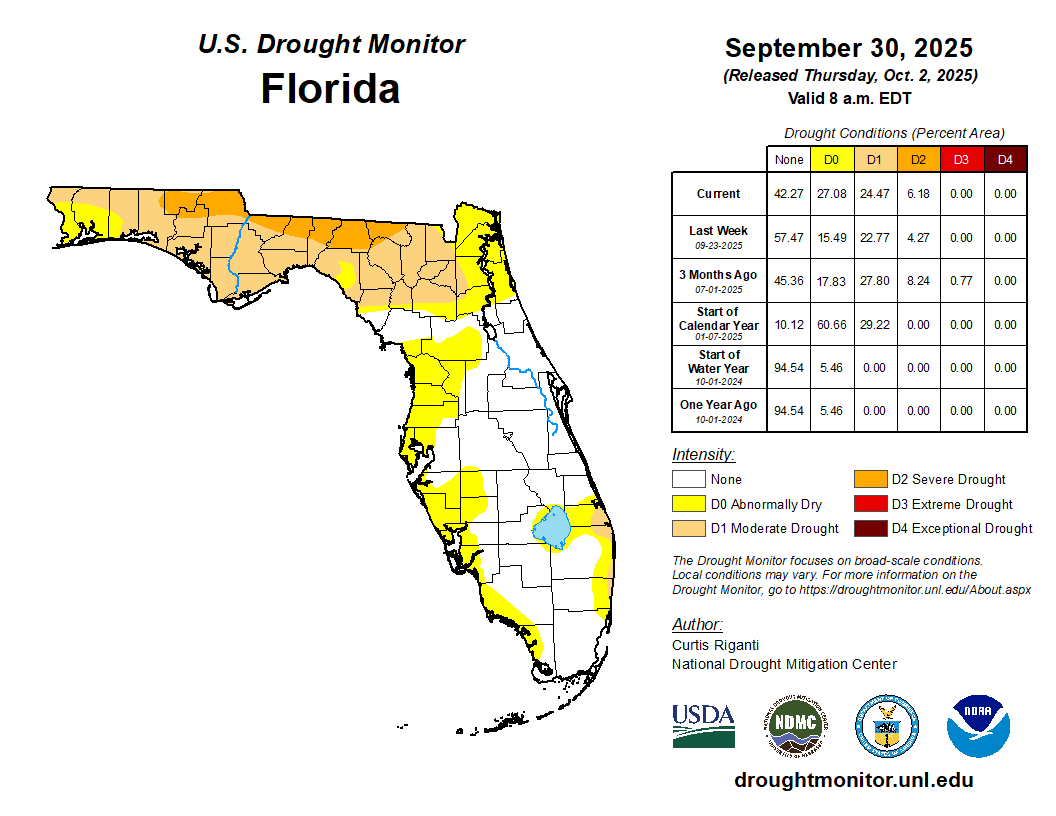
Below-normal rainfall has led to drought development across northern Florida during September. In Southeast Florida, above-normal rainfall led to drought improvement, though long-term drought impacts continued in coastal portions of Martin, Palm Beach, and Broward Counties. In mid-September, roughly 9% of the state was in moderate drought (D1) and 33% was abnormally dry (D0), according to the U.S. Drought Monitor. By the end of September, approximately 6% of the state was in severe drought (D2), 24% was in moderate drought (D1), and 27% of the state was abnormally dry (D0) (Figure 2 below).
As of September 30, the Lake Okeechobee water level was 13.51 ft. above sea level (Feet-NGVD29), which is below average for this time of year. At the first of the month, the water level was 12.52 ft. above sea level.
Figure 2. A graphical depiction of the latest drought conditions in Florida according to the U.S. Drought Monitor (courtesy of the National Drought Mitigation Center, University of Nebraska-Lincoln).
Agriculture-Related Impacts.
In mid-September, topsoil moisture conditions were adequate in 60% of the state, short in 17%, and very short in 8% of the state, while 15% of the state had surplus topsoil moisture conditions. By the end of September, topsoil moisture conditions were adequate in 54% of the state, were short in 21% of the state, and very short in 8% of the state, while 17% of the state had surplus topsoil moisture conditions. For more information, consult the Crop Progress and Conditions reports, which are published by the USDA’s National Agricultural Statistics Service.
Appendix 1
Additional September departures from normal data for select Florida locations (Source: NWS).
| Station | Average Temperature (˚F) | Departure from Normal (˚F) | Total Rainfall (in.) | Departure from Normal (in.) |
| Gainesville | 79.5 | +0.7 | 3.43 | -1.62 |
| Sarasota | 82.0 | -0.2 | 1.66 | -4.34 |
| Melbourne | 80.8 | +0.2 | 8.37 | +0.74 |
| Fort Myers | 82.6 | +0.4 | 6.56 | -2.44 |
| West Palm Beach | 82.7 | +0.8 | 7.96 | 0.00 |
Appendix 2
Select daily record high maximum temperatures (°F) tied or broken during September 2025 (compiled from NOAA).
| Location | Date | Record (˚F) | Broken/Tied | Last |
| Fort Lauderdale Beach | 2 | 96 | Broken | 94 in 2006 |
| Miami | 2 | 94 | Broken | 93 in 2022 |
| Fort Lauderdale Beach | 3 | 96 | Broken | 94 in 2006 |
| Homestead | 3 | 96 | Broken | 95 in 1996 |
| Lakeland | 4 | 99 | Broken | 97 in 1982 |
| Vero Beach | 6 | 95 | Broken | 94 in 1966 |
| Gainesville | 7 | 95 | Tied | 95 in 2019 |
| Miami | 11 | 94 | Tied | 94 in 2022 |
| Chipley | 20 | 99 | Broken | 97 in 2010 |
| Niceville | 20 | 95 | Broken | 94 in 2005 |
| Chipley | 21 | 100 | Tied | 100 in 2010 |
| Gainesville | 22 | 95 | Broken | 92 in 2022 |
| Gainesville | 23 | 96 | Broken | 93 in 2018 |
| Chipley | 24 | 97 | Broken | 95 in 2010 |
| Clermont | 24 | 96 | Broken | 95 in 2024 |
| Fort Lauderdale Beach | 26 | 92 | Broken | 91 in 2022 |
| Ocala | 26 | 95 | Tied | 95 in 1961 |
| Quincy | 26 | 94 | Broken | 93 in 2016 |
| Miles City | 27 | 96 | Broken | 95 in 2019 |
| Tampa | 28 | 95 | Tied | 95 in 1961 |