
Prepared by Florida Climate Center
The Florida State University
Tallahassee, FL

Summary:
- Monthly average temperatures in July were near to above normal across Florida.
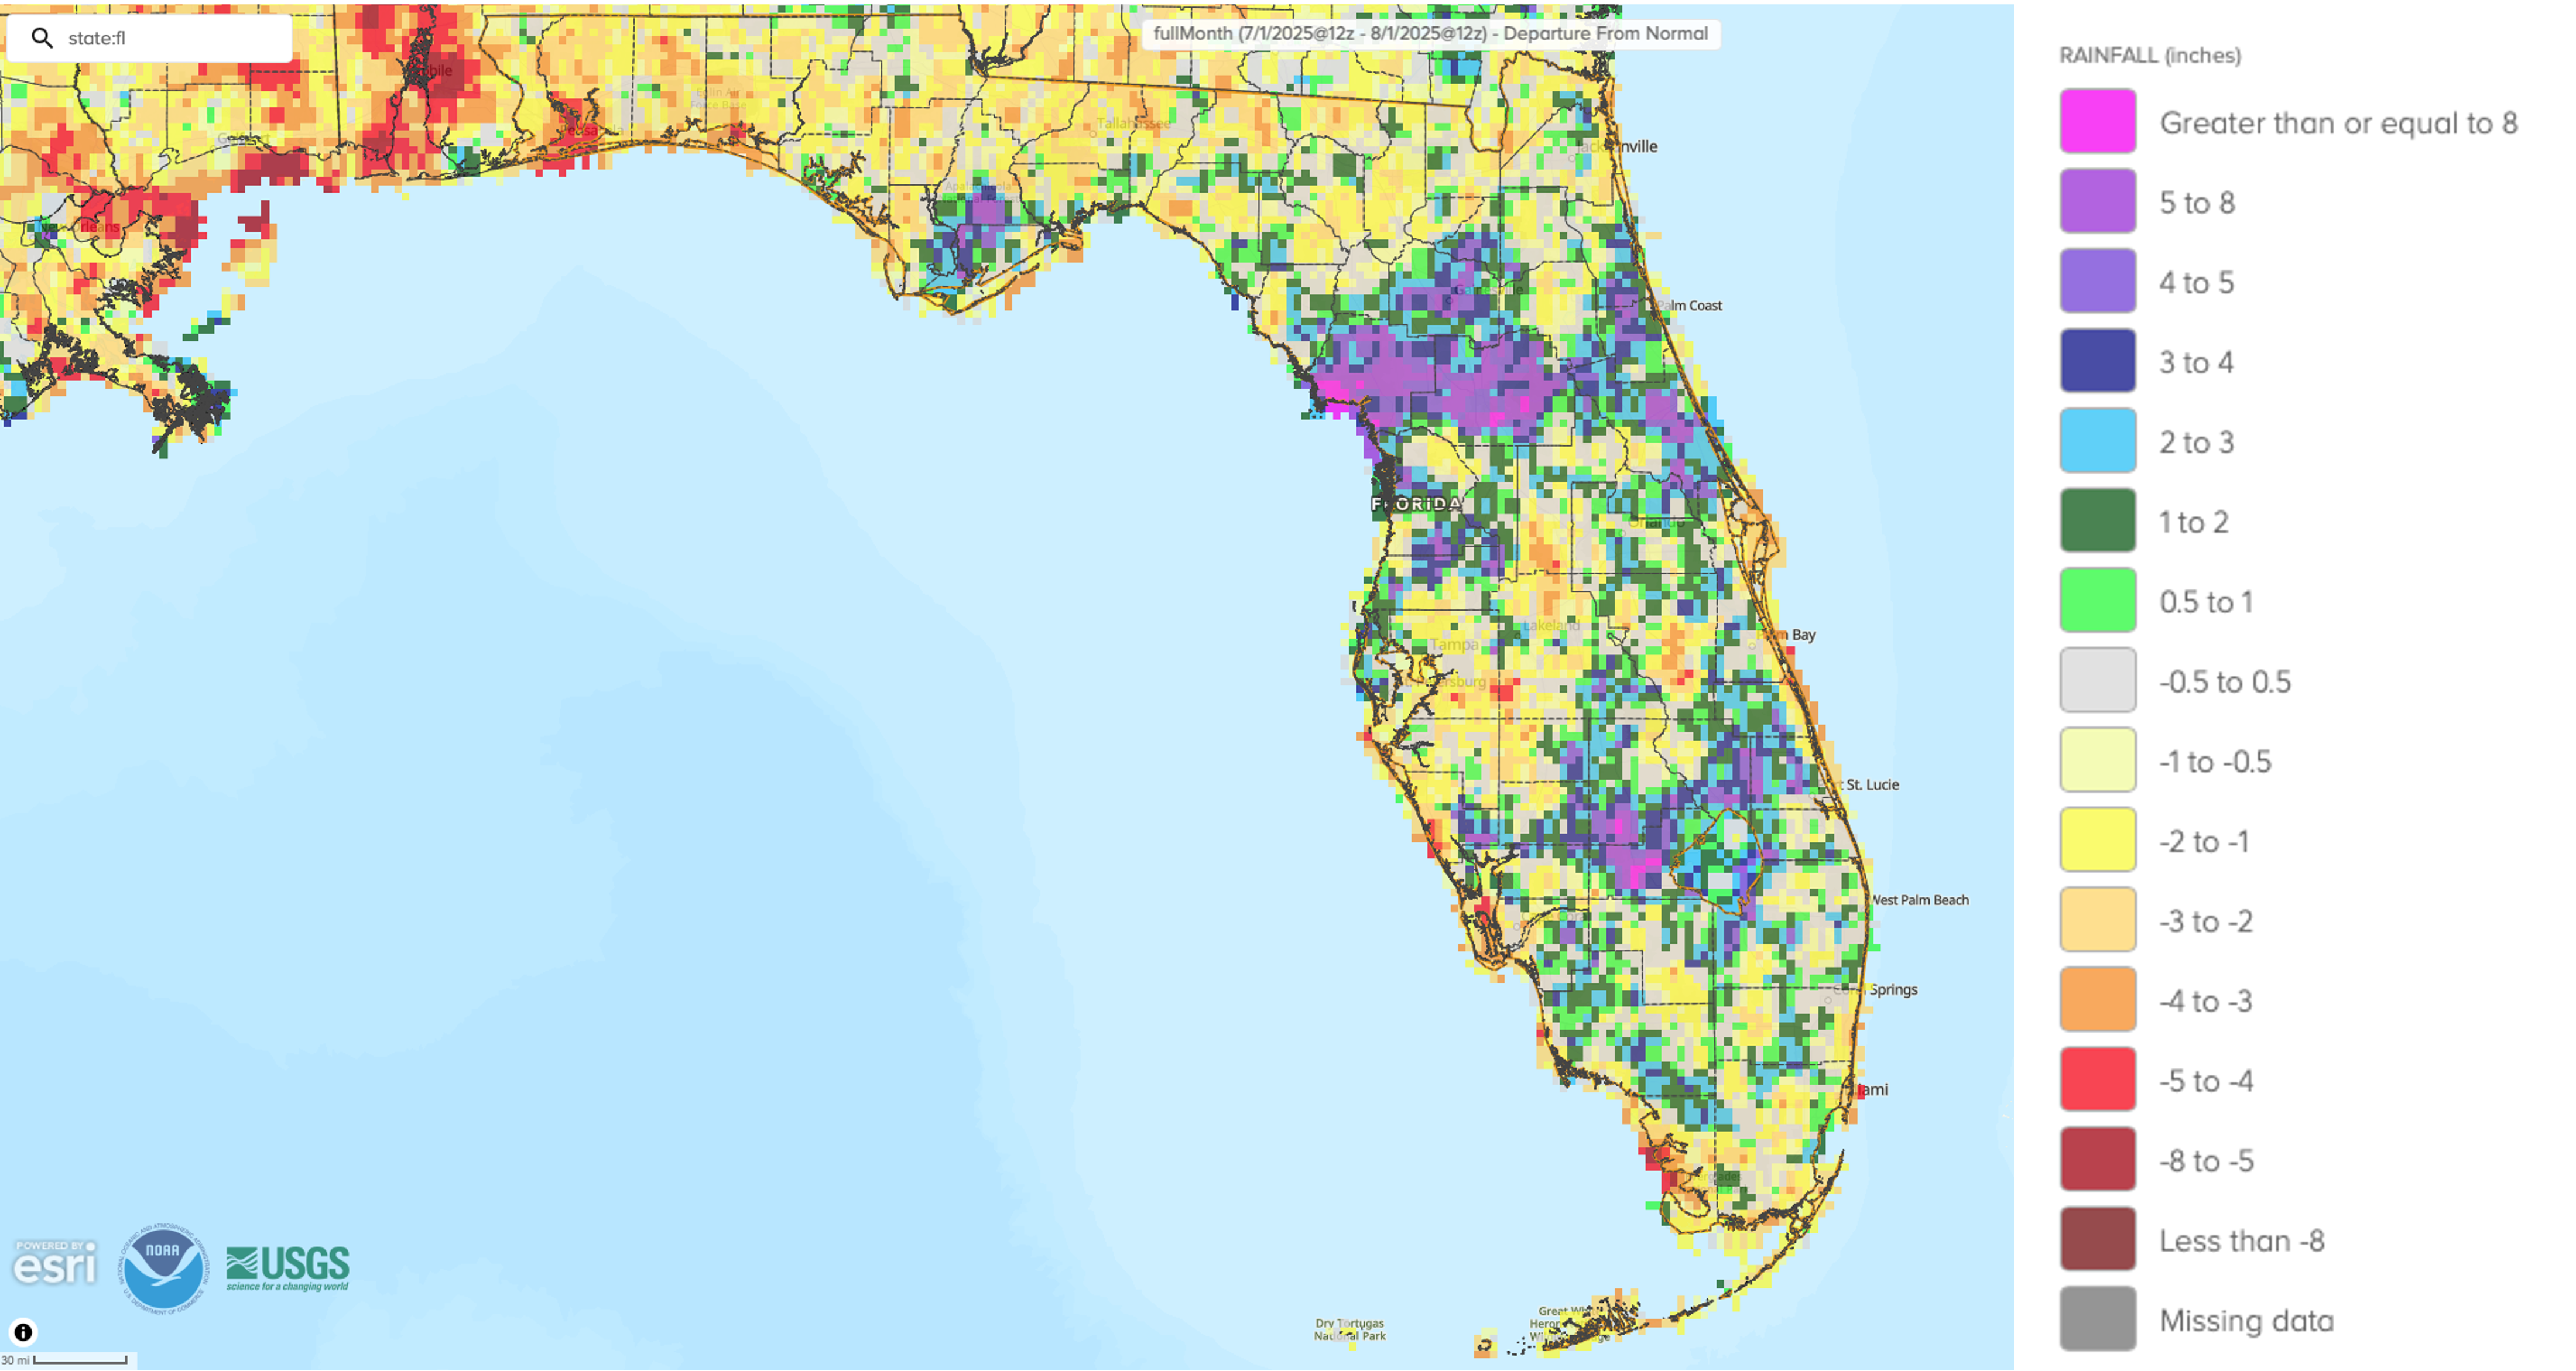
- Monthly precipitation totals in July were below normal in the Panhandle and mixed across the Peninsula.
- While drought conditions improved during July, moderate (D1) to extreme drought (D3) persisted in South Florida.
- ENSO-neutral conditions continued in the tropical Pacific Ocean and are expected to persist through the Northern Hemisphere summer and early fall (56% chance during August-October).
Table 1. July average temperatures and departures from normal ( ̊F) for select cities.
| Station | Mean Temperature | Departure from Normal |
| Pensacola | 84.8 | +1.3 |
| Tallahassee | 84.6 | +2.1 |
| Jacksonville | 84.8 | +2.3 |
| Orlando | 83.9 | +1.3 |
| Tampa | 85.6 | +1.8 |
| Miami | 84.4 | +0.3 |
| Key West | 85.2 | -0.2 |
Table 2. July precipitation totals and departures from normal (inches) for selected cities.
| Station | Total Rainfall | Departure from Normal |
| Pensacola | 2.93 | -4.96 |
| Tallahassee | 3.14 | -4.00 |
| Jacksonville | 7.01 | +0.24 |
| Orlando | 10.04 | +2.58 |
| Tampa | 7.60 | -0.15 |
| Miami | 8.92 | +1.56 |
| Key West | 3.16 | -0.47 |
Figure 1. A graphical depiction of the monthly rainfall departure from normal (inches) for July (courtesy of NOAA, NWS).
ENSO-Neutral Conditions Present in Pacific.
ENSO-neutral conditions are currently present in the tropical equatorial Pacific Ocean. Over the past month, near-average sea surface temperatures continued across most of the equatorial Pacific Ocean, and the latest weekly Niño index values ranged from 0.0 ̊C to +0.4 ̊C. ENSO-neutral conditions are most likely to persist through the end of the Northern Hemisphere summer and early fall (56% chance during August-October). Chances of La Niña conditions increase into the winter 2025-26, but there is high uncertainty as chances for La Niña are comparable to chances for ENSO-neutral through winter.
Hazardous Weather Events in July.
According to the Local Storm Reports issued by the local National Weather Service offices serving Florida, there were 326 individual local reports of hazardous weather events recorded across the state during the month of July (see Table 3 for a breakdown by event type). July saw a typical active summer pattern, with hit-and-miss thunderstorms bringing heavy rainfall, lightning, and gusty winds. A lightning strike injured three people at St. Pete Beach on the July 4th holiday, and lightning injured three others at the St. Augustine Beach pier on the 12th. Plant City experienced flash flooding after 9-12 inches of rain fell within 24 hours on the 14th. Later in the month, a large area of high pressure led to below-normal rainfall and dangerous humid heat across the state with heat index values peaking to over 115 ̊F in some places. Wildfires were reported in Southeast Florida in Palm Beach, Broward, and Miami-Dade Counties. The 13 Mile Fire in Palm Beach County has burned 13,000 acres, but no injuries or major impacts were reported.
Table 3. Breakdown of storm reports submitted in Florida during the month of July (compiled from Iowa State University/Iowa Environmental Mesonet).
| Report Type | Number of Reports |
| Heavy Rain | 48 |
| Flash Flood | 7 |
| Flood | 7 |
| Hail | 17 |
| Marine Thunderstorm Wind | 38 |
| Non-Thunderstorm Wind Gust | 15 |
| Tornado/Waterspout/Funnel Cloud | 1 / 8 / 4 |
| Thunderstorm Wind Damage | 33 |
| Non-Thunderstorm Wind Damage | 0 |
| Thunderstorm Wind Gust | 133 |
| Lightning | 10 |
| Wildfire | 5 |
Daily Record Events in July.
Table 4. Summary of daily records broken or set in Florida in July (source: NCEI Daily Weather Records).
| Category | Number of Records |
| Highest daily max. temp. | 55 |
| Highest daily min. temp. | 45 |
| Lowest daily max. temp. | 3 |
| Lowest daily min. temp. | 1 |
| Highest daily precipitation | 26 |
| Total | 130 |
Drought-Related Impacts.
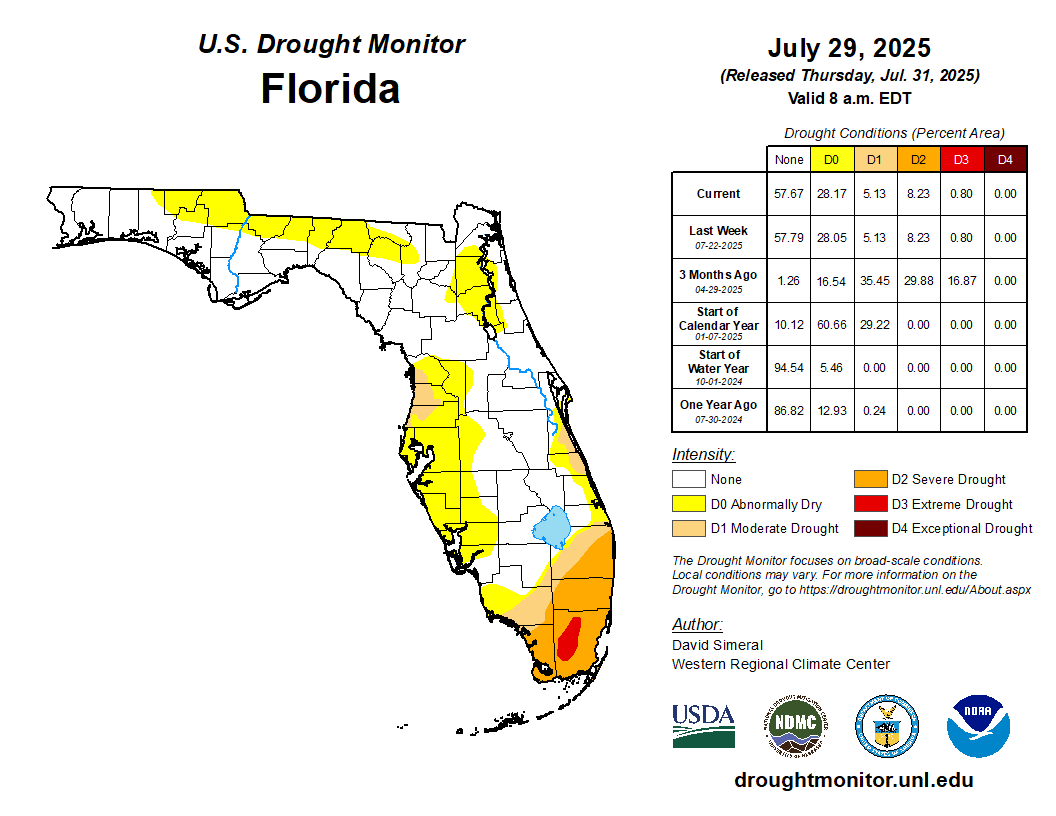
Drought improved across Peninsular Florida over the past month, but drought continues to affect South Florida and some coastal regions. In mid-July, approximately 1% of the state was in extreme drought (D3), 8% was in severe drought (D2), 6% of the state was in moderate drought (D1), and 27% was abnormally dry (D0), according to the U.S. Drought Monitor. Not much changed during the second half of the month. By the end of July, approximately 1% of the state was in extreme drought (D3), 8% was in severe drought (D2), 5% was in moderate drought (D1), and 28% of the state was abnormally dry (D0) (Figure 2 below).
As of July 31, the Lake Okeechobee water level was 12.09 ft. above sea level (Feet-NGVD29), which is below average for this time of year. At the first of the month, the water level was 11.22 ft. above sea level.
Figure 2. A graphical depiction of the latest drought conditions in Florida according to the U.S. Drought Monitor (courtesy of the National Drought Mitigation Center, University of Nebraska-Lincoln).
Agriculture-Related Impacts.
In mid-July, topsoil moisture conditions were adequate in 57% of the state, short in 18%, and very short in 4% of the state, while 21% of the state had surplus topsoil moisture conditions. By the end of July, topsoil moisture conditions remained adequate in 65% of the state, were short in 14% of the state, and very short in 1% of the state, while 20% of the state had surplus topsoil moisture conditions. For more information, consult the Crop Progress and Conditions report, which is published by the USDA’s National Agricultural Statistics Service.
Appendix 1
Additional July departures from normal data for select Florida locations (Source: NWS).
| Station | Average Temperature (˚F) | Departure from Normal (˚F) | Total Rainfall (in.) | Departure from Normal (in.) |
| Gainesville | 84.1 | +2.7 | 11.34 | +4.66 |
| Sarasota | 83.2 | +0.1 | 6.21 | -1.18 |
| Melbourne | 83.3 | +1.6 | 7.09 | +0.59 |
| Fort Myers | 84.7 | +1.5 | 5.00 | -4.38 |
| Naples | 84.8 | +1.7 | 4.07 | -3.70 |
| West Palm Beach | 84.4 | +1.3 | 6.41 | +0.78 |
Appendix 2
Select daily record high maximum temperatures (°F) tied or broken during July 2025 (compiled from NOAA).
| Location | Date | Record (˚F) | Broken/Tied | Last |
| Fort Lauderdale | 1 | 94 | Broken | 93 in 2015 |
| Ochopee | 9 | 98 | Tied | 98 in 2016 |
| Clermont | 11 | 98 | Tied | 98 in 2016 |
| Gainesville | 14 | 97 | Broken | 96 in 1986 |
| Marianna | 15 | 99 | Tied | 99 in 2000 |
| Bradenton | 19 | 97 | Broken | 96 in 2024 |
| Miles City | 19 | 100 | Broken | 98 in 2019 |
| Gainesville | 19 | 98 | Broken | 97 in 2000 |
| Lakeland | 20 | 98 | Broken | 97 in 1993 |
| Clermont | 21 | 102 | Broken | 99 in 2024 |
| Lake City | 21 | 100 | Broken | 99 in 2000 |
| Ochopee | 21 | 98 | Broken | 97 in 2011 |
| Lakeland | 21 | 98 | Broken | 97 in 1993 |
| Clermont | 22 | 99 | Broken | 98 in 2024 |
| Naples | 22 | 96 | Tied | 96 in 2010 |
| Niceville | 23 | 99 | Broken | 98 in 1948 |
| Lake City | 24 | 100 | Broken | 99 in 1952 |
| Jacksonville | 26 | 99 | Broken | 98 in 1940 |
| Bradenton | 27 | 97 | Broken | 96 in 2023 |
| Clermont | 27 | 101 | Broken | 98 in 2024 |
| Gainesville | 27 | 100 | Broken | 98 in 2010 |
| Tampa | 27 | 100 | Broken | 97 in 1996 |
| Jacksonville | 27 | 100 | Broken | 99 in 2010 |
| Clermont | 28 | 103 | Broken | 98 in 2016 |
| Lisbon | 28 | 98 | Broken | 97 in 2010 |
| Plant City | 28 | 99 | Broken | 98 in 2017 |
| Usher Tower | 28 | 98 | Broken | 97 in 2010 |
| Orlando | 28 | 98 | Broken | 97 in 1992 |
| Gainesville | 28 | 100 | Broken | 97 in 2010 |
| Fort Myers | 28 | 98 | Broken | 97 in 1979 |
| Jacksonville | 28 | 101 | Tied | 101 in 2016 |
| Clermont | 29 | 105 | Broken | 98 in 2016 |
| Ocala | 29 | 101 | Broken | 99 in 2010 |
| Plant City | 29 | 100 | Broken | 98 in 2022 |
| Gainesville | 29 | 100 | Broken | 98 in 2010 |
| Orlando | 29 | 100 | Broken | 98 in 2010 |
| Jacksonville | 29 | 101 | Broken | 99 in 2016 |
| Clermont | 30 | 103 | Broken | 100 in 1961 |
| Deland | 30 | 101 | Broken | 98 in 2010 |
| Jasper | 30 | 102 | Broken | 100 in 1963 |
| Kissimmee | 30 | 98 | Broken | 96 in 2017 |
| Wauchula | 30 | 99 | Broken | 97 in 2009 |
| Lisbon | 31 | 101 | Broken | 96 in 2010 |