
Prepared by Florida Climate Center
The Florida State University
Tallahassee, FL

Summary:
- Average monthly temperatures in March were near to above normal in Florida.
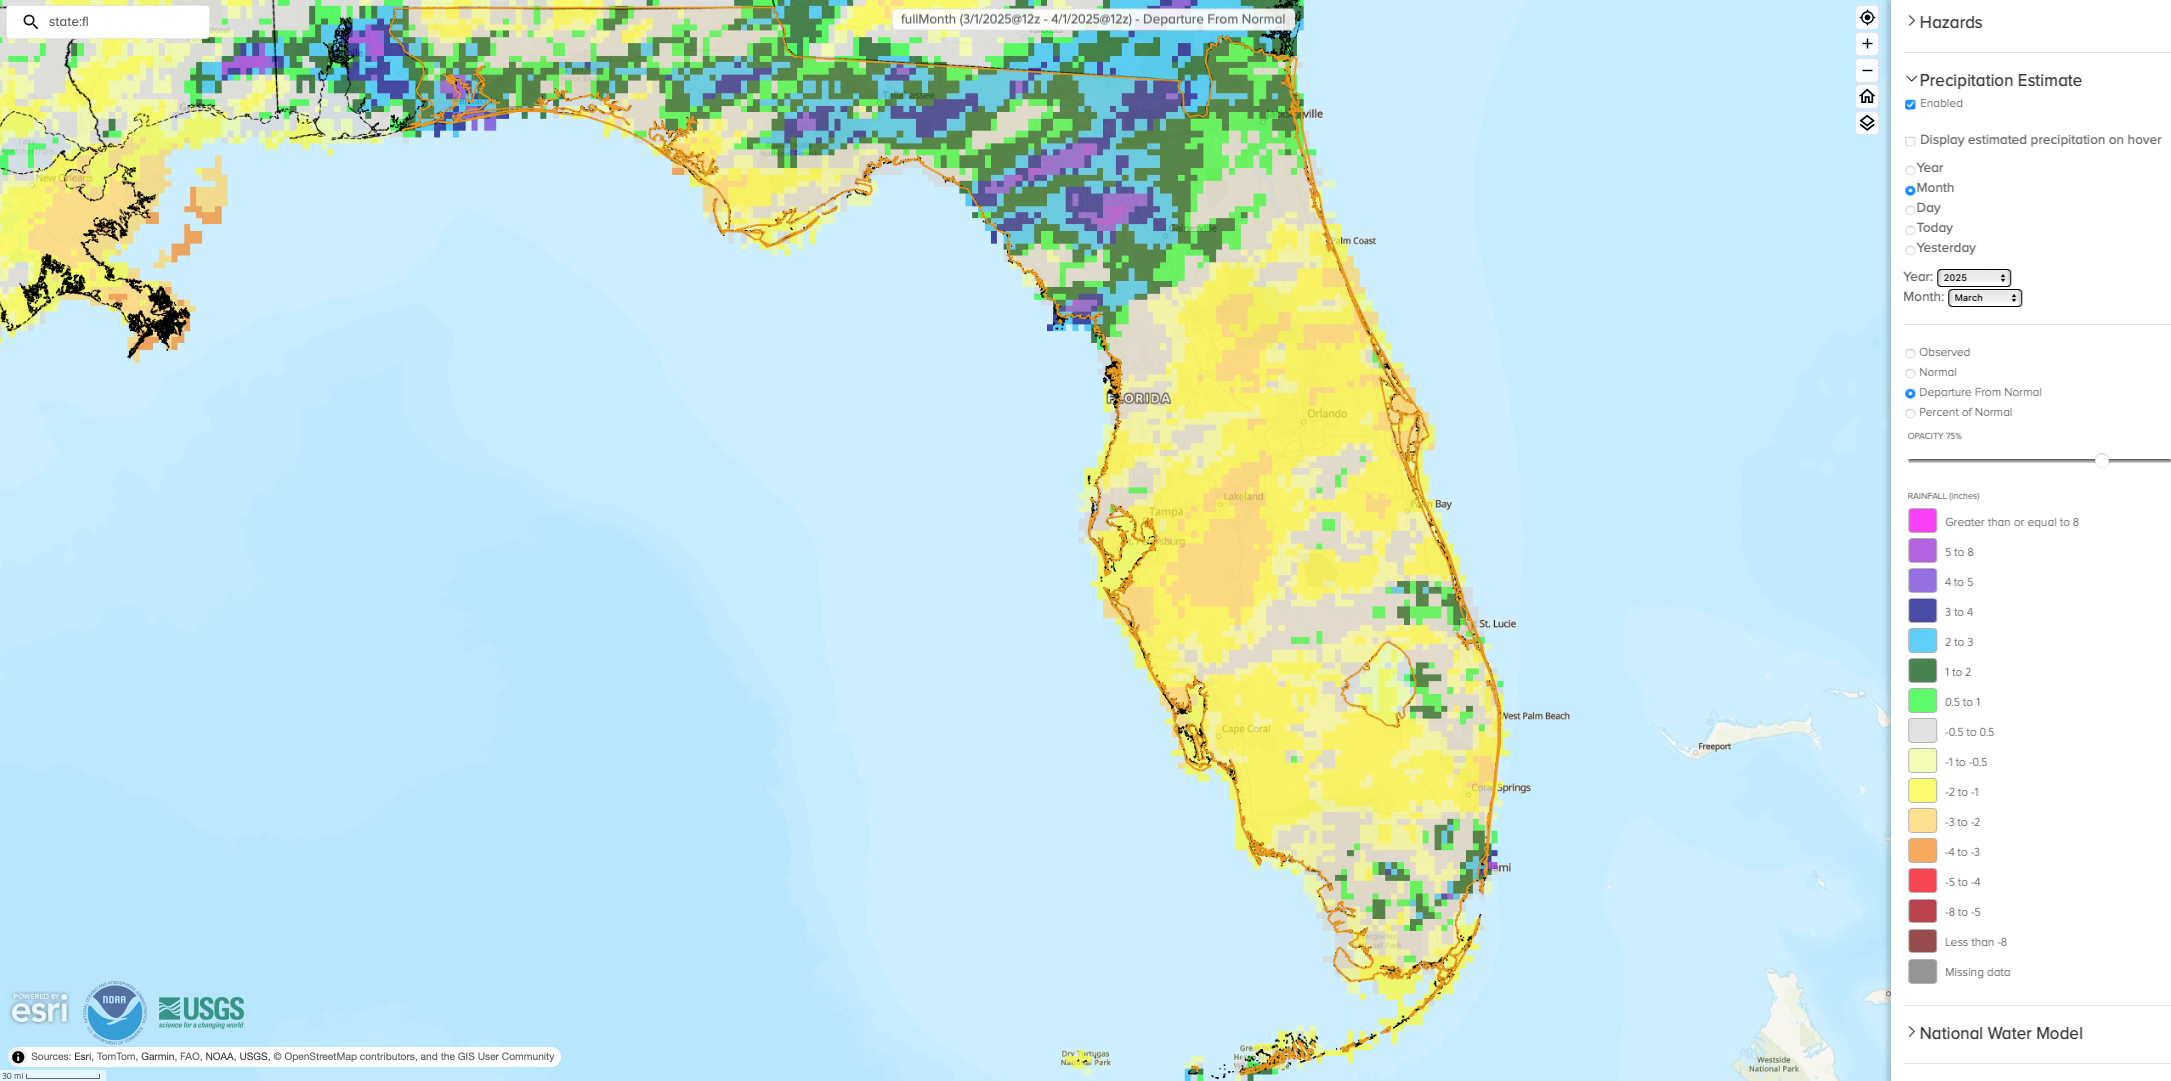
- Monthly precipitation totals in March were generally below normal in the Peninsula and above normal across northern Florida and the Keys.
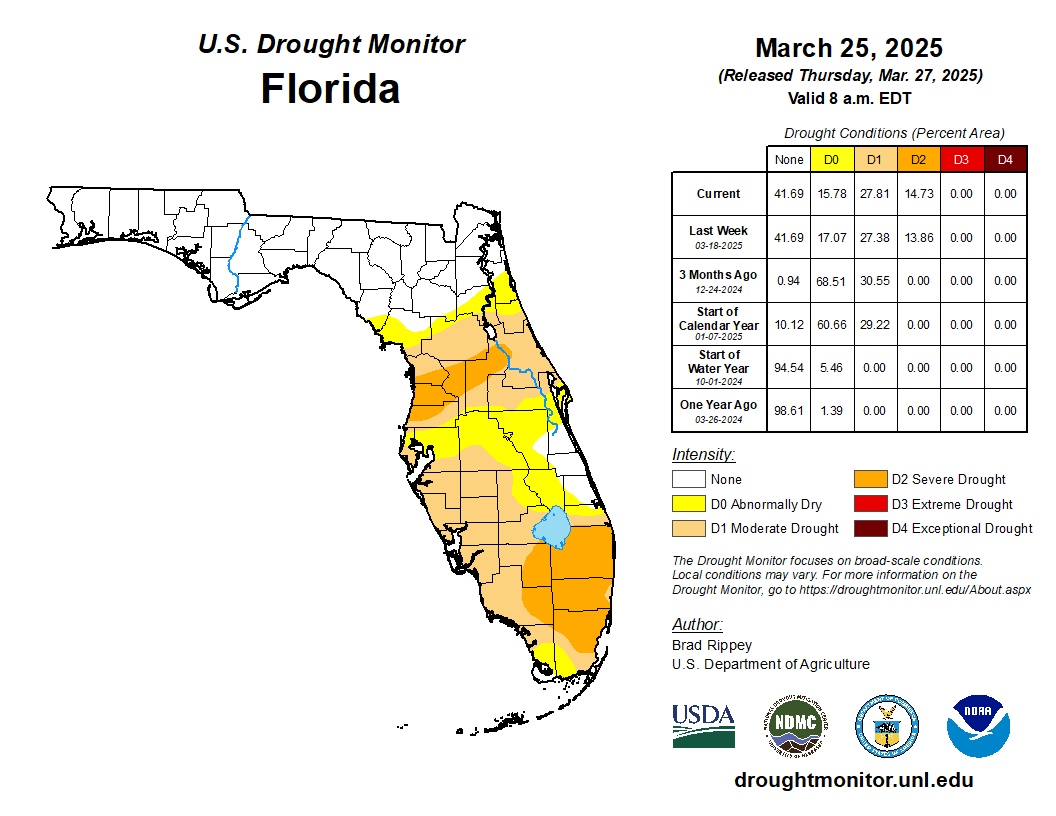
- By the end of March, approximately 15% of the state was in severe drought (D2), 28% was in moderate drought (D1), and 16% of the state was abnormally dry (D0), according to the U.S. Drought Monitor.
- ENSO-neutral conditions are favored to develop in the next month and persist through the Northern Hemisphere summer with a 62% chance in June-August 2025.
Average monthly temperatures in March were near to above normal in Florida. Average monthly temperature departures from normal ranged from -0.5 ̊F in Key West to +1.3 ̊F in Gainesville for the month (see Table 1 and Appendix 1 for select cities). Summer-like temperatures approaching or reaching 90 ̊F arrived this month, with well above normal mean temperatures by the end of the month. There were no reports of frost in March across most of the state, except for isolated locations in the western Panhandle, and a frost is unlikely after March 31st climatologically. No monthly temperature records were set this month. Select daily high maximum temperature records tied or broken during the month are provided in Appendix 2.
Table 1. March average temperatures and departures from normal ( ̊F) for selected cities.
| Station | Mean Temperature | Departure from Normal |
| Pensacola | 63.0 | +0.7 |
| Tallahassee | 62.5 | +1.1 |
| Jacksonville | 63.0 | +0.6 |
| Orlando | 68.5 | +1.2 |
| Tampa | 69.7 | +1.1 |
| Miami | 73.0 | -0.1 |
| Key West | 73.9 | -0.5 |
Monthly precipitation totals in March were generally below normal in the Peninsula and above normal across northern Florida and the Keys. The monthly precipitation departures from normal ranged from -2.27 inches in Sarasota to +4.41 inches in Pensacola (see Table 2 and Appendix 1 for select locations). This past winter saw drier than average conditions in the Panhandle with drying conditions developing in the Peninsula in late winter and early spring, indicative of the current La Niña. During March, Southeast Florida was drier than average with the expansion of severe drought (D2). Many stations in Southeast Florida are experiencing one of their top 10 driest periods since the start of the year, including Miami, Fort Lauderdale, and Naples. Heavy rainfall also impacted much of the state during the month. Key West set a new daily rainfall record with 3.73” on March 29. Pensacola recorded a 1-hour rainfall total of 4.19” on March 30, which was their 2nd-highest hourly rainfall total on record; the daily total of 6.09” set a new daily record for that day and represents 63% of the month's total rainfall. Select daily record precipitation totals tied or broken during the month are provided below in Appendix 3.
Table 2. March precipitation totals and departures from normal (inches) for selected cities.
| Station | Total Rainfall | Departure from Normal |
| Pensacola | 9.66 | +4.41 |
| Tallahassee | 6.26 | +1.02 |
| Jacksonville | 4.80 | +1.51 |
| Orlando | 0.79 | -2.24 |
| Tampa | 0.98 | -1.54 |
| Miami | 1.59 | -0.87 |
| Key West | 3.79 | +2.26 |
Figure 1. A graphical depiction of the monthly rainfall departure from normal (inches) for March (courtesy of NOAA, NWS).
La Niña Advisory.
La Niña conditions continued in the tropical equatorial Pacific Ocean over the past month; however, below-average sea surface temperatures (SSTs) weakened in the central and east-central equatorial Pacific Ocean. Near-to-below average SST values lingered in the Niño-3.4 and Niño-4 regions. ENSO-neutral conditions are favored to develop in the next month and persist through the Northern Hemisphere summer (62% chance in June-August 2025).
Hazardous Weather Events in March.
According to the Local Storm Reports issued by the local National Weather Service offices serving Florida, there were 328 individual local reports of hazardous weather events recorded across the state during the month of March (see Table 3 for a breakdown by event type). Wildfires affected the state during the month. The “344 Fire” in southern Miami-Dade County burned over 26,000 acres and was partially contained as of March 25 and is now fully contained. The wildfire closed roadways and damaged power lines and several communication towers in southeastern portions of the county. Wildfires have led to poor air quality throughout Florida, including from both wild and prescribed burns. Severe weather impacted the state this month. Thunderstorms with reports of hail and heavy rainfall occurred throughout the month. One EF-1 tornado was confirmed in northern Florida (Columbia Co.) during a larger tornado outbreak in the Southeast U.S. from March 14-17 which spawned around 110 confirmed tornadoes regionwide. Several other small tornadoes were reported during the month. No injuries or fatalities were reported in Florida.
Table 3. Breakdown of storm reports submitted in Florida during the month of March (compiled from Iowa State University/Iowa Environmental Mesonet).
| Report Type | Number of Reports |
| Heavy Rain | 74 |
| Flash Flood | 4 |
| Flood | 3 |
| Hail | 18 |
| Marine Thunderstorm Wind | 28 |
| Non-Thunderstorm Wind Gust | 82 |
| Tornado/Waterspout/Funnel Cloud | 4 / 5 / 3 |
| Thunderstorm Wind Damage | 37 |
| Non-Thunderstorm Wind Damage | 1 |
| Thunderstorm Wind Gust | 61 |
| Wildfire | 8 |
Daily Record Events in March.
Table 4. Summary of daily records broken or set in Florida in March (source: NCEI Daily Weather Records).
| Category | Number of Records |
| Highest daily max. temp. | 9 |
| Highest daily min. temp. | 20 |
| Lowest daily max. temp. | 1 |
| Lowest daily min. temp. | 5 |
| Highest daily precipitation | 17 |
| Total | 52 |
Drought-Related Impacts.
Drought persisted in much of the Peninsula during the month. In mid-March, roughly 14% of the state was in severe drought (D2), 27% of the state was in moderate drought (D1), and 17% was abnormally dry (D0), according to the U.S. Drought Monitor. By the end of the month, approximately 15% of the state was in severe drought (D2), 28% was in moderate drought (D1), and 16% of the state was abnormally dry (D0) (Figure 2 below).
As of March 31, the Lake Okeechobee water level was 12.55 ft. above sea level (Feet-NGVD29), which is below average for this time of year. At the first of the month, the water level was 13.74 ft. above sea level.
Figure 3. A graphical depiction of the latest drought conditions in Florida according to the U.S. Drought Monitor (courtesy of the National Drought Mitigation Center, University of Nebraska-Lincoln).
Agriculture-Related Impacts.
The warm temperatures and variable rain showers improved cover crops and winter grazing, while spring planting began for crops like corn, melons, and vegetables. Other producers made preparations for planting in April. Near the end of the month, some prepared land for peanuts and cotton. Sugarcane harvest continued through March and rice planting progressed. Pasture conditions improved with warm temperatures and more frequent rainfall. Cattle conditions were mostly good. For more information, consult the Crop Progress State Stories, which is published by the USDA’s National Agricultural Statistics Service December through March.
Appendix 1
Additional March departures from normal data for select Florida locations (Source: NWS).
| Station | Average Temperature (˚F) | Departure from Normal (˚F) | Total Rainfall (in.) | Departure from Normal (in.) |
| Gainesville | 64.0 | +1.3 | 5.76 | +2.27 |
| Sarasota | 68.7 | +0.6 | 0.58 | -2.27 |
| Melbourne | 68.0 | +0.6 | 1.56 | -1.13 |
| Fort Myers | 70.7 | +0.4 | 0.61 | -1.46 |
| West Palm Beach | 71.6 | +0.5 | 1.49 | -1.82 |
Appendix 2
Select daily record high maximum temperatures (°F) tied or broken during March 2025 (compiled from NOAA).
| Location | Date | Record (˚F) | Broken/Tied | Last |
| Miami | 10 | 89 | Tied | 89 in 1964 |
| Fort Lauderdale | 11 | 90 | Broken | 87 in 2024 |
| Tampa Bay | 15 | 90 | Broken | 88 in 2012 |
| Apalachicola | 26 | 85 | Broken | 82 in 2012 |
| Homestead | 26 | 90 | Broken | 89 in 2016 |
| Pensacola | 26 | 81 | Broken | 80 in 2023 |
| Key West | 27 | 87 | Broken | 86 in 2020 |
| Bradenton | 30 | 89 | Tied | 89 in 2020 |
| Kissimmee | 31 | 90 | Broken | 89 in 2021 |
| Tampa Bay | 31 | 88 | Broken | 87 in 2023 |
| Lakeland | 31 | 91 | Tied | 91 in 2021 |
Appendix 3.
Select daily record precipitation totals (in inches) tied or broken during March 2025 (compiled from NOAA).
| Location | Date | Record (in) | Broken/Tied | Last |
| Niceville | 9 | 1.70 | Broken | 1.60 in 1976 |
| Tallahassee | 9 | 4.25 | Broken | 2.75 in 1948 |
| Fernandina Beach | 10 | 2.00 | Broken | 1.42 in 1909 |
| Jacksonville Beach | 10 | 2.49 | Broken | 2.05 in 1980 |
| Quincy | 10 | 3.80 | Broken | 1.91 in 2011 |
| Key West | 29 | 3.73 | Broken | 0.37 in 1966 |
| Pensacola | 30 | 6.09 | Broken | 3.50 in 1996 |
| Fort Lauderdale | 31 | 2.30 | Broken | 1.98 in 2016 |
| Hialeah | 31 | 2.30 | Broken | 0.94 in 1958 |
| Usher Tower | 31 | 4.10 | Broken | 2.87 in 1972 |
| Miami Beach | 31 | 7.25 | Broken | 1.42 in 1994 |