Prepared by Lydia Stefanova, Daniel J. Brouillette, and David F. Zierden.
Florida Climate Center
The Florida State University
Tallahassee, FL

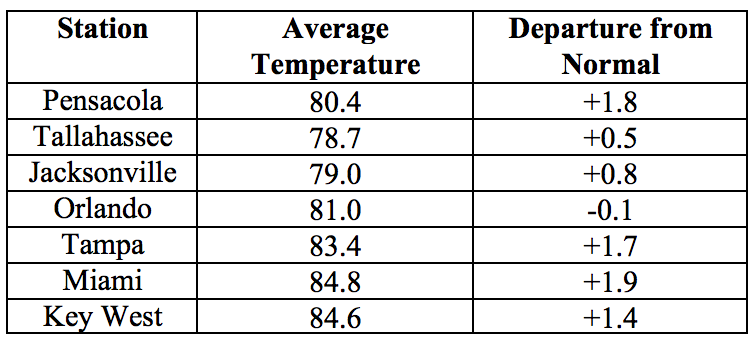
Average temperatures in September were above normal for most of the state. The departures from average temperatures in September 2017 were above normal across most of the state, ranging from -0.1˚F in Orlando to +1.9˚F in Miami (Table 1 and Appendix 1). September 2017 was the warmest on record for Miami (for a third month in a row), 2nd warmest for Tampa and West Palm Beach, 5th for Fort Myers, and 11th for Key West. Several temperature records were tied or broken across the state (Appendix 2).
Table 1: September average temperatures and departures from normal (˚F) for selected cities.
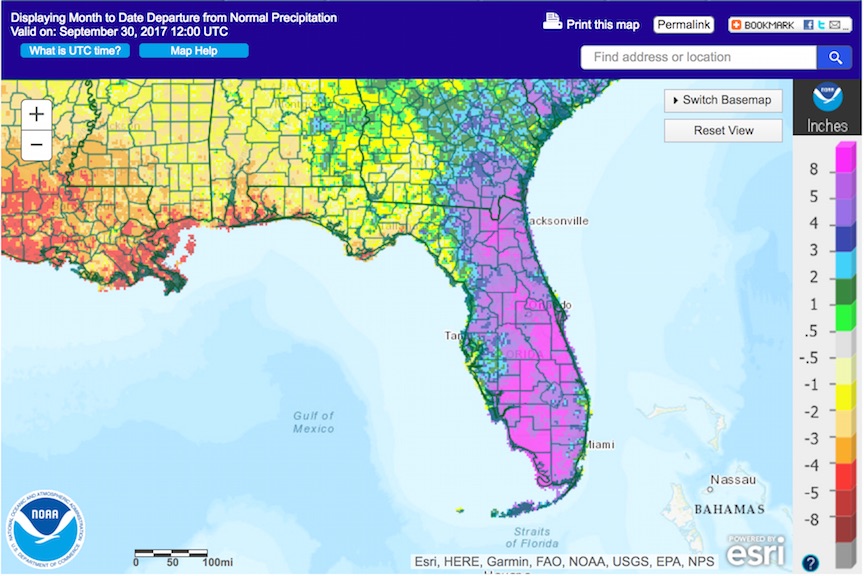
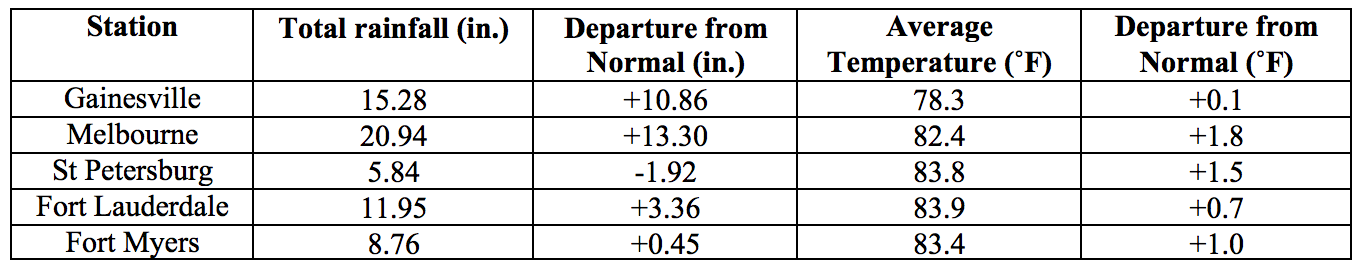
Rainfall totals in September were mixed across the state. Rainfall totals in September 2017 were below normal in most parts of the Panhandle and above normal in the majority of peninsular Florida and the Florida Keys (Figure 1). Departures from normal ranged from -1.92” in St. Petersburg to +8.03” in Orlando (Table 2 and Appendix 1), although localized parts of the state saw rainfall totals that were as much as 15” or more above normal (Figure 1). Overall, September 2017 was the 3rd wettest on record for Gainesville, and 4th wettest for Orlando. Several 24-hour precipitation records broken for the month (Table 3). In addition, Gainesville reported a record 2-day rainfall total of 12.40” from Hurricane Irma between the 10th and 11th, which broke the old records of 11.81” from Hurricane Four in 1894 and 10.42” from Tropical Storm Debby in 2012.
Table 2: September precipitation totals and departures from normal (inches) for select cities.
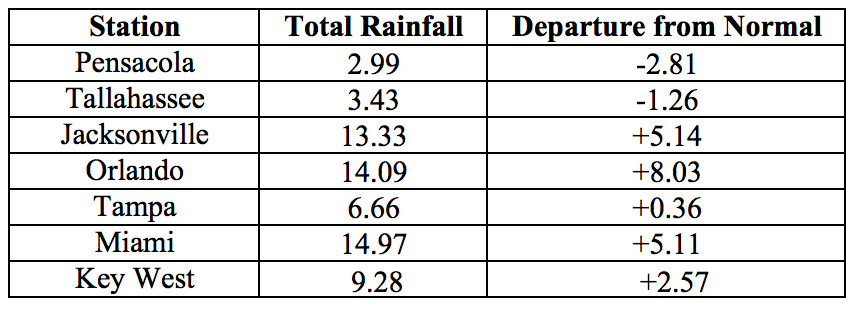
Table 3: Select daily rainfall records (inches) broken during September. (Compiled from NOAA, NWS).
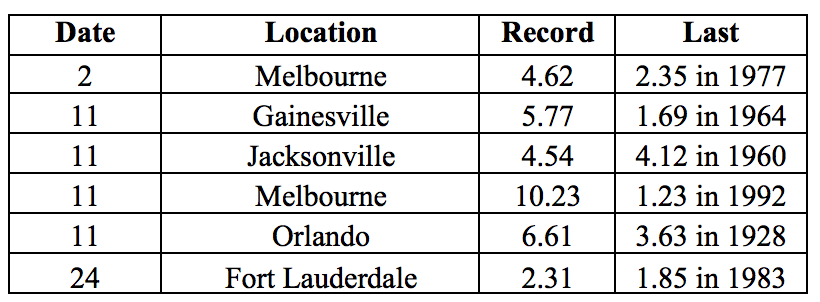
Figure 1: A graphical depiction of the monthly rainfall departure from normal (inches) for September is given in the figure below (courtesy of NOAA, NWS)
ENSO-Neutral Conditions are Present in the Pacific.
Based on current data and forecast models, the Climate Prediction Center (CPC) the ENSO alert system status is set to La Niña Watch. ENSO-neutral conditions are currently present, with sea surface temperatures (SST) near- to below-average across the central and eastern Pacific Ocean. Forecast models increasingly favor the development of La Niña conditions during the fall and winter of 2017-2018. Taking into account the ENSO forecast and long-term trends, the CPC seasonal outlook favors above-normal temperatures and below-normal precipitation for Florida through November 2017.
Hazardous Weather Events in September.
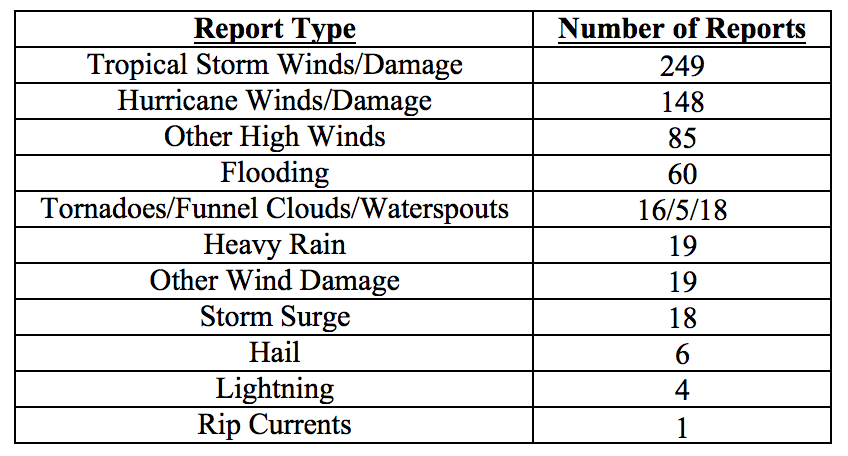
There were a total of 648 hazardous weather events recorded in the National Weather Service Local Storm Reports database for September 2017 (see Table 4 for breakdown by type).
The overwhelming majority of these reports (about 85%) were associated with the approach and passage of Hurricane Irma, between September 9th and 11th. Major Hurricane Irma made three separate landfalls on Florida. The first occurred at Cudjoe Key (Monroe County in the lower Keys), on 10 September at 9:10 AM EDT, with 130 mph maximum sustained winds (Category 4). This landfall was the first of a major hurricane on Florida since Hurricane Wilma made landfall at Cape Romano (Collier County) on 24 October 2005. The second Irma landfall was later that same day at 3:35 PM EDT at Marco Island (Collier County), with 115 mph maximum sustained winds (Category 3). The third was one-half hour later at Naples, with 115 mph maximum sustained winds. Irma’s center then moved inland about 25 miles, weakening to Category 2 strength, before moving in a generally north-northwest direction. As it passed just east of Tampa on the night of the 10th, the storm maintained Category 1 strength. By the time the center reached the Big Bend region around dawn on the 11th, Irma had weakened to tropical-storm strength. By the afternoon of the 11th, the center had exited the state into Georgia. Commensurate with its strength, Irma produced considerable property damage; it is still much too early to provide an estimate of the monetary value of the damage. This damage was seen throughout most of the peninsula but was severe in areas in the southwest and devastating in portions of the Keys. At the peak of the storm, 60 percent of electric power customers statewide had no service. Much of the damage resulted from strong winds. Hurricane-force wind gusts were registered as far north as the First Coast. The highest wind gust that was recorded in the state was 142 mph at Naples Airport on the 10th. However, it should be noted that station-level peak wind-gust readings are often missed during storms of this magnitude because of instrument failure. Damage also resulted from storm-surge flooding along the Keys and the eastern coast. In fact, storm surge reached a record level at Jacksonville, eclipsing the level seen during Hurricane Dora in 1964. By contrast, a large expanse of negative storm surge was seen along much of the western coast. Rainfall was seen throughout all the state except the extreme western panhandle. The greatest rainfall totals, 15-25”, were observed in the extreme south of the peninsula and in the upper and middle Keys. Throughout the remainder of the peninsula, 11-15” of rain were common along and east of the path of the storm center. Totals tapered gradually with westward distance from that path. Major to record flooding occurred on many streams, ostensibly because of the storm’s wide expanse. Seventeen tornadoes have been confirmed in Florida on account of Irma. All of these occurred east of the center path and were most numerous from the middle of the peninsula northward. At this time, it is believed that seventy-two persons perished in Florida as a result of Irma, mainly by drowning.
Table 4: Breakdown of storm reports submitted in Florida during the month of September (Compiled from Iowa State University/Iowa Environmental Mesonet.)
Drought-Related Impacts.
At the end of August, a small area of abnormally dry (D0) conditions had appeared over the northern portions of Gadsden and Leon Counties, affecting about half of a percent of the state’s area. By the first week of September the D0 conditions were eliminated and the entire state became drought-free, and remained drought-free for the rest of the month.
At the end of the month, Lake Okeechobee water levels were at 16.43 ft., which is well above average for this time of the year. The US Army Corps of Engineers, which is responsible for managing of Lake Okeechobee flows, has been doing regular dam safety inspections and releasing as much water as possible while trying to ensure there is no flooding downstream. These needed discharges from the lake have resulted in a large plume of turbid nutrient-rich fresh water entering the Gulf and are causing some concern about hypoxia and potential for algal blooms.
Agriculture-Related Impacts.
Throughout the month soil moisture were at mostly adequate to surplus levels, with the proportion of surplus values increasing following the passage of Irma.
Hurricane Irma passed on the western side of the citrus growing area, bringing heavy winds and excessive precipitation to the entire region. Normal grove operations were suspended for a number of days in the aftermath, as groves and access roads were flooded or washed out. Growers were pumping standing water out of groves, attempting to get canals and ditches back to normal levels, repairing potholes, and surveying grove and fruit damage.
Fall vegetable growers delayed planting in advance of Irma. In fields that had already been planted, significant losses were reported in Bradford, Collier, Glades, Hendry, Hillsborough, Lee, and Saint Lucie Counties. Losses affected plantings of strawberries, peppers, okra, cabbage, collards and peas, as well as laid plastic. In the following weeks, growers were pumping water out of flooded areas, laying new plastic and replanting crops that were destroyed.
Pasture and cattle conditions across the state have been mostly in good condition, although many pastures were flooded. Herds were reported very thin in Brevard and Indian River Counties. Some milk losses were reported in Lafayette County due to power outages. A large herd in St. Lucie County was reported standing in knee-deep water, and had to be moved to higher ground. In multiple counties there is still standing water reported in low-lying pastures, and mosquito populations have increased significantly.
Peanut and hay producers stepped up harvesting as much as possible in the few days ahead of the hurricane. Significant damage to cotton has been reported in Jackson, Holmes, Lafayette, and Madison Counties. Damage to peanuts was reported in Dixie, Gilchrist, Jackson and Levy Counties, and to corn – in Columbia County. Extended delays in peanut harvest due to excess moisture are being reported in Dixie, Gilchrist, Holmes, Jackson, Lafayette, and Levy Counties. Almost all sugarcane was flooded and blown down in Glades, Hendry and Palm Beach Counties, but is beginning to stand up.
Appendix 1: Additional September departures from normal data for Florida locations.
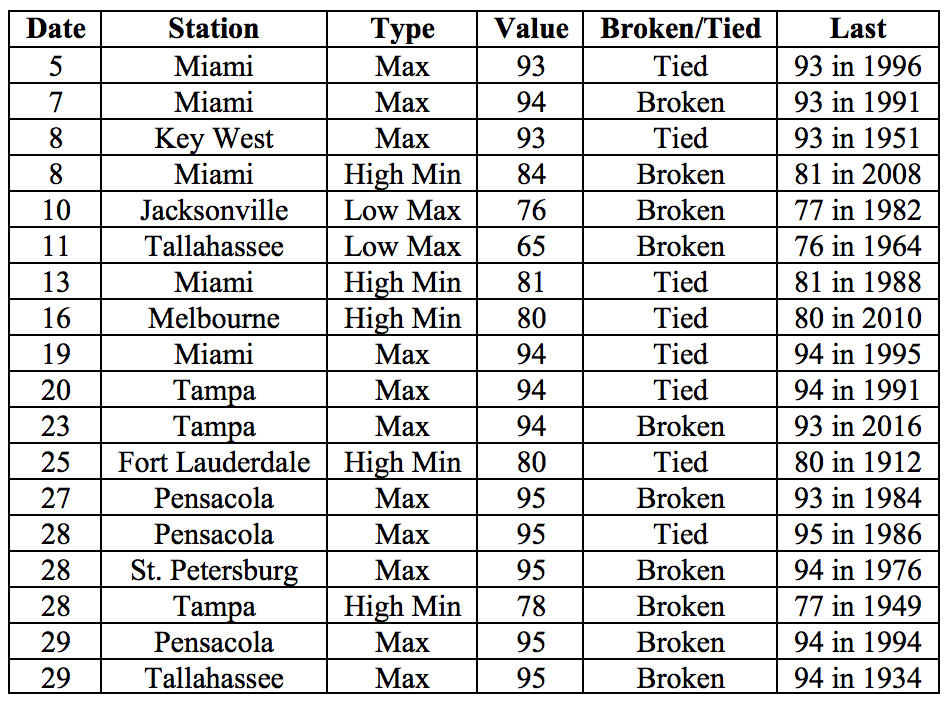
Appendix 2: Select daily maximum and minimum temperature records (° F) broken during September (compiled from NOAA, NWS).