
Prepared by Daniel J. Brouillette
Florida Climate Center
The Florida State University
Tallahassee, FL

Mean temperatures in October were much above normal statewide (Table 1 and Appendix 1). October 2018 was the warmest on record at Tampa and Key West (the second consecutive at both locations), as well as other less major stations, and in the top five warmest on record at several other stations. Several high temperature records were tied or broken across the state (Appendix 2).
Table 1. October average temperatures and departures from normal (˚F) for selected cities.
| Station | Mean Temperature | Departure from Normal |
| Pensacola | 74.8 | +5.2 |
| Tallahassee | 74.0 | +4.6 |
| Jacksonville | 74.2 | +3.7 |
| Orlando | 78.1 | +2.6 |
| Tampa | 80.0 | +3.9 |
| Miami | 81.3 | +1.5 |
| Key West | 83.6 | +3.3 |
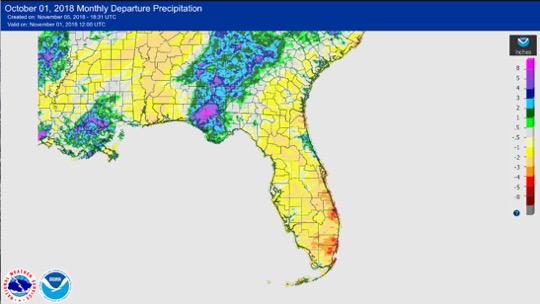
Rainfall totals in October were below normal except in the central and eastern panhandle (Figure 1). Rainfall was somewhat above normal in the central and eastern panhandle owing to Hurricane Michael on the 10th of the month. 24-hour precipitation records were broken for the month (Table 3).
Table 2. October precipitation totals and departures from normal (inches) for selected cities.
| Station | Total Rainfall | Departure from Normal |
| Pensacola | 3.75 | -1.49 |
| Tallahassee | 3.90 | +0.67 |
| Jacksonville | 1.30 | -2.63 |
| Orlando | 2.05 | -1.07 |
| Tampa | 1.42 | -0.84 |
| Miami | 1.76 | -4.57 |
| Key West | 3.19 | -1.74 |
Table 3. Select daily rainfall records (inches) broken during October. (Compiled from NOAA, NWS)
Figure 1. A graphical depiction of the monthly rainfall departure from normal (inches) for October is given in the figure below (courtesy of NOAA, NWS).
ENSO-neutral conditions are present in the Pacific, with El Niño favored to develop.
Based on current data and forecast models, forecasters with the Climate Prediction Center (CPC) continue with an El Niño Watch. ENSO-neutral conditions currently are present, with sea-surface temperatures (SST) above average across the equatorial Pacific Ocean. El Niño development is favored by the end of the climatological boreal autumn (from now through the end of November), and the chance of development is 70-75% during the climatological boreal winter (December-January-February). The CPC seasonal outlook favors above-normal temperatures and above-normal precipitation statewide through November 2018.
Hazardous Weather Events in October.
According the Local Storm Reports (LSRs) issued by the local National Weather Service (NWS) offices serving Florida, nnn instances of hazardous weather were reported across the state in October 2018. Of special interest was Hurricane Michael, which made landfall on the 10th as a high-end Category 4 storm near Mexico Beach and was the third-strongest storm ever to landfall on the United States in terms of minimum central pressure.
Table 4. Breakdown of storm reports submitted in Florida during the month of October. (Compiled from Iowa State University/Iowa Environmental Mesonet.)
| Report Type | Number of Reports |
| Storm Damage | 1 (excluding hurricane) |
| High Winds | 30 |
| Dense Fog | 0 |
| Hail | 0 |
| Tornadoes/Funnel Clouds/Waterspouts | 16 |
| Heavy Rain | 24 |
| Fire | 0 |
| Flooding | 0 (excluding storm surge/coastal) |
| Lightning | 0 |
| Heat | 0 |
| Coastal Hazards/Rip Currents | 1 |
Drought-Related Impacts
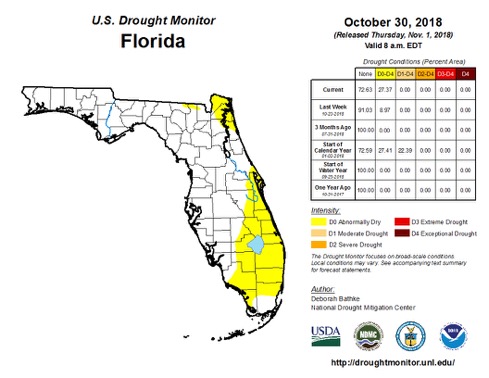
At the end of October, according to the U.S. Drought Monitor, abnormally dry conditions were present in a large area from the Space Coast, south along the coast to near Miami and southwest from there, as well as in northeast Florida in the Jacksonville area.
As of 5 November, the Lake Okeechobee water level was at 13.65 ft. above sea level, which is near average for this time of the year.
Agriculture-Related Impacts.
At the end of October, topsoil-moisture levels were at surplus or adequate over two-thirds of the state, with the remaining third very short or short. Citrus harvest got underway this month; the early harvest has looked good, according to reports, and groves and trees also look to be in good condition. By the end of the month, the irrigation of crop vegetables was required because of dry conditions developing. Cattle conditions remained good as of the end of the month. Hurricane Michael decimated the cotton crop, especially those plants that were already defoliated prior to the storm, with 10-90% crop loss depending on the county. Peanuts on the panhandle suffered significant losses; late-season yields were halved.
At the end of the month, two-thirds of the state had topsoil that were adequate or excess in terms of moisture, with the balance of the state short or very short.
Appendix 1
Additional September Departures from Normal Data for Florida Locations
| Station | Total rainfall (in.) | Departure from Normal (in.) | Average Temperature (˚F) | Departure from Normal (˚F) |
| Gainesville | 0.61 | -2.27 | 74.6 | +3.7 |
| Melbourne | 1.27 | -3.79 | 80.3 | +4.3 |
| Fort Lauderdale | 1.65 | -4.59 | 81.2 | +2.3 |
| Fort Myers | 0.78 | -2.01 | 79.5 | +1.6 |
Appendix 2
Select daily maximum and minimum temperature records (oF) tied or broken during September.
(Compiled from NOAA, NWS)
| Date | Station | Type | Value | Broken/Tied | Last |
| 15 | Tallahassee | Max | 91 | Broken | 90 in 1990 |
| 17 | Tallahassee | Max | 90 | Tied | 90 in 1972 |
| 20 | Tallahassee | Max | 90 | Tied | 90 in 2005 |
| 10 | Jacksonville | Min | 79* | Broken | 76 in 1919 |
| 15 | Jacksonville | Max | 91 | Broken | 90 in 1990 |
| 16 | Jacksonville | Max | 91 | Broken | 92 in 2017 |
| 17 | Jacksonville | Max | 94 | Broken | 91 in 1989 |
| 17 | Jacksonville | Min | 75 | Tied | 75 in 1879 |
| 20 | Jacksonville | Max | 90 | Broken | 89 in 2006 |
| 10 | Orlando | Min | 77 | Broken | 75 in 2017 |
| 15 | Orlando | Min | 74 | Tied | 74 in 2009 |
| 19 | Orlando | Min | 73 | Tied | 73 in 1950 |
| 4 | Tampa | Max | 92 | Tied | 92 in 2007 |
| 15 | Tampa | Max | 92 | Tied | 92 in 1990 |
| 16 | Tampa | Max | 93 | Broken | 92 in 1959 |
| 18 | Tampa | Max | 92 | Broken | 90 in 1989 |
| 19 | Tampa | Max | 89 | Tied | 89 in 2017 |
| 16 | Miami | Min | 80 | Broken | 79 in 1933 |
| 21 | Miami | Max | 91 | Broken | 89 in 2006 |
| 4 | Key West | Min | 82 | Tied | 82 in 2013 |
| 12 | Key West | Min | 81 | Tied | 81 in 1941 |
| 15 | Key West | Min | 82 | Tied | 82 in 2014 |
| 17 | Key West | Max | 89 | Tied | 89 in 2009 |
| 19 | Key West | Min | 82 | Broken | 80 in 2004 |
| 21 | Key West | Max | 89 | Tied | 89 in 2007 |
| 24 | Key West | Max | 89 | Tied | 89 in 1990 |
| 25 | Key West | Min | 80 | Broken | 79 in 2010 |
| 26 | Key West | Min | 81 | Broken | 80 in 2015 |
| 27 | Key West | Min | 80 | Tied | 80 in 2003 |
*This value breaks the all-time highest minimum temperature ever recorded at Jacksonville for the month of October (records back to 1871); the previous record was 78 degrees, last set on 4 October 1964.