Prepared by Melissa Griffin, Preston Leftwich, and David F. Zierden
Florida Climate Center
The Florida State University
Tallahassee, FL
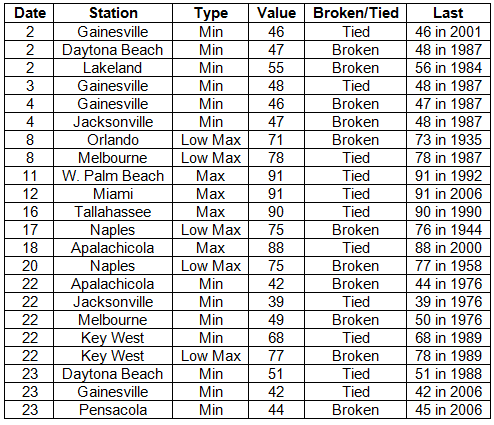
Average temperatures were below normal in October. Average temperatures were below normal across the entire state (Table 1). Departures from normal ranged from -0.9° F at Key West to -3.3° F at Orlando. It was the 2nd coldest October on record at Orlando, and October 2011 was in the top ten coldest Octobers for Pensacola (9th), Tallahassee (8th), and Jacksonville (7th). Cold dry air pushed into the state at the beginning of the month, causing numerous minimum temperature records to be broken or tied in the northeastern portions of the state from the 2nd to the 4th (see Appendix). Record low maximum temperatures on the 8th at Orlando and Melbourne corresponded with record rainfall events at both locations. Another round of cold air slipped into the state toward the end of the month, leading to more records being tied or broken on the 22nd and 23rd.
Table 1: October average temperatures and departures from normal (° F) for selected cities.

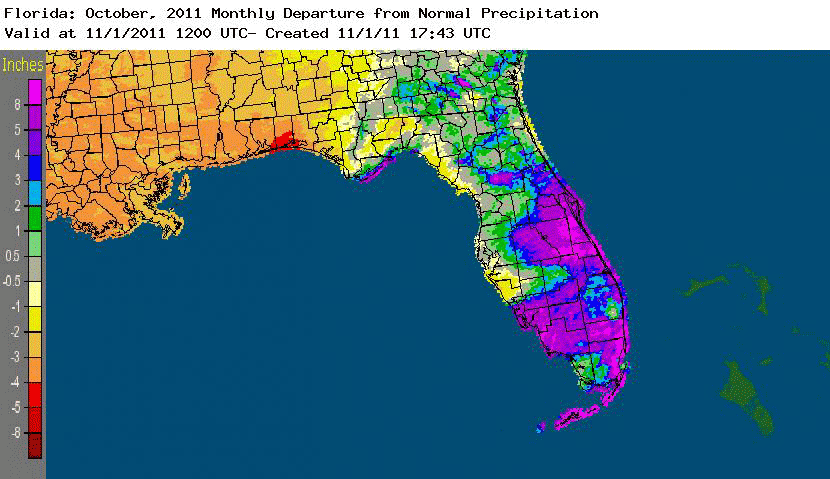
Rainfall totals varied in October. Rainfall totals varied greatly across the state during October (Table 2). In the north, the monthly total at Pensacola (0.24 inches) was five inches below normal, making October 2011 the 8th driest October on record at the station. In contrast, two separate heavy rain events along the southern part of the state helped ease drought conditions and broke many records. The monthly total (17.14 inches) at Key West makes it the 2nd wettest October on record, only behind October 1969 (21.57 inches). Orlando (8.87 inches) and Miami (15.52 inches) saw their 3rd and 5th wettest Octobers on record, respectively. Vero Beach had a daily record rainfall of 8.30 inches on the 8th, which was over double the previous record set in 1983 (Table 2). Apalachicola reported a daily rainfall total of 7.49 on the 18th that was over four times greater than the previous record for that date of 1.73 in 1989. Areal patterns of monthly rainfall relative to normal are depicted in Figure 1.
Table 2: October precipitation totals and departures from normal (inches) for selected cities.
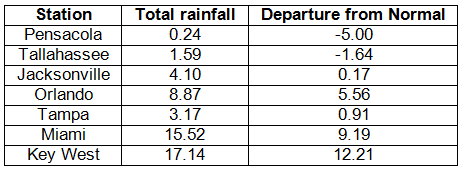
Table 3: Daily rainfall records (inches) broken during October (compiled from NOAA, NWS).
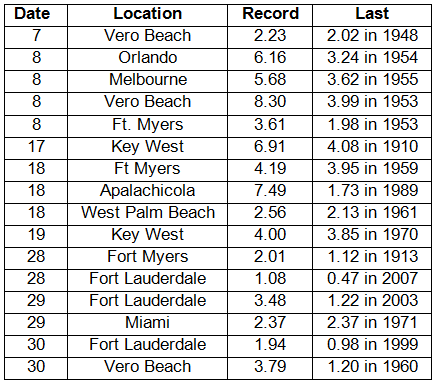
Figure 1: A graphical depiction of the monthly rainfall departure from normal (inches) for October is given in the figure below (courtesy of NOAA, NWS).
La Niña continues during October.La Niña conditions are present across the equatorial Pacific, with sea surface temperatures (SST) at least 0.5?C below average for the region. The atmospheric circulation anomalies and winds are consistent with La Niña. The current La Niña is forecasted to strengthen and continue through the winter of 2011/2012.
The 'Wild Card' will be the Arctic Oscillation (AO), which has the potential to trump the typical La Niña pattern. The AO is always present and fluctuates between positive and negative phases. The negative phase of the AO pushes cold Canadian air into the US, leading to periods of well-below normal temperatures, as it has the last two winters. Strong AO phases typically last a few weeks and are very difficult to predict more than a week or two in advance.
Hazardous weather. Numerous hazardous weather events were reported during the month of October. The beginning of the month started off with waterspouts and wind damage reported along the lower portions of the Florida Keys. High winds associated with a strong cold front caused minor damage as they moved through the state from the 8th through the 10th. A vigorous low-pressure system caused significant heavy rains, flooding, and tornadoes in south Florida from the 16th through the 18th. A tornado (EF-2) was confirmed in the Sunrise/Plantation area on October 18th; about 50 homes were damaged, and about a dozen homes received significant damage. Roofs were blown off two houses, and two trailers were shifted off their foundations. There were other tornadoes reported with the October 18th event in Indian River and Glades Counties. The remains of Hurricane Rina caused flooding, heaving rains, high winds, and a tornado as they moved through the area from the 28th to the 30th. On October 29th, an EF-0 tornado was reported around Hobe Sound, FL, (Martin County), which did some minor damage to some roofs and landscape.
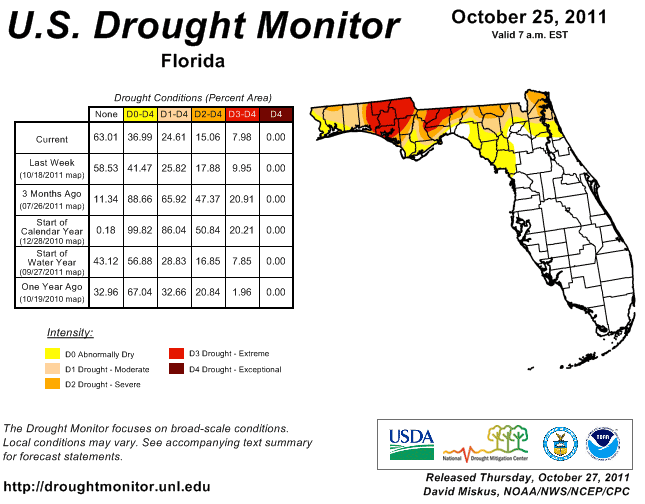
Agricultural and other impacts. The cooler and drier weather has helped facilitate the harvest of peanuts, cotton, and a variety of other crops across portions of the state. However, drought conditions continue to persist in northern portions of the state, with extreme drought conditions present around Leon and Gadsden Counties and the Choctawhatchee River basin. Heavy rains in the second half of October eased some of the dry conditions that had been lingering around Lake Okeechobee. The average lake level is 13.55 ft, which is down from the historic average of 15.03 ft but a significant change from the 11.13 ft that was reported a month ago.
Appendix: Daily maximum and minimum temperature records (° F) tied or broken during October (compiled from NOAA, NWS).
