Prepared by Melissa Griffin, Preston Leftwich, and David F. Zierden
Florida Climate Center
The Florida State University
Tallahassee, FL

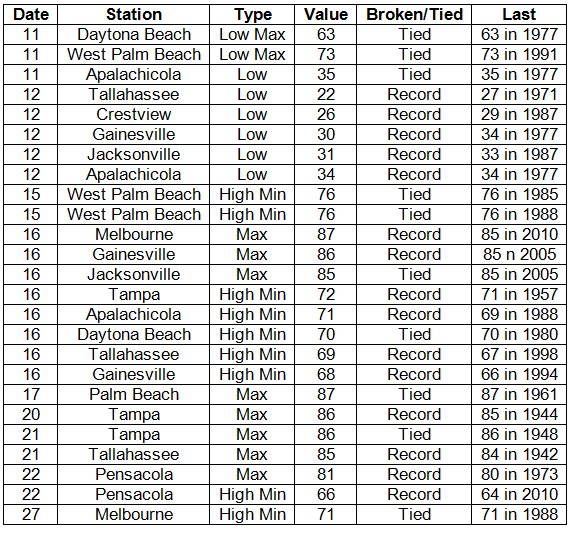
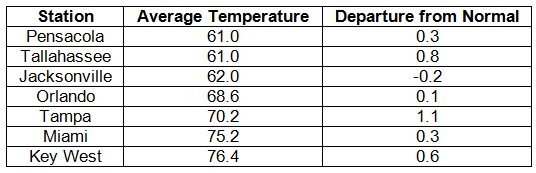
Average temperatures were near normal in November. Average temperatures were near normal across the entire state (Table 1). Departures from normal ranged from -0.2° F at Jacksonville to 1.1° F at Tampa. An extremely cold dry air mass pushed into northern parts the state at the beginning of the month, causing numerous minimum temperature records to be broken or tied from the 11th to the 12th (Appendix). The minimum temperature at High Springs, FL on the morning of the 11th was 20° F. Because of this cold snap, some of the National Weather Service's offices in the northern part of the state have suspended issuance of Frost Advisories until March 1st. After the strong cold front pushed through the state, temperatures rebounded and tied and broke maximum records in a few locations from the 15th to the 17th. Temperatures were slightly warmer than normal ahead of another strong cold front prior to Thanksgiving.
Table 1: November average temperatures and departures from normal (° F) for selected cities.
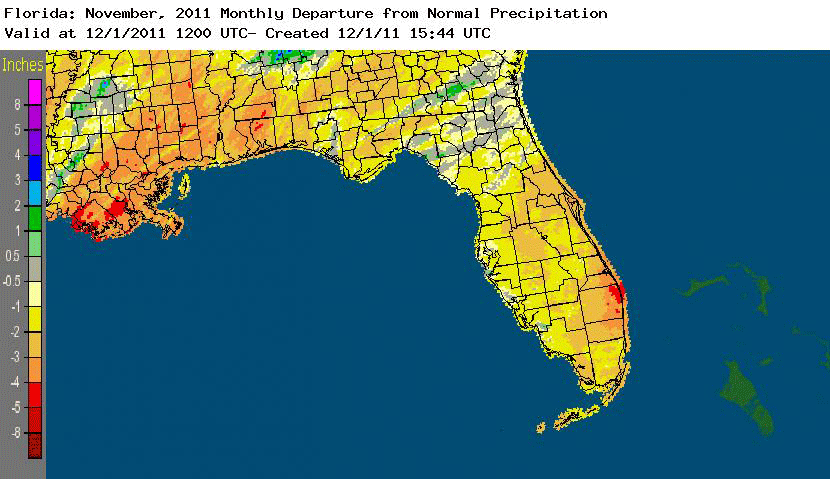
Rainfall totals were below normal statewide in November. Rainfall totals were below normal statewide in November (Table 2). The month was the 4th driest on record at Orlando and the 10th driest on record at Key West. The passage of cold fronts through the northern portions of the state were the main source of precipitation for November, though the totals that amounted from each passage were still not enough to impact the lingering drought. Areal patterns of monthly rainfall relative to normal are depicted in Figure 1.
Table 2: November precipitation totals and departures from normal (inches) for selected cities.
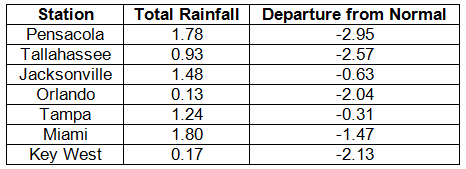
Figure 1: A graphical depiction of the monthly rainfall departure from normal (inches) for November is given in the figure below (courtesy of NOAA, NWS).
La Niña continues during November. La Niña conditions continue to be present across the equatorial Pacific, with sea surface temperatures (SST) at least 0.5?C below average for the region. The atmospheric circulation anomalies and winds are consistent with La Niña. The current La Niña is forecasted to strengthen and continue through the winter of 2011/2012. The Climate Prediction Center has predicted warmer than normal temperatures and below normal precipitation during this La Niña. However, the 'Wild Card' will be the Arctic Oscillation (AO), which has the potential to trump the typical La Niña pattern. The AO is always present and fluctuates between positive and negative phases. The negative phase of the AO pushes cold Canadian air into the US, leading to periods of well-below normal temperatures, as it has the last two winters. Strong AO phases typically last a few weeks and are very difficult to predict more than a week or two in advance.
Hazardous weather. The only severe weather report for the month came out of Hamilton County as a line of strong storms moved through portions of southern Alabama and Georgia on the 16th. Numerous trees were reportedly knocked over, there was some minor damage done to a shed, and shingles were pulled from a roof.
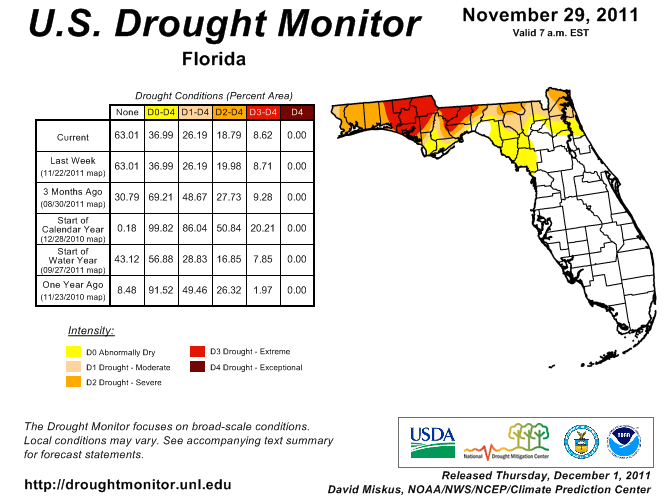
Agricultural and other impacts. The cold snap earlier in the month damaged vegetable crops in portions of the Florida Panhandle, while warmer temperatures and precipitation caused disease issues in St. Lucie County and the agricultural areas to the southwest of Lake Okeechobee. The continued drought limited the amount of small grain forage being planted in the state. Since the October 25 release of the National Drought Monitor, there has been little change to the drought. Extreme drought lingers in the Panhandle, while Escambia, Santa Rosa and Okaloosa Counties have gone from moderate to severe drought. Water restrictions remain in place in South Florida, even though Lake Okeechobee has maintained a water level of 13.84 ft. This is due the forecasted La Niña and decreased chance of precipitation throughout the winter.
Figure 2: Drought conditions in Florida as of November 29, 2011 (courtesy of U.S. Drought Monitor).
Appendix: Daily maximum and minimum temperature records (° F) tied or broken during November (compiled from NOAA, NWS).