Prepared by Melissa Griffin and David F. Zierden.
Florida Climate Center
The Florida State University
Tallahassee, FL

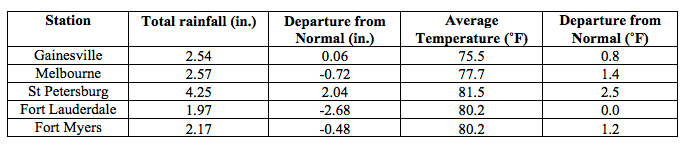
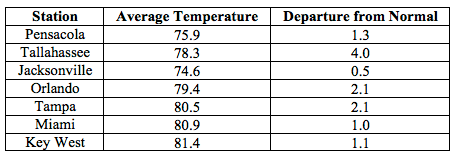
Average temperatures were above normal across most of the state in May. The departures for average temperatures in May 2015 were near normal to above normal across the entire state, ranging from 0.0˚F in Fort Lauderdale to 4.0˚F in Tallahassee (Table 1 and Appendix 1). Most locations across the state reported at least one day with a maximum temperature at or above 90˚F. Tallahassee had a record 4 consecutive days (May 9-12) with maximum temperatures of 95˚F. May 2015 was the 2nd warmest in Tallahassee, 6th warmest in Tampa and Vero Beach, and 8th warmest in Orlando and West Palm Beach. Multiple temperature records were tied or broken across the state in May (Appendix 2).
Table 1: May average temperatures and departures from normal (inches) for select cities.
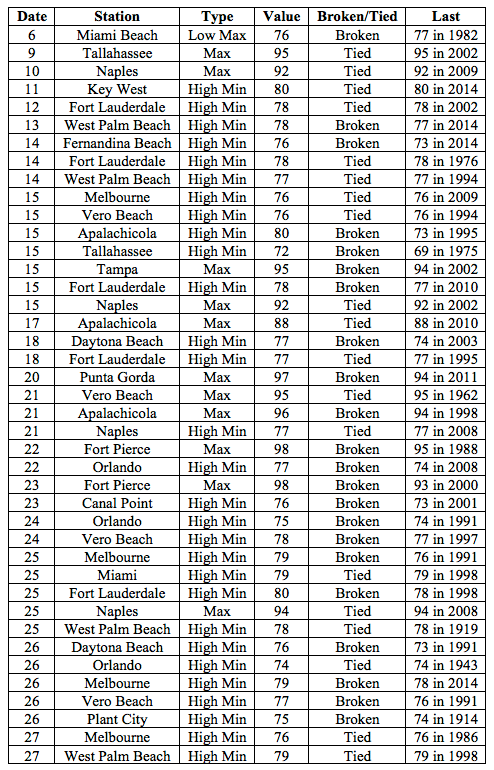
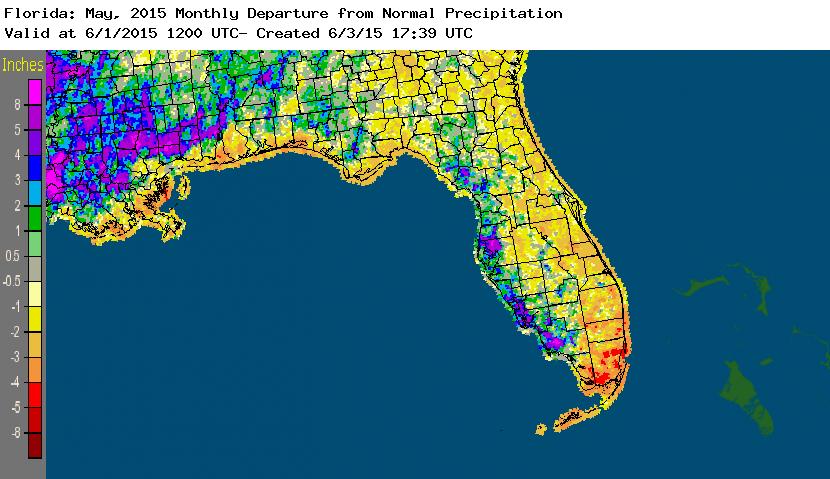
Rainfall totals were varied across the state in May. With the exception of some areas along the Panhandle and West Coast, the majority of the state had rainfall totals below normal (Figure 1). Departures from normal roughly ranged from -2.95” to 4.64” (Table 2 and Appendix 1), though localized parts of Florida saw rainfall totals that were as much as 5.00” below normal to over 8.00” above normal. May 2015 was the 6th driest on record at Vero Beach and the 9th driest in Orlando. There were multiple 24-hour precipitation records broken for the month (Table 3).
Table 2: May precipitation totals and departures from normal (inches) for select cities.
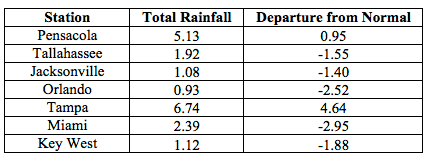
Table 3: Select daily rainfall records (inches) broken during May (compiled from NOAA, NWS).
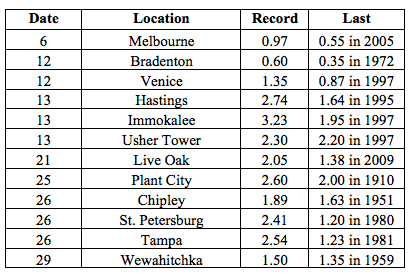
Figure 1: A graphical depiction of the monthly rainfall departure from normal (inches) for May is given in the figure below (courtesy of NOAA, NWS).
ENSO-neutral conditions continue in the Pacific.Based on current data and forecast models, the Climate Prediction Center (CPC) decided to continue the El Niño Advisory. El Niño conditions are present, and positive equatorial sea surface temperatures (SST) anomalies continue across most of the Pacific Ocean. There is an approximately 90% chance that El Niño conditions will continue through summer 2015, and a greater than 80% chance it will last through the remainder of 2015. CPC predicts above normal temperatures and precipitation across the state through August 2015.
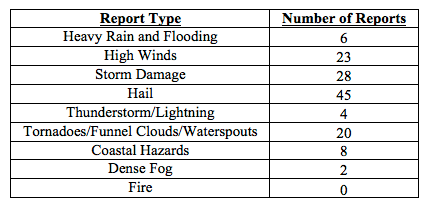
Hazardous weather events in May. There were a total of 136 severe weather reports made in Florida during May. On May 5th, heavy rain was reported in Cocoa Beach, when an observer reported 4.65” of rain within a two-hour period. Thunderstorms produced pea to dime-sized hail in the Miami metro area on the 7th. On the morning of the 8th, dense fog was seen along Alligator Alley with visibilities reduced to 1/8 of a mile. Two construction workers were injured in Bonita Springs, FL (Lee County) when they were struck by lightning during the afternoon of the 13th. On the same day, there were reports of a funnel cloud spotted in the area of Delray Beach, FL. Lightning started a structural fire in Santa Rosa County on the 20th. During Memorial Day Weekend, there were reports of strong rip currents along the east cost of the state. Three fatalities were reported from Jacksonville Beach to Riviera Beach and nearly 500 people had to be rescued along Florida beaches during the holiday weekend. Thunderstorms offshore produced multiple waterspouts along coastal locations of the state during May. One waterspout on the 25th moved onshore in Fort Lauderdale, injuring one adult and three children when it lifted up an inflatable bounce house into the air. Lightning hit a power lines in the Panama City Beach area, resulting in power outages on the 28th. Another weekend of strong rip currents at the end of the month caused the death of two swimmers and additional water rescues along the East Coast. The summer-time convective thunderstorms, that form along sea breezes and from daytime heating, were seen in both the Peninsula and Panhandle during the month. These thunderstorms produced high winds, downed trees and power lines, and hail.
Table 4: Breakdown of storm reports submitted in Florida during May (compiled from Southeast Regional Climate Center).
Agricultural related impacts. At the beginning of May, top soil moisture levels were at 79% adequate across the state. Hay was being cut in the Big Bend and northeast Florida counties. Cotton, corn, and peanut planting increased to field improvement after the above normal rainfall of April. The blueberry and peach harvests across the state had completed for the year, though some U-Pick blueberry growers were still open. Rain in Palm Beach County caused some localized field flooding, causing newly planted seed to be washed away. Pasture conditions across the state improved from the dry conditions and warmer temperatures. Citrus groves were using irrigation, and some of the fruit sizes were behind from last year. By the middle of the month, the lack of rainfall and warm daytime high temperatures were causing stress on some crops in the Big Bend, and southwest vegetable farmers began to heavily irrigate their fields. The harvesting of oats and wheat started in North Florida, while some southern Florida growers cleaned and prepped fields for summer fallow. By the end of May, topsoil moisture levels had dropped to 53% adequate across Florida. Drought conditions were beginning to move into the southern part of the citrus belt (Collier and Hendry counties). The quality of the conditions of pastures and livestock were reduced and overgrazing was reported in numerous locations across the state. Due to the continued dry conditions and warm temperature, heavy use of irrigation was seen across Florida at the beginning of June.
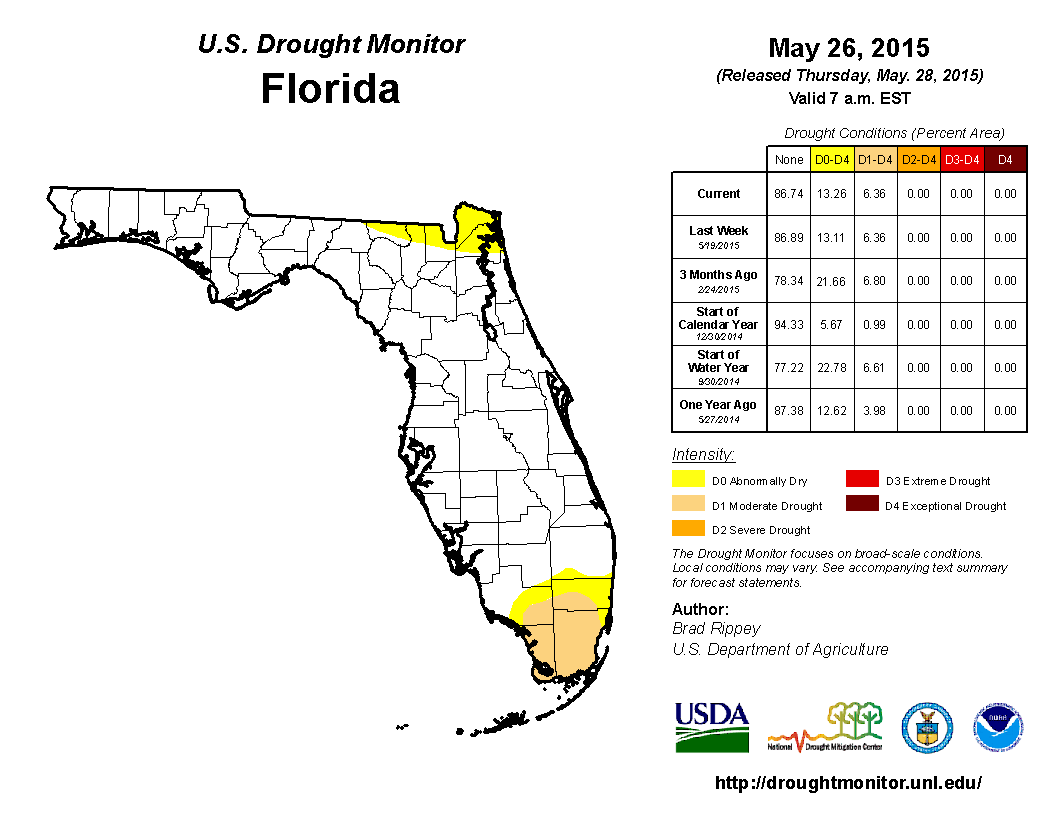
Drought related impacts. At the end of April, nearly 10% of the state was experiencing abnormally dry (D0) conditions, mainly concentrated in portions of southern Florida. After a wet April, precipitation across the state for May was closer to typical rainfall totals. May is a dry month for the state, so while some areas registered below normal rainfall, most of the state remained drought free. Rains at the beginning of the month in South Florida eased the moderate drought (D1) conditions, while the Panhandle experienced dryness (D0) in the northern parts of the counties. By the middle of May, D0 was introduced into Nassau County and the continued lack of rainfall in the southern Peninsula cause the expansion of D1 to Broward, Collier, Dade and Monroe counties. On the May 26th release of the drought monitor, the D0 area in the Panhandle had been removed, though the D0 area in the northeast continues to persist. Based on census data, roughly 3 million Florida citizens are currently being impacted by drought conditions reported in nearly 13% of the state. At the end of the month, the water level in Lake Okeechobee had dropped to under 13 ft., mainly due to regulatory releases.
Figure 2: Drought conditions in Florida as of May 26, 2015 (courtesy of U.S. Drought Monitor).
Appendix 1: Additional May departures from normal data for Florida locations.