
Prepared by Preston Leftwich, David F. Zierden, and Melissa Griffin
Florida Climate Center
The Florida State University
Tallahassee, FL

Average temperatures above normal for May. Monthly average temperatures for May were above normal across the entire state (Table 1). Daily maximum temperature records tied or set during May are in Table 2. The maximum temperature at Sarasota on the 2nd (92° F) broke a record in existence since 1943. The maximum temperature at Apalachicola on the 17th (94° F) tied a record previously set in 1950.
Table 1: May average temperatures and departures from normal (° F) for selected cities.
| Station | Average Temperature | Departure from Normal |
| Pensacola | 76.4 | 1.7 |
| Tallahassee | 77.9 | 3.5 |
| Jacksonville | 77.2 | 3.8 |
| Orlando | 79.1 | 1.9 |
| Tampa | 80.9 | 3.3 |
| Miami | 82.4 | 2.8 |
| Key West | 82.1 | 1.4 |
Table 2: Maximum temperature (° F) records tied or broken during May (compiled from NWS).
| Date | Station | Temperature | Previous Record |
| 2 | Sarasota | 92 | 91 in 1943 |
| 6 | Miami | 93 | 92 in 1955 |
| 8 | Miami | 93 | 92 in 1998 |
| 9 | Miami | 94 | 93 in 1967 |
| 17 | Apalachicola | 88 | ties 1991 |
| 21 | Naples | 93 | ties 2004 |
| 21 | St Petersburg | 94 | 92 in 1977 |
| 27 | Apalachicola | 94 | ties 1950 |
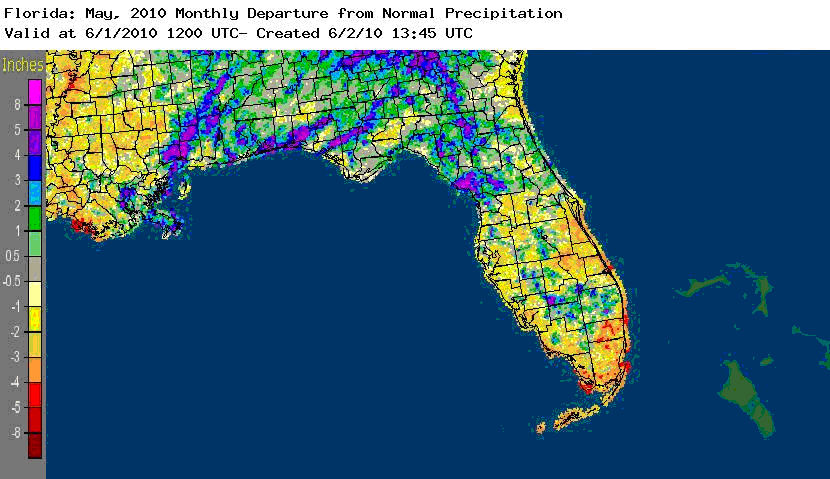
May rainfall below normal in most areas. Rainfall totals for May were below normal at most stations (Table 3). An exception is Pensacola where the monthly total of 7.98 inches was more than three and one half inches above normal. Daily rainfall records set during May are in Table 4. In particular, the daily amount of 2.69 inches at Pensacola on the 16th exceeded a record in existence since 1945. Further, Figure 1 depicts bands of above-normal monthly rainfall in northwestern and northern parts of the state. Areas of well-below normal monthly rainfall are evident in southern areas.
Table 3: May precipitation totals and departures from normal (inches) for selected cities.
| Station | Total Rainfall | Departure from Normal |
| Pensacola | 7.98 | 3.58 |
| Tallahassee | 2.95 | -2.00 |
| Jacksonville | 1.65 | -1.83 |
| Orlando | 3.00 | -0.74 |
| Tampa | 1.84 | -1.01 |
| Miami | 3.42 | -2.10 |
| Key West | 0.49 | -2.99 |
Table 4: Daily rainfall records (inches) set during May (compiled from NWS).
| Date | Station | Amount | Previous Record |
| 4 | Apalachicola | 2.52 | 0.88 in 1968 |
| 5 | Vero Beach | 2.11 | 1.69 in 1968 |
| 16 | Pensacola | 2.69 | 2.48 in 1945 |
| 17 | Daytona Beach | 1.59 | 0.65 in 1976 |
Figure 1. A graphical depiction of the monthly rainfall departure from normal (inches) for May is given in the figure below (courtesy of NOAA, NWS).
ENSO reaches neutral phase. Sea surface temperatures in the equatorial Pacific Ocean have cooled to be only 0.2° C above normal, designating a neutral phase of ENSO. Above normal temperatures and below normal rainfall observed in most areas are consistent with conditions expected in Florida as an El Niño episode ends.
Hazardous weather. . No tornadoes were observed in Florida during May. Thunderstorms caused minor wind damage and downed power lines and trees in isolated locations throughout the month. One-inch diameter hail was observed near Gainesville on the 21st, near Suwannee Valley on the 22nd, near Asbury Park on the 24th, and near Mossy Head on the 29th. Hail up to the size of golf balls (1.75 inch diameter) was observed in Tallahassee on the 28th.
Agricultural and other impacts. Early in the month, heavy rains delayed fieldwork and flooded pastures in the Panhandle. By mid-month, drier, warmer conditions allowed 90% of the northern pasture to return to fair or good conditions. Scattered rains maintained soil moisture and aided emergence of newly planted peanuts and cotton in the Panhandle and northern Peninsula. Growing conditions were good in citrus areas. A delayed watermelon harvest due to very cold weather during winter and early spring led to an overabundant supply during May.