Prepared by Melissa Griffin and David F. Zierden. Thanks to L. Zuromski.
Florida Climate Center
The Florida State University
Tallahassee, FL

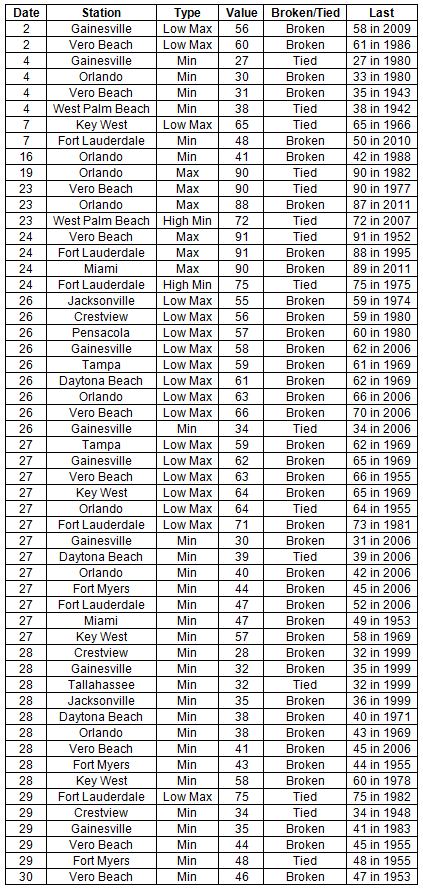
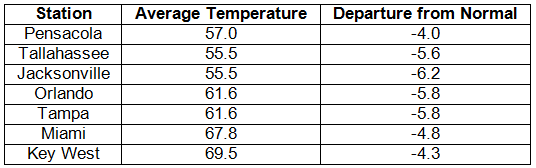
Average temperatures well below normal across the state in March. Average temperatures were well below normal for March across the entire state (Table 1 and Appendix 1). Departures from normal ranged from -4.0˚F to -6.0˚F across Florida, and there are reports of some locations that were -8.0˚F below normal. Overall, the average temperatures for March 2013 were colder than meteorological winter (Dec 1st- Feb 28th) and were significantly different than March 2012, when some locations were more than 6.0˚F above the normal. March 2013 was the 2nd coldest at both Jacksonville and Gainesville, the 5th coldest at Tallahassee and Tampa, the 6th coldest at Fort Myers, the 7th coldest at Pensacola, Orlando and St. Petersburg and the 8th coldest in Key West. Multiple maximum temperature or high minimum temperature records were either tied or broken (Appendix 2); there were only 2 record minimum temperatures that were broken in February.
Table 1: March average temperatures and departures from normal (°F) for selected cities.
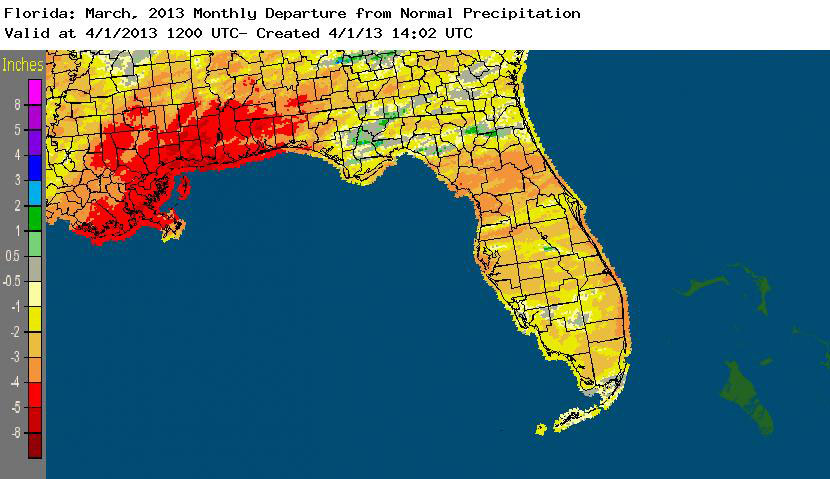
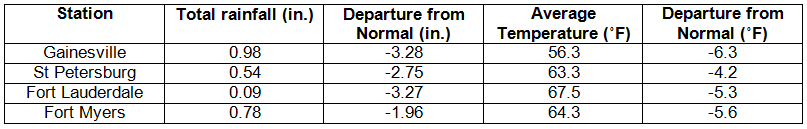
Rainfall totals varied across the state in March. Rainfall totals across the state varied in March (Table 2), though most of the state reported totals that were below normal. Localized portions of the northeast Florida and Big Bend regions recorded above normal rainfall (+1-2”), while the peninsula and Panhandle were 2 to 5 inches below normal precipitation (Figure 1). March 2013 was the 5th driest on record at Pensacola, and only 35 precipitation records were broken in March — 11 of those records were for totals under an inch (Table 3). There are still drought concerns as the 3-month outlooks predict below normal rainfall for the spring dry season.
Table 2: March precipitation totals and departures from normal (inches) for selected cities.
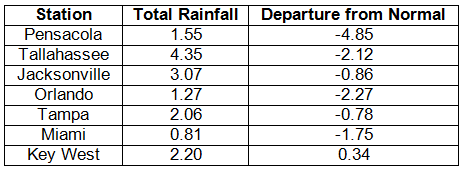
Table 3: Select daily rainfall records (inches) broken during March (compiled from NOAA, NWS).
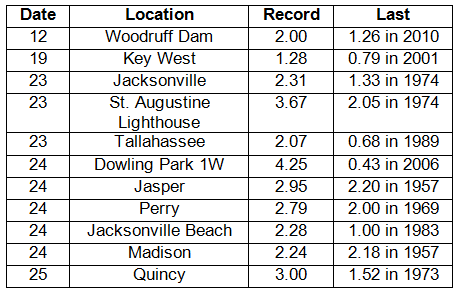
Figure 1: A graphical depiction of the monthly rainfall departure from normal (inches) for March is given in the figure below (courtesy of NOAA, NWS).
ENSO-neutral conditions continue in the Pacific. As of April 1st, neutral ENSO conditions continue to be reported for the equatorial Pacific. Equatorial sea surface temperatures (SST) are near average to below average across much of the Pacific Ocean. ENSO-neutral conditions are favored to continue through the summer 2013. The atmospheric circulation during over the last couple of months has been somewhat variable due to an active Madden-Julian Oscillation (MJO). The Climate Prediction Center (CPC) predicts above normal temperatures for the state, and they are also predicting below normal precipitation for Florida through June.
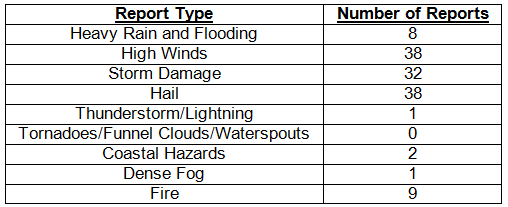
Hazardous weather events in March. March was a somewhat active month for severe weather across the state, with 129 severe weather reports made during the entire month. The month started out with multiple reports of fires near Daytona Beach, Ocklawaha, and Juniper Springs. The Hopkins Prairie Wildfire grew to over 1900 acres and destroyed 10 homes in Marion County. Low astronomical tides were seen on the 6th at Mayport and Dungeness due to tidal levels that were reported below the mean low water level and were also 1.0 to 1.5 ft below the predicted tidal level. Dense fog on the 20th reduced visibilities to less than ¼ mile near Ortona along State Road 78. Also on the 20th, a severe thunderstorm produced high winds and reports of nickel-sized hail in and around the Miami area.
From March 23rd to 25th, 103 of the 129 severe weather reports were recorded. A low pressure system in Louisiana set up an interesting weather event as a warm front lifted through the Panhandle on the 23rd and 24th, spawning one round of severe weather, and a second round of severe weather hit the state as the cold front pushed through on the 24th and 25th. On the morning of the 23rd, numerous hail reports came in from locations along the Florida Panhandle and Big Bend, including Panama City Beach, Wewahitcha, Altha, Chattahoochee, and Wakulla Springs. Hail sizes ranged from dime (0.75”) to quarter (1.00”) at these locations. One particularly strong thunderstorm moved east along and parallel to I-10 from Tallahassee toward Jacksonville and triggered multiple reports of hail and storm damage. An Emergency Manager in Bradford County received reports of baseball-sized hail (2.75”) near Lawtey, FL. In addition to the hail and winds, an observer in Lake City reported that over 2.00” of rain had fallen in a 30 minute time period as this storm moved through the area. The same severe thunderstorm caused heavy rains, storm damage and more hail reports as it moved into the town of St. Augustine. Later on the 23rd, lightning caused a house fire in Milton, and storm total rainfall over 2.50” were reported by observers in and around Jacksonville. The 24th saw more reports of storm damage and high winds across much of the Panhandle, Big Bend and northern peninsula of the state. A measured wind gust of 75 mph was taken at the Orlando International Airport, and a gust of 86 mph was measured in the Lake Buena Vista area. Dime to quarter sized hail was reported across the central part of the state from Tampa to Orlando to Titusville. Trees were uprooted and numerous homes sustained damage as the cold front pushed through the area.
Table 4: Breakdown of storm reports submitted in Florida during the month of March (compiled from Southeast Regional Climate Center).
Agricultural and other climate-related impacts. At the beginning of March, producers in northern Florida were busy assessing crops for damage following a second week of freezing temperatures and heavy rains. While much of the state received minimal to no moisture, portions of the Panhandle had accumulated more than 5 inches during the first week. Winter wheat benefited from the recent rains, and moderate to heavy bloom was observed across the state’s citrus region. The second week in March brought more cold weather to the state, with more than half the state recording sub-freezing temperatures. Citrus producers maintained heavy irrigation in their orchards as bloom progressed, but the dry conditions continued to hamper the citrus region. Winter vegetable harvest was in full swing, though producers assessed fields for damage from the cold snaps and strong winds. From March 11th to 17th, growers were irrigating one to two times a week in the citrus belt to keep moisture in the ground and on the trees. Cold weather lingered in Florida and slowed vegetable growth in some areas. Land in the Panhandle was being prepared for peanuts. Strawberry harvesting started earlier than expected. By the end of the month, topsoil moisture levels across the state improved slightly, though irrigation continued in areas still impacted by drought conditions. Unseasonably low temperatures left many fruit and vegetable growers worrying about late season frost damage. Peanuts and corn were planted in the Panhandle, while sugarcane harvest was winding down for the season.
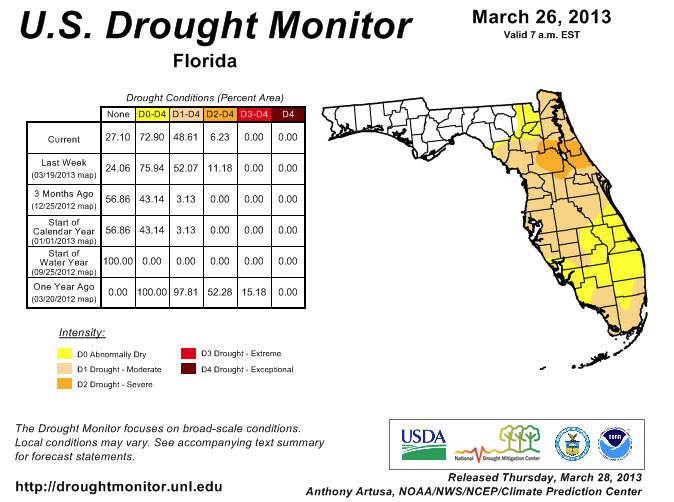
While the statewide rainfall totals varied greatly across the state during March, most of the state saw below normal rainfall during the month. Since the release of the drought monitor on February 26th, the Panhandle has remained drought free, while the Peninsula and north Florida have continued to be plagued by dryness. The areas of moderate drought have expanded to cover about 48% of the state, including much of central Florida and portions of Broward, Collier, Dade, and Monroe counties. The area of severe drought in northern Florida has eased due to the heavy rains at the end of March, now only reported in Flagler, Lake, Marion, Putnam, and Volusia counties. Now that the state has officially entered spring, the normal rainfall during the months of April and May are some of the lowest for the year at many locations. The CPC has predicted that the three-month rainfall amounts for April, May and June will be below these normal values, which could put the state at a greater risk of a worsening drought.
Figure 2: Drought conditions in Florida as of March 26, 2013 (courtesy of U.S. Drought Monitor).
Appendix 1: Additional March departures from normal data for Florida locations.
Appendix 2: Select daily maximum and minimum temperature records (° F) tied or broken during March (compiled from NOAA, NWS).