Prepared by Melissa Griffin and David F. Zierden
Special thanks to R. Worsnop
Florida Climate Center
The Florida State University
Tallahassee, FL

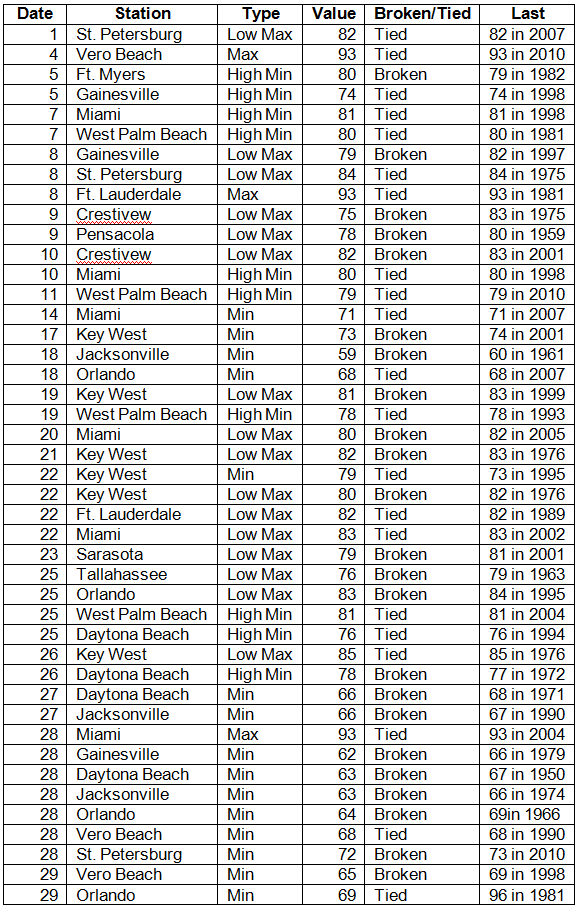
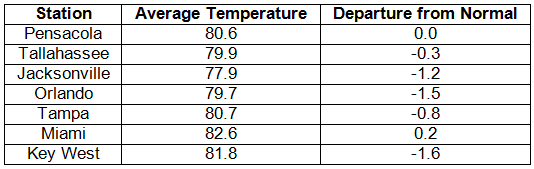
Average temperatures varied across the state in June. Average temperatures were below normal to slightly above normal for June across the entire state (Table 1 and Appendix 1). Departures from normal ranged from -1.6˚F at Key West to 0.2˚F at Miami. June 2012 was rather cool for Florida, especially toward the end of the month, when record heat affected most of the nation. Sea breeze rainfall, along with Tropical Storm Debby, helped keep temperatures from reaching record highs (only 3 record highs were broken in June). The month saw numerous records tied or broken (Appendix 2), with the majority of those being from low maximum or minimum temperatures.
Table 1: June average temperatures and departures from normal (° F) for selected cities.
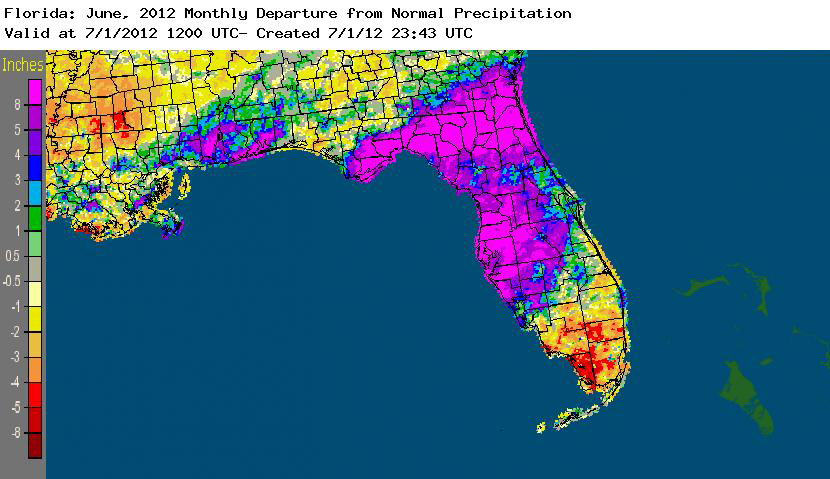
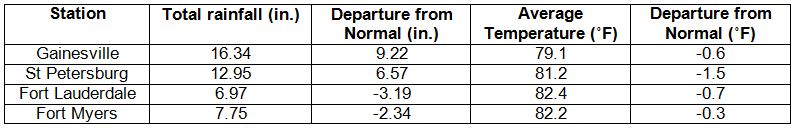
Rainfall totals were well above normal for the majority of the state in June. Rainfall totals at most locations in the state were well above normal in May (Table 2). Portions of the Big Bend, North and Central Florida, and along the west coast recorded rainfall totals that were in excess of 8.00” above normal, while parts of South Florida and the Panhandle saw below normal rainfall. June 2012 was the wettest on record in Tampa (the previous record June rainfall was 18.52” in 1945), the 2nd wettest at Pensacola, 3rd wettest at Jacksonville, and 7th at Tallahassee. Rainfall was also above normal at Fort Lauderdale and Gainesville (Appendix 1). On the 9th, Pensacola reported a record rain event of 13.31” in a 24-hour period (Table 3). Parts of southern Escambia and Santa Rosa counties experienced extensive flooding on the 9th (see Hazardous Weather section for storm pictures). A CoCoRaHS observer along Perdido Key reported a 24-hr rainfall total of 21.70” from the event (Figure 1). From June 23-29th, Tropical Storm Debby impacted the state, dumping an estimated 2.00” to 20.00” (Figure 2). Unofficial reports of over 30.00” were reported in Wakulla County. Areas that experienced the heaviest rains saw significant flooding. Some area rivers surpassed their record flood stage heights (see Hazardous Weather section for pictures). Areal patterns of monthly rainfall relative to normal are depicted in Figure 3.
Table 2: June precipitation totals and departures from normal (inches) for selected cities.
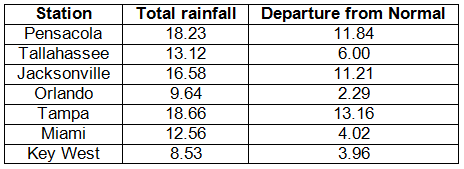
Table 3: Select daily rainfall records (inches) broken during June (compiled from NOAA, NWS).
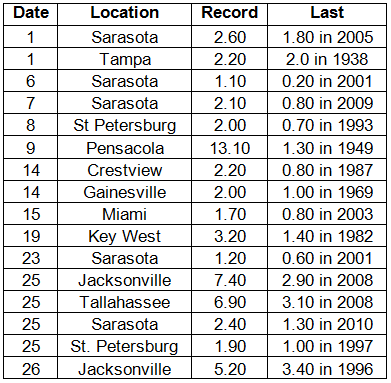
Figure 1: A graphical depiction of radar-estimated rainfall amounts from June 8 to 10 (courtesy of NWS Mobile).
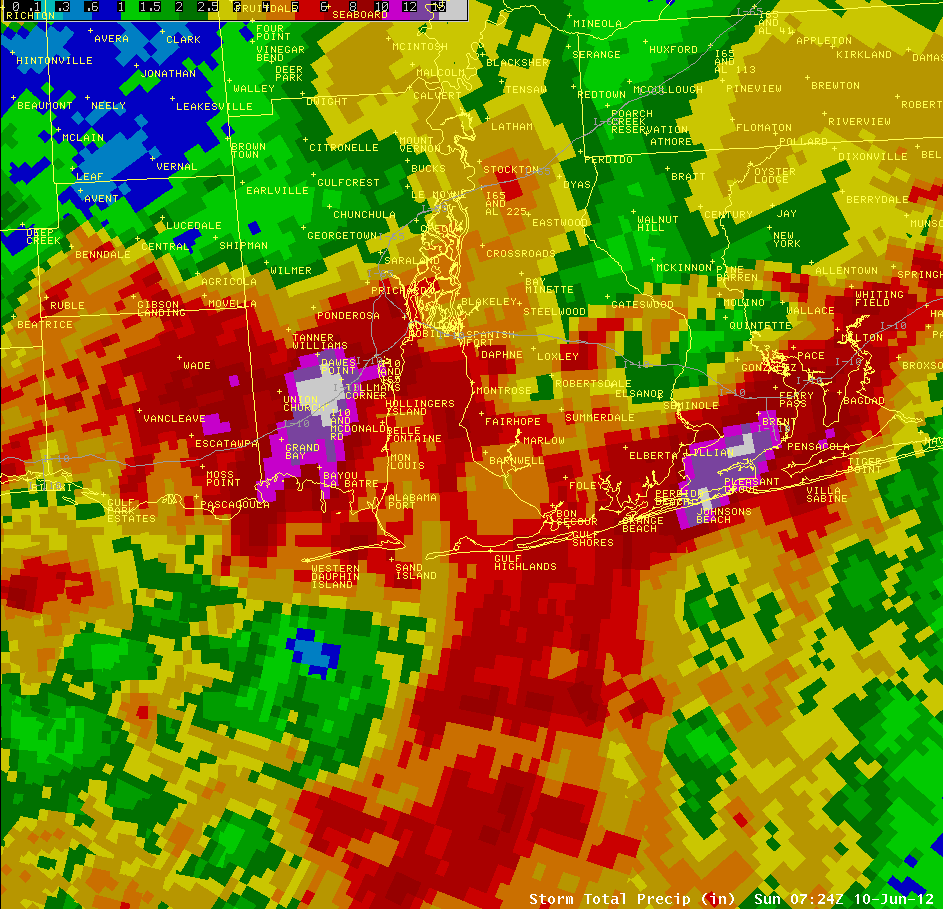
Figure 2: A graphical depiction of radar-estimated rainfall amounts from June 23 to 29, during the time that Tropical Storm Debby passed through the state (courtesy of NOAA, NWS).
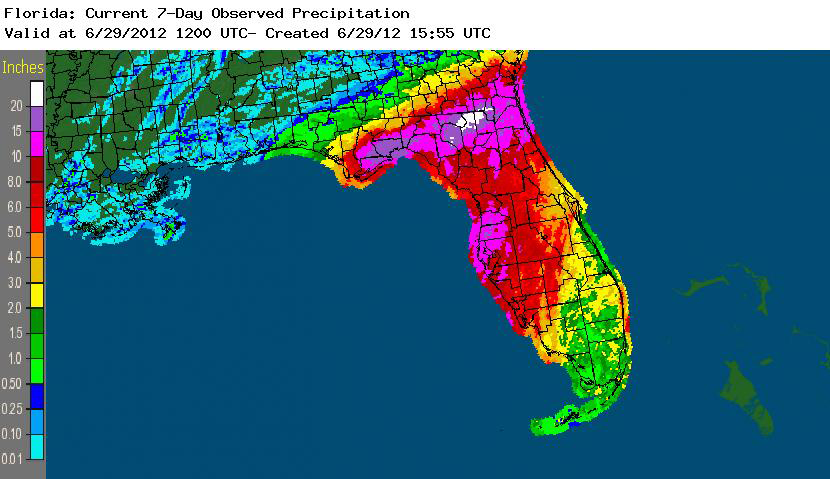
Figure 3: A graphical depiction of the monthly rainfall departure from normal (inches) for June is given in the figure below (courtesy of NOAA, NWS).
ENSO-neutral conditions continue in the Pacific. Neutral ENSO conditions continue to be reported for the equatorial Pacific. Equatorial sea surface temperatures (SST) are near average in the central Pacific but above average in the eastern Pacific Ocean. ENSO-Neutral conditions are expected to continue in the Northern Hemisphere through summer 2012. The Climate Prediction Center (CPC) continues to predict warmer than normal temperatures and is now predicting above normal precipitation through September. There is a 50% chance that the equatorial Pacific will warm enough that an El Niño could set up by the fall or winter of 2012.
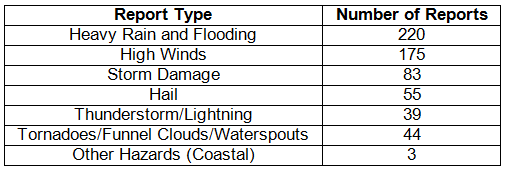
Hazardous weather events in June. June was a very active month for severe weather in Florida. In total, there were 619 storm reports made last month.
Table 4: Breakdown of storm reports submitted in Florida during the month of June. (Compiled from Southeast Regional Climate Center.)
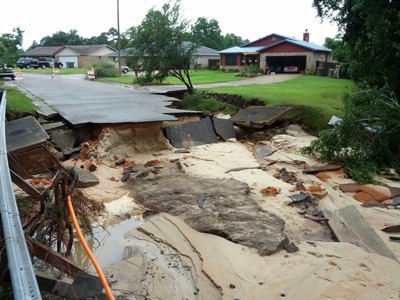
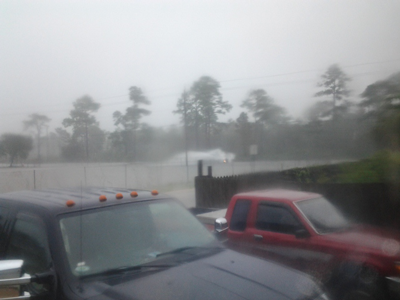
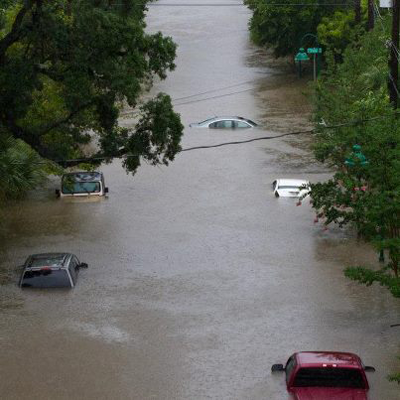
Pensacola Flood - On June 9, tropical moisture streamed northward from the Gulf of Mexico over a small portion of the central Gulf Coast (from Jackson County, Mississippi, to Santa Rosa County, Florida), causing significant rainfall in a short period of time. Radar estimates from the event show two areas of rainfall in excess of 15”: Tillman’s Corner in Baldwin County, Alabama, and Southern Escambia County in Florida (Figure 1). The daily record rainfall for Pensacola was 13.13” in a 24-hour period. It’s the second highest single day rainfall total on record at the station. Pensacola’s only wetter day took place on October 5, 1934, when a tropical storm produced 15.29” of rain. Flooding was reported in numerous areas, while flash floods were reported in some of the hardest hit areas. Many local roads were covered by rising water; retention ponds overflowed; and many home and business, including a prison, were flooded.
 |
 |
|
Rain damage in the Woodridge Subdivision on June 9. (Courtesy L. Taylor) |
Retention pond overflowing onto Gulf Beach Highway. (Courtesy L. Taylor) |
 |
 |
|
Flooded road seen from the Cervantes Street Bridge. (Courtesy S. Grobstig) |
Flood waters seen around Escambia High School. (Courtesy S. Grobstig) |
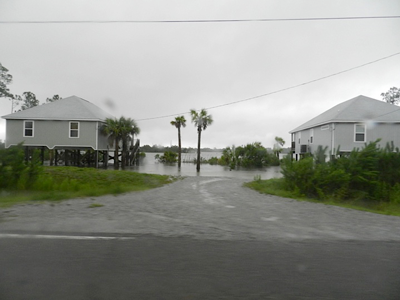
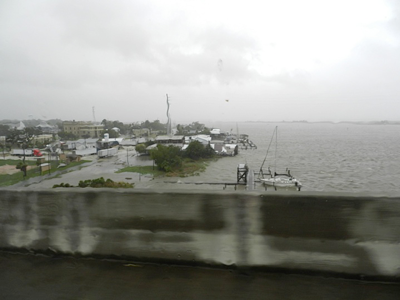
Tropical Storm Debby - On June 24th, a broad area of low pressure that had been persisting in the northwest Caribbean Sea and Gulf of Mexico became better organized and formed into Tropical Storm Debby in the Eastern Gulf. The storm moved slowly northeast, becoming nearly stationary south of Apalachicola on June 25. While Debby never strengthened significantly, the slow-moving storm brought a wide coverage of heavy rainfall to Central and North Florida on the 24th and 25th. The heaviest rains on June 25 occurred along the coastal areas of the eastern Panhandle, where portions of Franklin and Jefferson Counties and nearly all of Wakulla County received from 10 to over 15 inches of rainfall. Another strip of 10 to 15 inches fell later that evening over portions of Baker, Columbia, Suwannee, and Hamilton Counties. Debby finally made landfall on the morning of June 26 near Cedar Key, Florida, before traversing the state and moving off into the Atlantic Ocean. The rains from Tropical Storm Debby were a double-edged sword, bringing relief from over two years of drought to a majority of the state but also causing flooding where the heaviest rain fell. In Wakulla County, the Sopchoppy River had record flooding which damaged or destroyed many homes along the river bank. Many other parts of the county were also flooded due to the heavy nature of the rainfall and very little topography or drainage on the flat coastal plain. Flooding also occurred on the Suwannee and Santa Fe Rivers, and there was record flooding on the St. Mary's River in northeast Florida. Homes and businesses were damaged from standing water in Live Oak and the surrounding area. A storm surge up to 6 feet caused moderate damage to coastal communities, including East Point, St. George Island, St. Marks, and Cedar Key.
 |
|
|
Aerial view of Tropical Storm Debby west of Tallahassee on June 25. (Courtesy R. Weihs) |
|
 |
 |
|
View of coastal surge along US 98 on June 24. (Courtesy H. Holbach) |
View of coastal surge from a bridge on US 98 in Apalachicola on June 24. (Courtesy H. Holbach) |
 |
 |
|
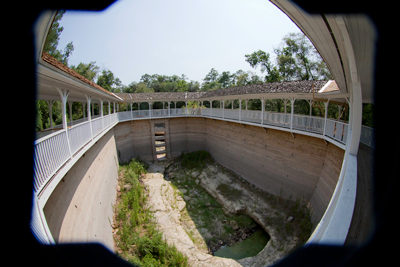
Picture of White Springs and springhouse in early 2012. The spring dried up in the 1990s. (Courtesy J. Moran) |
Picture of White Springs springhouse on June 27 with the Suwannee River at flood stage. (Courtesy C. Barnett) |
Agricultural and other climate-related impacts. At the beginning of the month, soil conditions were dry in most of the state, though some portions reported wet fields that delayed the harvest of some vegetables. Improvements of the drought conditions were seen over some of the citrus regions. Pastures still had not recovered from the ongoing drought, and some livestock managers were rotating their stock to prevent from overgrazing in fields. As the month progressed, rains in Escambia and Santa Rosa counties improved peanut and corn conditions. Rain across the state brought improvements to pastures and cattle conditions. By the 20th, early season planted corn showed signs of damage due to the dry weather, and cotton was being replanted in dry fields. Pastures benefited from the warm weather, and forage growth was seen due to the recent rains. Water levels in ponds were still low despite the rains. Prior to rains from Tropical Storm Debby, irrigated and non-irrigated fields were in good conditions across Florida.
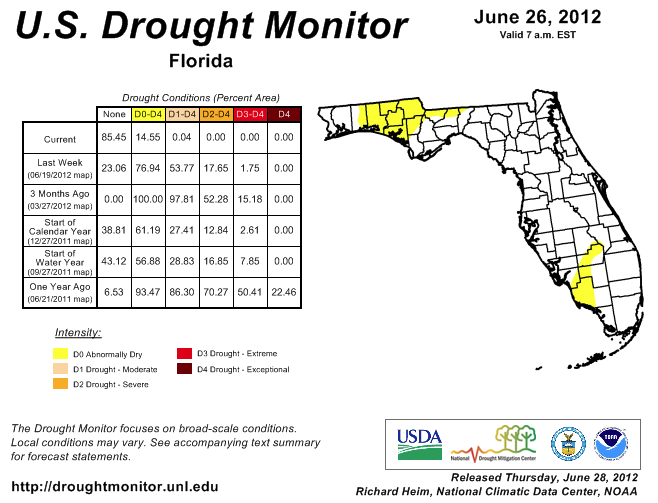
Drought conditions dramatically improved during the month of June. There were multiple rain events that impacted the state throughout the month that lead to an almost complete reduction of all drought classifications in Florida. Since May 29, the state has gone from 85% of the state categorized as in some type of drought to only 15%. The beginning of June saw improvement of the drought along Florida’s west coast. During the weekend of June 8-10, torrential rains in Escambia, Santa Rosa and portions of Okaloosa Counties alleviated the drought conditions. Other portions of the western Panhandle and Big Bend region saw a 1- to 2-category improvement in their drought designations. Sea breeze thunderstorms during the middle of the month helped ease the drought along portions of the east coast. However, it was Tropical Storm Debby that proved to be a drought buster for most of the state. Radar estimates and rain gauge data indicate that parts of north Florida had as much as 20” of rain from the slow moving tropical system. Numerous streams and rivers in the state are reported at or above flood stage. The only part of the state that did not see beneficial rainfall from Debby were the counties west of the Apalachicola River. Abnormally dry conditions are still being reported in Collier, Glades and Hendry Counties in South Florida and in Walton, Holmes, Washington, Bay, Jackson, and Calhoun Counties, along with northern portions of Gadsden, Leon and Jefferson Counties.
Figure 4: Drought conditions in Florida as of June 26, 2012 (courtesy of U.S. Drought Monitor).
Appendix 1: Additional June departures from normal data for Florida locations.
Appendix 2: Select daily maximum and minimum temperature records (° F) tied or broken during June (compiled from NOAA, NWS).