Prepared by Preston Leftwich, David F. Zierden, and Melissa Griffin
Florida Climate Center
The Florida State University
Tallahassee, FL

Note: Comparisons to normal in this summary are based on averages for the period 1971-2000. Beginning July 1, 2011, averages for the period 1981-2010 are the normal values of temperature and precipitation.
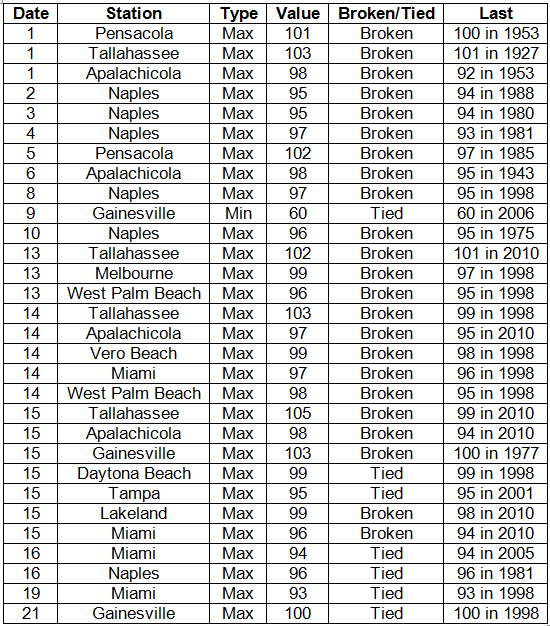
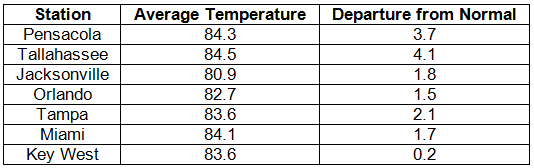
Average temperatures continue above normal in June. Average temperatures were well-above normal in the north during June (Table 1). Many daily maximum temperature records were tied or broken, especially during the first half of the month (Appendix). Three stations-Naples (2nd-4th), Tallahassee (13th-15th), and Miami (14th-16th)-observed record daily maxima on three consecutive days. The maximum temperature at Tallahassee on the 1st (103° F) broke a record in existence since 1927. A maximum of 98° F at Apalachicola on the 6th broke a record in existence since 1943. On the 15th, a maximum at Tallahassee (105° F) not only set a new record for the date but is now the highest temperature on record there. The previous highest temperature was 104° F, observed on June 20, 1933. On the 9th, the temperature dipped to a minimum of 60° F at Gainesville, tying the daily record established in 2006.
Table 1: June average temperatures and departures from normal (° F) for selected cities.
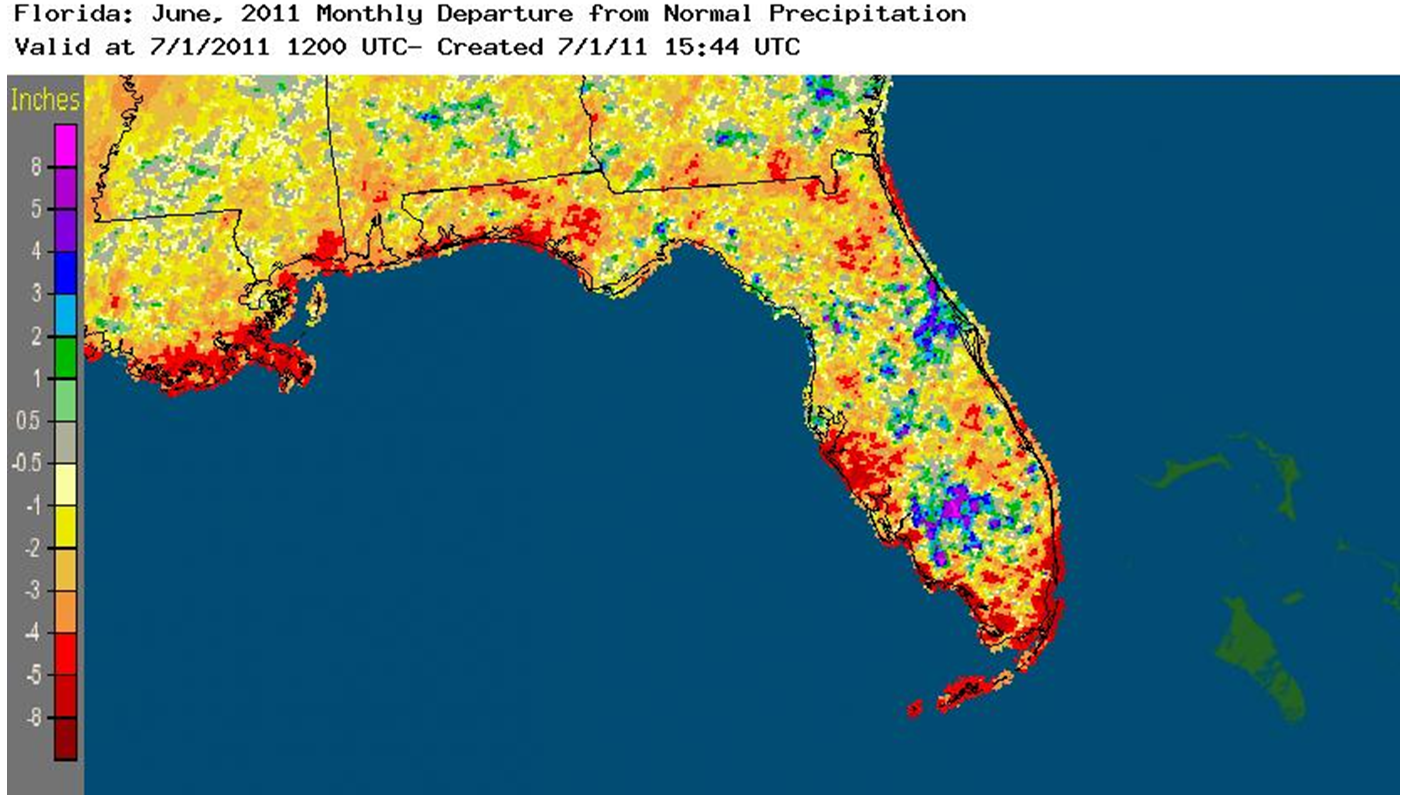
Rainfall totals below normal in most areas in June. Rainfall totals for June were below normal across most of the state (Table 2). Monthly totals at Pensacola (1.64 in) and Key West (0.71 in) were more than four and three inches below normal, respectively. In contrast, the monthly total at Miami (12.22 in) was more than three inches above normal, aided by a daily total of 3.19 inches observed on the 30th. Daily totals at Fort Myers (4.22 in) and Daytona Beach (1.92 in) on the 29th broke records in existence since 1909 and 1932, respectively (Table 3). In addition, a monthly total of 1.15 inches at Miami Beach was the driest June on record, breaking the previous record of 1.45 inches observed in 1927. A monthly total of 1.20 inches at Sarasota denoted the second driest June since records began in 1911. Although most areas of the state recorded below normal monthly totals, there were areas in the southwest and near the central east coast where totals were above normal (Figure 1). At Daytona Beach a monthly total of 12.29 inches was 6.60 inches above normal.
Table 2: June precipitation totals and departures from normal (inches) for selected cities.
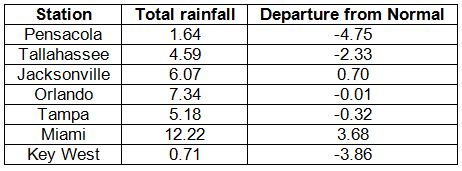
Table 3: Daily rainfall records (inches) tied or broken during June (compiled from NOAA, NWS).
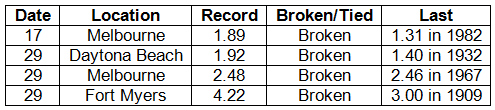
Figure 1: A graphical depiction of the monthly rainfall departure from normal (inches) for June is given in the figure below (courtesy of NOAA, NWS).
ENSO reaches neutral phase during June. Sea surface temperatures in the equatorial Pacific Ocean continued to warm slightly and reached near-normal values during June, indicating a neutral phase of El Niño-Southern Oscillation (ENSO). Continued dryness in the northwest and some areas of above-normal rainfall in central and southwestern parts of the state were consistent with lingering effects of the recent La Niña period.
Hazardous weather. June was an active month for severe thunderstorms. Many events of downed trees and power lines occurred. Most events occurred in north and central parts of the state, but notable severe events occurred in the south, too. On the 5th, trees were downed in Tallahassee. The next day, there were numerous trees downed across north and north-central areas. Golf-ball size hail (1.75 inches in diameter) was observed in Bellview and Newburn. On the 12th, golf-ball hail and 64 mph wind gusts were observed at Weston, and one-inch diameter hail and 60 mph winds were observed at Pembroke Pines. A confirmed downburst downed trees and produced some structural damage near Jacksonville on the 13th. On the 15th strong winds were reported at Winter Haven (63 mph) and Titusville (67 mph). Trees were downed in Immokalee, Naples, and Marco Island. Gusts estimated to be 70-80 mph occurred at Belle Meade, and gusts to 58 mph were observed at Naples and Marco Island. On the 17th, a thunderstorm produced a wind gust of 65 mph at Gainesville. This is the highest wind gust on record there. Trees were downed near Pomona Park and Daytona Beach, Orlando International Airport recorded a wind gust of 70 mph, and Patrick AFB recorded a gust of 64 mph on the 18th. One plane was flipped and several small planes were moved as 76 mph gusts hit Panama City Airport on the 24th. On the 26th, one-inch hail was observed at Ponce De Leon and De Funiak Springs. Trees were downed at Tallahassee, Daytona Beach, White Springs, Hilliard, and Live Oak, and a waterspout knocked out power to St. George Island. On the last day of the month, many trees and power lines were downed around Tallahassee, Woodville, Crawfordville, and Palm Springs. Thunderstorms produced gusts of 72 mph at Pompano Beach and 64 mph at Tallahassee.
Agricultural and other impacts. Excessive heat and continued drought had notable impacts during June. In the north, corn, cotton, and peanuts were severely affected by continued drought conditions. In the south, the prime growing season for sugarcane was affected by dryness and subsequent watering restrictions. Lack of widespread rainfall and excessive heat produced favorable conditions for the development and spread of wildfires. At mid-month there were over 400 active wildfires in the state. Cattle producers sent an above normal number of livestock to feed lots due to the poor condition of pasture. All locks in the northern portion of Lake Okeeechobee were closed to boat traffic due to the low water level. Water restrictions remained in place for both agricultural and general use in the southeast. By the end of the month, drought conditions had become exceptional in the northwest and extreme southeast.
Appendix: Daily maximum temperature records (° F) tied or broken during June. (Compiled from NOAA, NWS)